

Abstract
Objective
We demonstrate the utility of the time-varying effect model (TVEM) for the analysis of psychotherapy data, with the aim of elucidating complex patterns of change over time and dynamic associations between constructs of interest. Specifically, we examine the association between depression and co-occurring anxiety in a sample of adults treated with interpersonal psychotherapy for depression (IPT) or a variant designed to address both depression and co-occurring anxiety (IPT-PS, IPT for depression with panic and anxiety symptoms).
Method
Seventy-eight (82% female) adult outpatients with major depression and co-occurring anxiety were assessed at each of 16 outpatient treatment sessions using the Hamilton rating scales for depression and anxiety.
Results
On average, depressive symptoms declined in a quadratic form over the course of treatment. While the association between anxiety and depression was modest early in treatment, it strengthened over the middle and latter treatment phases. Finally, exploratory analyses suggest that while IPT and IPT-PS were similarly effective in reducing depressive symptoms, IPT-PS may be more effective at uncoupling the association between core anxiety and depressive symptoms.
Conclusions
Findings point to the utility of the TVEM for psychotherapy research, and the importance of assessing anxiety in the course of treating depression, especially following the initial phase of treatment (i.e., after session 5).
Keywords: Time Varying Effect Model, Interpersonal Psychotherapy, Depression, Anxiety, Quantitative Methods
A fundamental goal of most psychotherapy is to decrease deleterious behaviors while increasing adaptive functioning. However, psychological symptoms rarely occur in isolation, and instead are coupled with specific contingencies, linked with problematic behaviors, and connected with maladaptive processes. As a result, clinicians often seek not just to decrease a problematic behavior, but also to change the connection between two or more behaviors in order to disrupt the maladaptive processes that maintain psychopathology. Quantitatively, this would be represented by a dynamic relationship among variables—or, stated otherwise, an association that changes over time. To fully understand the processes by which psychotherapy effects behavior change, the statistical methods used to study psychotherapy must be sensitive to changes in the phenomena of interest. Here we showcase the time-varying effect model (TVEM; Tan, Shiyko, Li, Li, & Dierker, 2012) that holds considerable promise for investigating the processes and mechanisms of psychopathology and psychotherapy, precisely because it can model the temporally dynamic relationship among constructs of interest. We apply this technique to data from outpatients undergoing treatment for depression complicated by co-occurring anxiety symptoms to characterize the dynamic covariation of anxiety and depression symptoms over the course of treatment.
Associations as Outcome and Process Variables
Many of the processes hypothesized to drive change in psychotherapy involve not only the decrease in the level of one variable, but also the dynamic change in the association among multiple variables. For example, some have argued that the degree to which negative cognitions and depressive symptoms remain associated after treatment predicts depression relapse and that cognitive therapy better serves to decouple the two, as compared with other forms of treatment (Beevers & Miller, 2005). Similarly, dialectical behavior therapy (Linehan, 1993) for borderline personality disorder concurrently seeks to increase emotional differentiation (i.e., unlink distinct negative emotions) and to diminish the link between negative emotions and certain behaviors (e.g., self-injury, interpersonal hostility). Similarly, contemporary cognitive behavioral treatment for panic disorder (Barlow & Craske, 2007) teaches individuals to tolerate anxiety of feared situations without reverting to typical escape or avoidance behaviors. Thus, in each of these treatments the desired outcome is not merely to decrease the level of a specific symptomatology, but to effect a more lasting change by ‘unlinking’ or ‘decoupling’ processes that serve to maintain psychopathology.
Examples of cognitive, emotional, and behavioral links that are presumed to underlie pathology and that therapists seek to change are ubiquitous in psychotherapy research and treatment, and include phenomena such as emotional distress and suicidal thinking; seeking out others for help as opposed to withdrawing when distressed; replacing externalizing behaviors with other strategies for mood regulation; and attenuating the link between stimuli and phobic responses. In spite of this, hypotheses about dynamic associations are rarely directly tested, and pose unique methodological challenges for both traditional and recently developed analytic techniques. Psychotherapy research would benefit from the development and application of quantitative methods that accommodate and model the dynamic interdependence of multiple phenomena of interest to evaluate mechanisms of change that influence the course of treatment.
Contemporary Methods for Studying Change
A number of modern quantitative techniques are available for the study of change and the associations among variables over time, such as the latent growth curve model (LGCM; Bollen & Curran, 2006; McArdle, 2009; Singer & Willet, 2003) and multilevel models (MLMs; Raudenbush & Bryk, 2002; Hox, 2010). However, despite their sophistication and advantages, neither approach can readily address the question of whether two psychological variables show a dynamic (i.e., changing) relationship with each other over the course of therapy. To contrast the utility of the TVEM for psychotherapy data with conventional models of longitudinal change, we first consider LGCMs and MLMs.
The LGCM is an increasingly popular approach for studying trajectories of change that has a number of attractive features, including that it provides information not only about the mean level of change, as with repeated-measures ANOVA, but also the degree of interindividual heterogeneity in the observed trajectories; it is also highly flexible for estimating different shapes of change (Bollen & Curran, 2006; McArdle, 2009; Preacher, Wichman, MacCallum, & Briggs, 2008; Singer & Willett, 2003). In LGCMs, the average trajectory of change for a sample is estimated as a function of growth factors, most commonly an intercept factor, which captures the level of the curve at some point, and a linear slope, which captures the rate of change. In addition, LGCMs can be adapted to model various non-linear patterns of change that are likely to occur over the course of psychotherapy (Bollen & Curran, 2006; McArdle, 2009). For example, quadratic and cubic patterns, as well as curves that fit uncommon patterns in the data, are easily estimated using a variety of simple adaptations (McArdle & Bell, 2000). Furthermore, the LGCM can be extended to growth mixture modeling, offering a person-oriented approach to the study of trajectories of change over time (Morin et al., 2011; Muthén, 2004; Wright & Hallquist, in press). Growth curve models can be estimated in either a SEM or MLM framework.
Estimating the relationship among the rates of change in more than one psychological system can be accommodated in LGCM by extending the model to what have been termed associative, or parallel-process LGCMs (Bollen & Curran, 2006; Preacher et al., 2008). In this approach, two (or more) LGCMs are estimated in tandem, and the intercept and slope factors are allowed to covary in order to estimate the association among the growth factors. In this respect, the LCGM might appear to address the questions posed above, by modeling the associations among longitudinal rates of change. Yet, growth factors in LGCM reduce all of the time-varying information to a single (or possibly multiple in the case of models with quadratic or cubic growth) rate of change estimate, which then can be associated across psychological systems. In other words, temporally varying information is discarded from the model, leaving associations among growth factors that represent the stable association over the entire series. Average associations among growth rates over time are often of interest in clinical research (e.g., Littlefield, Sher, & Wood, 2009; Wright, Pincus, & Lenzenweger, in press), but the conventional LGCM is not sufficiently sensitive to effects that vary over time, such as questions about the changing covariation among variables over the course of psychotherapy.
In addition, when highly non-linear change occurs, it becomes difficult to interpret the associations among the growth factors. Although the LGCM can accommodate a variety of trajectory patterns, this is typically accomplished by adding additional latent factors to represent a certain component of the growth curve (e.g., a cubic factor to allow for an “S-shaped” trajectory). Consequently, rather than assuming that time-varying effects arise because of a single underlying, but unknown, change function, the LGCM is usually limited to relatively simple parametric growth curves (e.g., quadratic), each component of which is represented by a separate latent factor. This approach is particularly problematic when one is interested in making inferences about the time-varying association between two processes because the LGCM separates the associations in terms of each growth factor. For example, if growth trajectories for anxiety and depression both had roughly cubic shapes, four growth factors (i.e., intercept, linear, quadratic, and cubic) would be required for each process in a parallel-process LGCM, resulting in 16 covariance parameters that jointly represent anxiety-depression covariation. This is not only practically burdensome, it is often not scientifically meaningful to interpret associations in this manner. Rather, we believe that researchers are often interested in understanding how growth curves – whatever their shape – can be compared and interpreted as a whole, a goal entirely consonant with the TVEM approach. In addition, like all latent variable techniques, LGCM and growth mixture models are ideally implemented in large N data sets (Muthén & Curran, 1997), which limits their utility for more modestly sized psychotherapy outcome trials. Finally, the LGCM is further limited in its ability to parsimoniously model a large number of data points, as might be the case in psychotherapy data (Preacher et al., 2008).
In MLM, two variables measured concurrently over time are treated as time-varying covariates (e.g., outcome and predictor), such that their association is derived from their fluctuations together over time (see e.g., top half of Figure 1). The association between variables is partitioned into the variance accounted for by within- and between-person effects. The between-person effect captures how variability in each person’s average level of the outcome is attributable to his or her average level of the predictor (e.g., do individuals who are more anxious on average over the course of treatment also have higher overall depression?), and thus does not vary across time. The within-person effect is derived from the time-specific deviations from an individual’s mean score on the covariate, representing the temporal covariation of scores. The standard time-varying covariate MLM provides an estimate of the average association between the predictor and outcome across the course of therapy, as well as individual variability around the mean association strength. Notably, however, such estimates are averages of temporally concurrent associations that do not capture relationships that vary in strength over time.
Figure 1.

Hypothetical example of the 3-month association of daily anxiety and depressive symptoms
To illustrate this point, we simulated a data set (Figure 1) representing a series of 90 assessments of anxiety and depression scores (cf. Shiyko, Lanza, Tan, Li, & Shiffman, 2012; Tan et al., 2012). We conceptualized these as daily assessments, or roughly three months worth of data on a hypothetical individual in treatment for depression. The association between anxiety and depression across the entire data stream is r = .54, which is akin to what emerge from a standard MLM. On the other hand, if we were to divide the data stream into 30-day segments, we would find that the association varies, starting at a strong r = .81, dropping to r = .51 during the middle month, and further decreasing to r = .29 in the final month. If these were real data, they would suggest that the link between anxiety and depression decreases across time, a potentially important finding that is lost in a standard MLM approach. We note that it is possible to estimate a true time-varying effect in MLM by including an interaction with time, yet this will realistically constrain the possible time-varying effects to only the most limited shapes of polynomial change before these models also become too unwieldy for practical use (echoing the points we raised above with regard to LGCM). Thus, although the LGCM and time-varying covariates in MLM exhibit various strengths in the estimation of growth trajectories and associations across time, neither approach is easily capable of accommodating questions related to time-varying associations that are often of interest in psychotherapy.
The Time Varying Effect Model
The conceptual underpinnings of the TVEM have been available for some time in the form of a varying-coefficient model (Hastie & Tibshirani,1993; Hoover et al., 1998), although only recently has the TVEM been made easily accessible for applied longitudinal data analysis through user-friendly software (i.e., a free SAS TVEM macro; Yang, Tan, Li, & Wagner, 2012). The recently described TVEM approach (Tan et al., 2012) is an extension of MLM that can accommodate complex and non-linear patterns of change when the data include a large number of longitudinal assessments (i.e., > 10; Tan et al., 2012). The TVEM uses a semi-parametric approach that imposes no specific shape of change on the outcome variable and allows for the associations between predictors and the outcome to vary dynamically across time. The central assumption is that change occurs in a gradual fashion that is free of sharp fluctuations. The suitability of the TVEM for probing dynamic associations among variables becomes apparent when considering the basic equation. Consistent with the substantive example we employ below, the dynamic change in depression scores over time as a function of concurrent anxiety is denoted by the TVEM equation:
| (1) |
where Depressionij and Anxietyij are each variables measured repeatedly for subject i at assessment j. The outcome, individual depression scores, and εij, the random errors, are each assumed to be normally distributed. At the superficial level, the TVEM appears similar to a standard MLM. The major innovation can be found in the intercept β0(tij) and slope β1(tij) terms, which are assumed to be continuous functions of time (t) (Tan et al., 2012). Thus, relative to an MLM, where single parameter estimates are derived for β0 and β1, the TVEM allows for the level of depression (β0) and the association between anxiety and depression (β1) to vary over time according to unknown, but smooth, curves. In any longitudinal model, such curves, regardless of their form, must be coded by one or more numerical coefficients that provide a model-based and time-specific estimate of the outcome. A key idea of the TVEM is that β0(tij) and β1(tij) are coefficient functions of time – a set of coefficients capable of optimally mapping the shape of change in the level of depression and the anxiety-depression association over time, respectively, with the primary goal of capturing the temporal dynamics, whatever their form.
Although there are a number of ways to represent such a model mathematically (Tan et al., 2012), the TVEM employs a spline approach (de Boor, 2001) to approximate temporally varying effects. More specifically, the time-varying shape of change is derived directly from the data by dividing the unknown and potentially highly complex function into intervals (often equally spaced over time), where a polynomial term is included to represent specific changes in the form of the relationship within each interval. The dividing points between intervals are termed knots, and the researcher chooses the number of knots. The number of intervals is equal to K+1, where K is the number of knots. Given a sufficient number of intervals, any pattern of change can be adequately approximated (see Shiyko et al., 2012; Tan et al., 2012; Yang et al., 2012 for an elaboration on the underpinnings of TVEM and further examples). The goal is not to examine each of the spline coefficients that comprise the coefficient function, but instead to have a single function of time that best maps a predictor onto the outcome at each time point. Although it is possible to calculate the value of these functions for each individual time point, it is generally most informative to depict them graphically, thereby drawing attention to the time-varying nature of the effect (for example, see Figure 2). The TVEM is semi-parametric in that the model residuals are assumed to be normally distributed at any given time point, but the coefficient functions summarizing the shape of an association over time are non-parametric, allowing for maximal flexibility in characterizing time-varying effects.
Figure 2.

Graphical summaries of time-varying effect model functions with 95% confidence intervals for time-varying depression intercept (top left panel), time-varying medication slope (bottom left panel), constant gender slope (bottom right panel), and time –varying anxiety slope (top right panel) over the course of 16-week interpersonal psychotherapy for depression. The vertical dotted line in top right panel reflects peak time-varying anxiety-depression relationship at session 9 of treatment.
Therefore, the TVEM is an ideal analytic tool for the substantive questions about the covariation of psychological and behavioral phenomena because it derives time-specific estimates of associations among constructs that are sensitive to potentially nonlinear or complex change patterns. It also simultaneously provides a time-varying estimate of the average outcome trajectory that is not constrained to a particular shape. In addition, much like MLM, in TVEM the schedule of measurement can vary across individuals, and the inter-observation variance structure can theoretically be specified in multiple ways (e.g., unstructured or autoregressive), although the ability to specify complex error structures is not currently available in the SAS TVEM Macro (Yang et al., 2012).
The TVEM has been proposed as a method for intensively sampled longitudinal data, in part because estimating the unique shapes of change directly from the data requires more data points per person. However, because the method is novel, relatively little is known about the boundaries of sample size and the optimal number of assessment points. Like MLM-based approaches, there are tradeoffs in terms of the necessary sample sizes depending on the number of assessments, the reliability of the data, and the pattern of actual responses in the data. Tan et al. (2012) suggest that 10 or more observations is likely sufficient with 100 or more persons. In the current study we employ a greater number of measurement points and a slightly smaller sample size for our primary analyses, and smaller subsamples for exploratory work. These issues bear explication, as the TVEM will be suitable for psychotherapy studies that by design include more frequent measurement (e.g., session-by-session or daily measurement), but not for those limited to a few measurement points. What remains attractive, however, is that the minimum recommended sample sizes and number of observations for TVEM remain modest relative to many latent variable techniques, and as a result many traditional psychotherapy studies fall within these bounds.
The Current Study: A TVEM of Psychotherapy for Depression and Co-occurring Anxiety
To demonstrate the utility of the TVEM approach for investigating dynamic phenomena in psychopathology and psychotherapy, we used this method to investigate the complicating role of anxiety in the treatment of major depression. Over half of all patients presenting for outpatient depression treatment report clinically significant levels of co-occurring anxiety (Fava et al., 2000, 2008; Kessler et al., 2003; Melartin et al., 2002; Zimmerman et al., 2002). As compared to patients with depression alone, anxious-depressed patients suffer from greater impairments in psychosocial and health related functioning (Brown et al., 1996; Roy-Byrne et al., 2000; Van Valkenburg et al., 1984), higher rates of depression relapse and recurrence (Albus et al., 1995; Roy-Byrne et al., 2000; Coryell et al., 2012; Forand et al., in press), and greater risk of suicide (Fava et al., 2004; Fawcett et al., 1990; Johnson et al., 1990; Roy-Byrne et al., 2000). Critically, these patients also demonstrate diminished rates of full treatment response/remission to both psychotherapeutic (Brown et al., 1996; Feske et al., 1998; Frank et al., 2000; Smits et al., 2012; but see also Fournier et al., 2009) and pharmacologic depression interventions (Brown et al., 1996; Fava et al., 2008). Thus, the weight of the extant evidence suggests that co-occurring anxiety adversely affects the typical efficacy of depression interventions.
Multiple mechanisms have been postulated to explain the negative impact of co-occurring anxiety on depression treatment outcomes. For example, one possibility is that patients with anxious depression are more likely to display medication fears and sensitivities that may impact their ability to tolerate and adhere to antidepressant medication regimens (Fava et al, 2008). Patients with anxious depression are also more likely to report chronic interpersonal difficulties and personality pathology (Melartin et al., 2002), which has been associated with poorer depression treatment outcome (Cyranowski et al., 2004; Levenson, Wallace, Fournier, Rucci, & Frank, 2012; Mulder, 2002). Finally, anxious-depressed patients may be more likely to engage in patterns of anxious rumination and avoidant coping that hinder active problem-solving skills and social engagement, undermine levels of mastery or self-efficacy across social roles, increase levels of perceived stress and, ultimately, increase one’s vulnerability to experience depression relapse in the face of subsequent life stress (Flint & Rifat, 2002).
Regardless of the precise mechanism, dynamic processes likely underlie the relationship between anxiety symptoms and depression outcome, such that it is not merely the levels of anxiety and depression that are predictive of the deleterious outcomes, but rather the strength of their association. Indeed, each of the mechanistic hypotheses offered above implies that behaviors that are direct results of anxiety (e.g., avoidance, medication non-adherence) will either cause or maintain increased levels of depression. Therefore, in addition to reducing the severity of depression and anxiety, effective interventions may also influence their co-occurrence or the strength of their association. Thus, a critical question of interest is whether symptoms of anxiety and depression are coupled over time, and whether this relationship varies over the course of treatment. Specifically, can enhanced treatments for anxious depression serve to disrupt (or decouple) the relationship between symptoms of anxiety and depression?
To evaluate these questions, we applied the TVEM technique to the initial assessment and 16 sessions of psychotherapy data of individuals diagnosed with major depressive disorder and significant co-occurring anxiety. We first investigated the potentially time-varying effect of anxiety on depression in a combined sample of participants who received either traditional IPT or an IPT variant that also targets panic and anxiety symptoms (IPT-PS, Cyranowski et al., 2005). We predicted that the intercept of depression would decrease over time, consistent with the improvement that can be expected from the treatment of depression with IPT. In addition, we predicted that anxiety and depression would be strongly linked at the outset of psychotherapy, as evidenced by a significant positive association, but that this association would diminish over the course of treatment. Second, we explored whether TVEM parameters would be moderated by treatment condition. Although these analyses remain exploratory due to treatment group sizes, we anticipated that those individuals assigned to traditional IPT for depression would show less of a decoupling of their anxiety and depression scores, as compared with those who received an adapted form of IPT developed to target both depression and co-occurring anxiety symptoms that may interfere with depression recovery (i.e., IPT-PS).
Method
Participants
Seventy-eight (Female n = 64, 82%; M age = 34.88, Range = 18.95 – 59.40) psychiatric outpatients were included in the current study, of which 7 (9%) were African-American. This group combines samples of anxious-depressed patients from three smaller treatment studies of that included variants of IPT, including an open treatment trial of IPT-PS (N=18; Cyranowski et al., 2005) and two small randomized control trials, one comparing IPT-PS and standard IPT (N=35) and the other comparing IPT-PS with Brief Supportive Psychotherapy (N=50, 25 of which were included in the current analyses). All participants met SCID-diagnosed DSM-IV criteria for a current, non-psychotic major depressive episode of sufficient severity (> 14 on the Hamilton Rating Scale for Depression; Hamilton, 1960). Individuals with a history of schizophrenia or bipolar disorder; a current diagnosis of anorexia, bulimia, or drug/alcohol abuse/dependence; or significant and unstable medical conditions were excluded from participation. In order to be eligible, depressed outpatients were also required to have elevated symptoms of panic or anxiety, as assessed via the Panic-Agoraphobic Spectrum Self-Report scale (PAS-SR; Cassano et al., 1997; Rucci et al., 2008). The 114-item PAS-SR assesses core panic symptoms as well as a wide array of anxiety-related features, such as agoraphobia, claustrophobia, separation anxiety, loss sensitivity, fears of losing control, drug sensitivity and phobias, and reassurance seeking. The PAS-SR displays excellent psychometric properties (Shear et al., 2001; Rucci et al., 2008), and elevated PAS-SR scores have been associated with poorer response to standard IPT for depression (Frank et al., 2000, 2011). Of the combined sample, all but four patients met criteria for at least one DSM-IV anxiety disorder diagnosis (M = 1.78, Range = 0–4), with the most common anxiety disorder diagnoses being GAD (75.6%), panic disorder (32.1%), social phobia (28.2%), and specific phobia (19.2%).
Procedure
The two psychotherapy conditions evaluated in the current analyses included standard IPT for depression (Klerman et al., 1984) and IPT-PS, an adaptation of IPT designed to target both depression and co-occurring symptoms of panic and anxiety (Cyranowski et al., 2005). In total there were 1116 sessions of psychotherapy included in the study for an average of 14.31 sessions per individual. The majority of participants (n = 66) were assigned to the IPT-PS treatment, whereas the remainders were assigned to standard IPT (n = 12). Furthermore, for most participants (n = 53), adjunctive antidepressant medication (SSRIs) was offered only to those individuals who did not achieve 50% reduction in their combined baseline depression and anxiety scores by session eight. Of the 53, eleven chose to add medication. For the remaining participants (n = 25) antidepressant medication was provided from the outset of the treatment. Thus, medication use was included as a covariate in study analyses.
IPT
IPT is a structured, time-limited, and empirically supported treatment approach for outpatients with major depressive disorder (Klerman et al., 1984; Cuipers et al., 2011). The conceptual framework of IPT rests on the core assumption that there exists a close connection between one’s psychosocial environment and mood. Thus, negative life events may trigger or exacerbate depressive episodes among vulnerable individuals. Conversely, depressive episodes compromise one’s social function, thereby generating or contributing to interpersonal difficulties or life event stress. Therefore, IPT treatment aims to help the patient to identify, address, and ultimately resolve the interpersonal or psychosocial issue(s) most closely associated with the index depressive episode (such as role dispute, role transition, or grief).
IPT-PS
IPT-PS was developed specifically for patients whose depression is complicated by panic and anxiety, and seeks to extend standard IPT for depression by identifying and addressing ways in which panic and anxiety symptoms interfere with interpersonal problem resolution or impair adaptive social function. IPT-PS retains both the structure and interpersonal problem areas of standard IPT, while incorporating modified cognitive, behavioral and emotion-focused strategies to identify and reduce panic and anxiety symptoms that interfere with interpersonal problem-solving tasks. For example, additional anxiety-focused goals of IPT-PS include helping patients to: accurately identify co-occurring anxiety symptoms and syndromes; reduce fears of physiologic arousal and patterns of somatic preoccupation; identify and distinguish between emotions; and reduce avoidance behaviors (Cyranowski et al., 2005).
Measures
In this study we examine the relationship between anxiety and depression, two phenomena that share a number of symptoms by definition (e.g., problems with concentration, sleep disturbances). To avoid overlap in symptomatology in our primary measures, we selected items on the Hamilton rating scales for depression and anxiety that are unique to each construct.
Hamilton Rating Scale for Depression – Core Symptoms (HRSD-CS; Hamilton, 1960)
We selected a subset of items from the well-known, clinician-administered, Hamilton Rating Scale for Depression to represent the core mood and anhedonic symptoms of depression. The items retained included: Item 1, depressed mood; Item 2, guilt feelings; Item 3, suicidal thoughts and behavior; Item 7, interest; Item 8, retardation; and Item 13, anergia. These items reflect a coherent factor from prior meta-analytic factor analyses (Shafer, 2006). The range of possible scores on this subset of items was 0 to 22. The HRSD-CS was administered at each session. The average internal consistency across all sessions was acceptable (M α = .71, Mdn = .77, Range = .32–.81), and scores at the first assessment ranged from 5 to 15 (M = 10.9, SD = 1.95).
Hamilton Rating Scale for Anxiety – Core Symptoms (HRSA-CS; Hamilton, 1959)
Similar to depression scores, we selected a subset of items to reflect the core symptoms of anxiety and hyperarousal from the Hamilton Rating Scale for Anxiety. The items retained included: Item 1, anxious mood; Item 2, tension; Item 3, fears; Item 7, somatic (muscular); Item 8, somatic (sensory); Item 9, cardiovascular symptoms; Item 10, respiratory symptoms; Item 11, gastro-intestinal symptoms; Item 12, genito-urinary symptoms; and Item 13, autonomic symptoms. The possible range of scores on this subset of items was 0 to 36. The average internal consistency across sessions was acceptable (M α = .76, Mdn = .76, Range = .68–.86), and scores at first assessment ranged from 4–27 (M = 13.14, SD = 4.62).
Results
Combined Sample TVEM
In order to elucidate the temporal relationship between depression (DEP) and anxiety (ANX) over the course of interpersonal psychotherapy, we fit the following TVEM, which also included sex (SEX) and medication use (MEDS) as covariates:
| (2) |
In this equation, time (tij) is coded by psychotherapy session, such that each session equals 1 unit of time, β0(tij) is the intercept function which captures the expected depressive symptom (HRSD-CS) trajectory over the course of 16 sessions of psychotherapy for an individual who is a female (i.e., SEX = 0), is not taking medication (i.e., MEDS = 0), and possesses an average level of anxiety (HRSA-CS scores were centered on the per-session mean). The potentially time varying effects of gender and medication use are represented by the slope coefficients, β1(tij) and β2(tij), respectively. Sex was included as a covariate to control for potentially significant differences between men and women over the course of depression treatment. Medication was included as a covariate to account for the fact that (a) a portion of participants started with a prescription, and (b) it marked those individuals who charted a more severe course by session eight. Finally, the evolving association between anxiety and depression was reflected in the slope coefficient β3(tij).
To demonstrate the process of manually fitting an optimal TVEM, we estimated this initial combined-sample model using the basis spline approach (i.e., B-spline) as opposed to the penalized truncated power spline basis (P-spline), which are provided as options in the SAS TVEM Macro (Tan et al., 2012; Yang et al., 2012). The B-spline approach requires the researcher to iteratively estimate and then compare models that differ in the number of intervals into which the data are divided (i.e., that differ in the number of knots selected) using the Akaike Information Criterion (AIC) and Bayesian Information Criterion (BIC). The central idea is that one should choose the simplest model that has the fewest number of knots and the lowest-order polynomial terms (e.g., quadratic rather than cubic) that adequately captures the primary shape of the data over time. Decisions about how many knots are needed to capture the shape of change over time can be guided by model selection criteria such as AIC and BIC, where one typically selects the model with the lowest value for these criteria. More specifically, the absolute fit of the model to the data (i.e., the model likelihood) will necessarily improve as one increases the complexity by adding additional knots (allowing for more nonlinear and temporally local variation), yet small fit improvements may represent only trivial nonlinear changes in the shape. The AIC and BIC weigh the absolute model fit versus the number of knots (i.e., complexity) to find an optimal complexity-fit tradeoff.
Relative to the B-spline approach, a P-spline TVEM with a sufficient number of knots (e.g., 10) will be able to “automatically output the optimal model with optimally shrunk coefficients for the truncated power functions” (Yang et al., 2011; p. 48). In essence, the P-spline TVEM approach typically fits a model with many knots, but automatically penalizes knots (i.e., shifting their effect toward zero) that do not capture much variability using random-effects linked to the knots (for more detail, see Tan et al., 2012). This results in a smoothing of the parameter functions with the P-spline estimation approach, which can result in differences of appearance in the results across methods. Although the P-spline approach is often more direct, in certain instances it can be computationally unstable necessitating the use of the B-spline. In some applications, a manual comparison of the shape of the coefficient may be indicated by theory (e.g., specifically testing linear vs. quadratic time-varying coefficients). Accordingly, here we present the initial example using the B-Spline approach to provide a template of decision points in the TVEM fitting process for investigators new to the technique.
Initially, we fit a model with five equally spaced knots for each parameter function, including the intercept and three slopes. We then successively fit models by decreasing the complexity by 1 knot, starting with the intercept and then continuing though the slopes for gender, medication, and finally anxiety (HRSA-CS). Table 1 summarizes the model fitting steps. In terms of the intercept, decreasing complexity of the function improved model fit up until a quadratic effect, at which point both the AIC and BIC reached their minimum value. By default the TVEM uses a cubic spline basis, such that changes in the shape of the function within each segment are estimated with a cubic polynomial term. Therefore a model with zero knots (i.e., the function is not split into intervals and is estimated as a whole) reduces to a cubic model, but simpler functions can also be estimated (i.e., quadratic and linear effects). The best fitting coefficient for gender had a constant effect, indicating that it was best captured by a single parameter that did not vary across time. The fit criteria for medications diverged, with the AIC preferring a quadratic effect, and the BIC preferring a linear effect. We selected the quadratic effect based on the fact that the AIC differences between the two models favored the quadratic trend, whereas the .61 difference between the BICs of each model were negligible (Raftery, 1995). Finally, the best fitting model for anxiety suggested a quadratic effect. Thus, for none of the chosen models were true B-splines necessitated, although for the intercept, medications, and anxiety scores all exhibited time varying coefficients.
Table 1.
Full sample time-varying effect model selection, predicting depression from gender, medications, and anxiety.
| Number of Knots/Shape of Effect | B-Spline
|
|
|---|---|---|
| AIC | BIC | |
| Varying Intercept | ||
| 6, 5, 5, 5 | 2125.78 | 2311.43 |
| 5, 5, 5, 5 | 2124.38 | 2305.01 |
| 4, 5, 5 ,5 | 2122.38 | 2297.99 |
| 3, 5, 5, 5 | 2121.44 | 2292.03 |
| 2, 5, 5, 5 | 2119.16 | 2284.74 |
| 1, 5, 5, 5 | 2121.06 | 2281.62 |
| cubic, 5, 5, 5 | 2119.33 | 2274.87 |
| quadratic, 5, 5, 5 | 2117.97 | 2268.50 |
| linear, 5, 5, 5 | 2130.81 | 2276.32 |
| constant, 5, 5, 5 | 2481.23 | 2621.72 |
| Varying Coefficient for Gender | ||
| quadratic, 4, 5, 5 | 2116.27 | 2261.78 |
| quadratic, 3, 5, 5 | 2114.38 | 2254.88 |
| quadratic, 2, 5, 5 | 2112.40 | 2247.87 |
| quadratic, 1, 5, 5 | 2110.46 | 2240.91 |
| quadratic, cubic, 5, 5 | 2108.67 | 2234.10 |
| quadratic, quadratic, 5, 5 | 2108.53 | 2228.95 |
| quadratic, linear, 5, 5 | 2106.53 | 2221.93 |
| quadratic, constant, 5, 5 | 2105.19 | 2215.58 |
| Varying Coefficient for Medications | ||
| quadratic, constant, 4, 5 | 2102.32 | 2207.69 |
| quadratic, constant, 3, 5 | 2104.36 | 2204.71 |
| quadratic, constant, 2, 5 | 2102.35 | 2197.69 |
| quadratic, constant, 1, 5 | 2102.58 | 2192.89 |
| quadratic, constant, cubic, 5 | 2109.16 | 2194.46 |
| quadratic, constant, quadratic, 5 | 2108.04 | 2188.32 |
| quadratic, constant, linear, 5 | 2112.45 | 2187.71 |
| quadratic, constant, constant, 5 | 2120.72 | 2190.97 |
| Varying Coefficient for Anxiety | ||
| quadratic, constant, quadratic, 4 | 2108.20 | 2183.46 |
| quadratic, constant, quadratic, 3 | 2105.28 | 2175.53 |
| quadratic, constant, quadratic, 2 | 2105.18 | 2170.41 |
| quadratic, constant, quadratic, 1 | 2104.75 | 2164.96 |
| quadratic, constant, quadratic, cubic | 2102.77 | 2157.96 |
| quadratic, constant, quadratic, quadratic | 2102.00 | 2152.18 |
| quadratic, constant, quadratic, linear | 2124.00 | 2169.16 |
| quadratic, constant, quadratic, constant | 2133.04 | 2173.18 |
Note. Best fitting model fit indices for each coefficient in bold. Final model fit indices are in bold italics. Model estimated with cubic knots using spline basis.
Figure 2 provides the TVEM-based predictions of the effects and 95% confidence intervals (CIs) for the time-varying intercepts, and coefficients for anxiety, medication, and gender. The 95% CIs provide the researcher with model parameter precision estimates necessary for making statistical inferences (but see Cumming & Finch, 2005 for a detailed discussion on interpreting overlapping CIs by eye). Additionally, researchers should interpret with caution values near the boundaries of the temporal sequence (i.e., at the start and finish of the study) due to edge effects (e.g., sharp deviations and flared CIs) that frequently emerge in non-parametric regression estimation (cf. Härdle, 1990). As can be seen in the upper left panel, the intercept, or average depression score, demonstrates a gradual quadratic decline over the course of the study, starting with a value of 10, and ending with a value just below 4. Going around the figure counter-clockwise, the next panel (lower left) demonstrates the time-varying effect for medication. Early in the study the effect for medication is negative, although the confidence intervals are large. However, by session 8 medication use is a significant positive predictor, such that those taking medication have higher depression (HRSD-CS) scores. This was expected given the study design feature that allowed those participants who continued to exhibit high levels of depression to opt for medication at session 8. This is also why medication is an important covariate. Next we present the effect for gender. The effect is constant (i.e., time-invariant) and non-significant, and therefore is presented by a straight line across time, with 95% CIs that include 0.0. We note that although we did not have strong hypotheses with regard to gender and there were relatively few men in the sample, gender was included primarily to demonstrate the resulting graph and interpretation of a time-invariant effect. This illustrates the important point that in TVEM, time-invariant variables such as gender could have time-varying effects (e.g., women may have a more rapid improvement in early treatment than men), and conversely, that time-varying variables may have time-invariant effects (i.e., their effect is stable over time). In this way, TVEM can accommodate all of the effects captured in traditional MLM, while also opening new possibilities for describing time-varying associations.
The coefficient of central interest, the time-varying effect of anxiety on depression scores, is displayed in the upper right panel. At the start of the study, anxiety is not predictive of depression scores, but as the study progresses the association increases, peaking between sessions 9 and 10 where 1 unit increase in the HRSA-CS (core anxiety) predicts an increase of approximately .35 (SE = .02) units in HRSD-CS (core depression); this effect gradually decreases again in the second half of treatment to a value of approximately .25 (SE = .05). Finally, to provide a complete picture of change, we also calculated a separate basic TVEM with anxiety as the outcome in order to estimate the time-varying anxiety intercept. The plot can be found in the left panel of Figure 5, where it can be seen that a gradual quadratic trend of decline characterized change in anxiety in the full sample.
Figure 5.
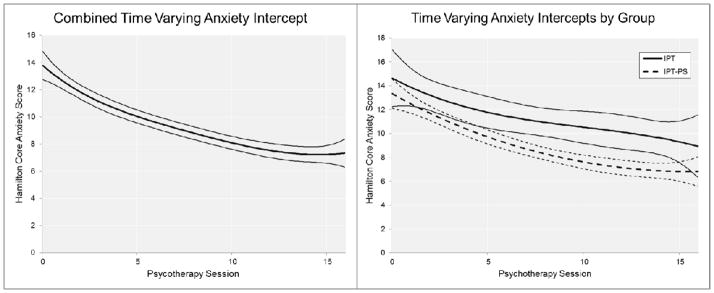
A graphical summary of the time varying anxiety intercept functions and 95% confidence intervals in the combined (left panel) and treatment group (right panel) samples.
An alternative graphical depiction of the time-varying effect of anxiety on depression is provided in Figure 3 (see left panel for combined sample). This figure plots the model-predicted mean depression score over time in gray relative to the predicted depression score for someone with average levels of anxiety across the study in black. To calculate this we subtracted the time-specific depression intercept when anxiety was not mean centered from the depression intercept when anxiety was centered on the average value of anxiety scores. This serves to decompose the mean depression score into the portion associated with anxiety and explained by other factors. Remarkably, by the seventh session, over half of the average patient’s depression score would be predicted from his/her anxiety score, and this proportion increased before finally stabilizing around session 10 (vertical drop-lines in Figure 3 mark these sessions).
Figure 3.
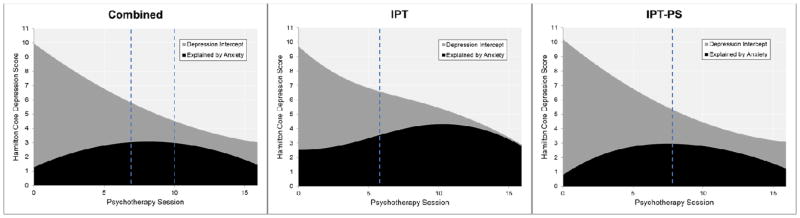
Decomposition of average depression trajectory into proportion explained (black) and not explained (grey) by core anxiety symptoms in the combined (leftmost panel; N=78), standard interpersonal psychotherapy (IPT; middle panel; n=12), and IPT augmented to address anxiety symptoms (IPT-PS; n=66). Vertical dotted lines in combined group reflect over half of average depression score accounted for by anxiety (left line; session 7) and maximum proportion of depression accounted for by anxiety (right line; session 10), vertical dotted lines in IPT and IPT-PS group reflect point at which anxiety accounts for more than half of average depression score.
TVEM for IPT vs. IPT-PS
We subsequently separated the sample in to those who received IPT (n=12) and those who received IPT-PS (n=66) and fit the same model as above, now using the P-spline approach, although without including gender due to its consistent lack of effect. Prior to running the TVEM in each group, we compared groups on gender, age, and initial session HRSD-CS and HRSA-CS scores and found no significant differences between groups (all p values > .20). Given the small sample size in the IPT condition, these analyses remain exploratory or hypothesis-generating in nature. By fitting the same model in each sample, this allowed psychotherapy condition to act as a moderator of all aspects of the study, and provides a comparison of the effect of the treatment condition not only on the intercept, but also on the association between anxiety and depression over the course of the study. Although we included medication use in the model as a covariate, we present only the results to the primary coefficients of interest, the time-varying intercepts of depression and anxiety effects (see Figures 3 and 4).
Figure 4.
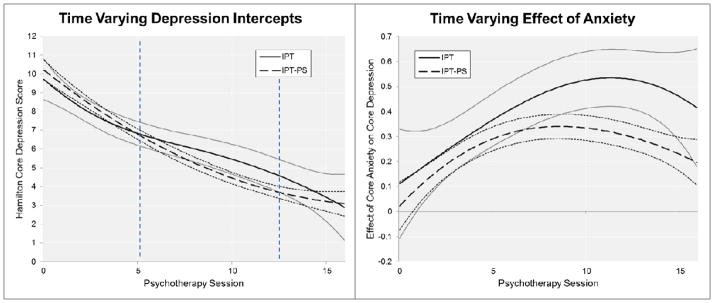
A graphical summary of the time varying intercept (left panel) and anxiety slope (right panel) functions and 95% confidence intervals by psychotherapy condition. Vertical dotted lines in left panel reflect points of inflection in IPT intercept functions.
In the left panel of Figure 4 both time-varying intercepts are superimposed on the same plot to facilitate comparison. It is notable that the two intercepts are virtually identical at the start of the study, and track together through session 5, at which point the paths begin to diverge slightly. The IPT-PS condition continues to decline on the same quadratic slope as before, whereas the IPT condition diverges and exhibits a shallower decline. Ultimately, for much of the 16 sessions of psychotherapy the 95% CIs are overlapping to a large degree, suggesting no major differences in overall treatment efficacy for depression. However, where the treatments do differ is the anxiety intercepts (see Figure 5, right panel), with the IPT-PS condition demonstrating more rapid declines in core anxiety symptomatology.
Turning now to the resulting anxiety coefficients in the right panel of Figure 4, at the start of the study the effect of anxiety on depression does not differ across psychotherapy conditions, and they remain largely overlapping through session 8 at which point they begin to diverge as the IPT-PS coefficient begins to flatten out and gradually decline, whereas the IPT effect continues to rise. The IPT condition drops somewhat towards the end of the study, and although at the last time point the overlapping CIs might suggest a value that does not differ across conditions, this may reflect the imprecision of estimates in spline-based models near the edge of a time series, as mentioned above. The plots in Figure 3 provide further insight in to the time-varying association between anxiety and depression across conditions—the amount of the depression intercept predicted by average core anxiety differs appreciably across conditions. To be sure, in the IPT condition, by session 6, average core anxiety predicts over half of the core depression intercept, and increases in the proportion of the explained depression up until the end of the study at which point average anxiety can account for the full average depression score. In contrast, in the IPT-PS condition, although average core anxiety can explain the majority of the core depression intercept by session 8, the proportion of depression scores accounted for by anxiety declines modestly throughout the second half of treatment. Again, these group comparisons are necessarily tentative given the small size of the IPT group.
A Comparison with MLM
We now briefly summarize an MLM approach to studying the change of depression symptoms and their association with anxiety symptoms in this data set.1 To test the shape of change in depression scores over the course of the study, we estimated a series of unconditional multi-level growth models in Mplus 7, starting with a means only model (deviance = −2858.16), followed by time (in sessions) as a linear (deviance = −2575.68), quadratic (deviance = −2548.69), and cubic (deviance = −2686.55) predictor. In agreement with the TVEM, the MLM suggests a quadratic pattern of decline in depression scores in the study. Next we entered time-varying covariates, finding that anxiety was a significant contemporaneous predictor of depression scores (B = .23, SE = .03, p < .001), whereas medication was not (B = .04; SE = .28, p = .89). Random effects were significant for anxiety, but not medication. Note that the MLM assumes a static relationship between predictor and outcome, summarizing with one value the relationship across the entire series of sessions. Thus, the conventional MLM approach identified a significant positive contemporaneous association between anxiety and depression, but this effect was assumed to be of a similar magnitude regardless of how many sessions of psychotherapy had been completed. This highlights the crucial difference between MLM and TVEM, insofar as our TVEM results above indicate a highly dynamic association between depression and anxiety over time. Finally, we entered gender and treatment group as between-person predictors of initial value in depression, rate of change in depression, and effect of anxiety. In no case did we find differences across treatment groups or gender.
Discussion
The primary aim of our study was to demonstrate how TVEM can be applied to psychotherapy data to elucidate dynamic processes that (a) evolve over time in the course of treatment, and (b) are reflected in the change in association among variables across time. To illustrate the TVEM, we examined the effects of clinically significant anxiety on the treatment of depression in a sample of patients treated with variants of IPT for depression. In so doing, we found a number of surprising and potentially clinically important findings regarding treatment efficacy and the coupling of depression and anxiety across the course of short-term treatment. First, consistent with our expectations, we found that the severity of depression decreased over time in a quadratic fashion, with the steepest declines at the outset of the study, followed by more gradual declines later in therapy. Second, as predicted, the association between anxiety and depression varied considerably across sessions suggesting an underlying mechanism driving the shift in association. However, in contrast to the hypothesized pattern of associations over time, the ability for core anxiety scores to account for core depression scores at the outset of the study was negligible, but then sharply increased before demonstrating a modest decline.
In an effort to further demonstrate the application of the TVEM, we compared two treatment conditions, standard IPT and IPT-PS, the latter having an additional focus on anxiety symptoms (Cyranowski et al., 2005). We emphasize that results of these analyses are exploratory—a sample size of twelve in the IPT condition falls below reasonable cutoffs necessary for the estimation of reliable parameter estimates. As such, these findings serve more for hypothesis generation as opposed to providing definitive results. First, we failed to find a clear difference between treatments in the average trajectory of depression scores (see Figure 4, left panel), which might be explained by the fact that basic IPT is generally efficacious for treating depression. In contrast, our results suggested that IPT-PS differentially influenced the average trajectory of anxiety symptoms and the strength of the association between core anxiety and core depressive symptoms over the course of treatment. Thus, for patients who received standard IPT, the link between anxiety and depression continued to increase over the course of treatment, until – by the end of 16 sessions – average core anxiety scores could largely account for an individual’s average core depression scores. In contrast, patients who received IPT-PS displayed a modest reduction in the association between core anxiety and depressive symptoms during the final phase of treatment, such that by session 16 average anxiety scores accounted for only half of the average depressive symptoms (see Figure 3).
While preliminary, these data point to the potential ramifications of failing to address co-occurring anxiety among anxious-depressed outpatients. By the end of treatment, the average patient who received standard IPT displayed a symptom profile in which core symptoms of anxiety and depression were largely overlapping. If the sample size in the IPT group were larger, the strong association observed between symptoms of anxiety and depression in this group at the end of treatment might suggest that this group is at an elevated risk for future depression. For example, this group may be particularly vulnerable to experience depression recurrence in the face of future life stressors (which trigger stress and anxiety responses) and following termination of individual treatment (and the loss of a potent source of reassurance and support). Indeed, Coryell et al (2012) recently observed that while depressive symptom severity during an index mood episode modestly predicted future depression, the severity of co-occurring anxiety symptoms more potently predicted the amount of time subjects spent in depressive episodes over the subsequent 25 years.
Explanatory Processes
The fact that time-varying effects for anxiety emerged in the current analyses suggests that dynamic processes are involved. In the introduction, we suggested a number of mechanisms for how anxiety might interfere with depression treatment and maintain depressive symptomatology. Unfortunately, in our sample, none of the specific behaviors that would directly address those mechanisms were sampled with sufficient frequency to be included in the current TVEM models. Thus, future research designs that include repeated sampling of potential mechanisms will be needed to determine precisely how treatments such as IPT-PS might function to decouple the association between core anxiety and depressive symptoms.
We note that the pattern of associations that emerged over the first six sessions, i.e., that core anxiety and depressive symptoms were largely unrelated at treatment initiation but increased in association over the early sessions, was unexpected. A number of factors may have influenced this finding. For example, the increasing association between anxiety and depression observed in the early stage of treatment occurred in the context of rapidly declining depression scores. At study entry, all participants were required to show elevations on both depressive and anxiety symptoms to meet study inclusion criteria. Methodologically, such inclusion criteria may have led to a restriction in the potential range of core depressive and anxiety symptoms present at treatment initiation, thereby reducing the strength of observed associations. Indeed, by session four the variance in HRSD-CS scores is approximately 2.3 times that at intake (9.42 vs. 4.16 respectively), reflecting variability associated with differing rates of decline in symptoms.
Alternatively, patients tend to seek treatment when levels of general distress peak, and much of the elevated symptom levels among anxious-depressed patients at treatment initiation may represent acute yet random elevations in general distress that respond rapidly to non-specific or common factors inherent in most depression treatments -- such as the provision of reassurance, empathy, or warmth by treatment providers. Notably, steep trajectories in depression symptom change observed among anxious-depressed patients treated with CBT had been interpreted by some researchers as evidence that anxious-depressed patients respond better to CBT for depression, relative to non-anxious controls (e.g., see Forand et al., 2011). In a recent re-analyses, however, Forand and DeRubeis (in press) show that while co-occurring anxiety symptoms are associated with a more rapid change in depressive symptoms in the early course of both CBT and medication treatment, anxious-depressed patients do not display a greater overall change and are at greater risk for depression relapse following CBT.
Taken together, these findings suggest that meaningful pathological processes driving the lifetime risk profiles observed among anxious-depressed patients may only emerge following early, non-specific reductions in peak levels of distress or depression. Thus, the current data suggest that as time in therapy progresses, anxiety can increasingly differentiate between those who have declined more rapidly and those who remain elevated in symptomatology. Furthermore, these initial results suggest that IPT-PS is, in fact, successful at addressing this maladaptive association to some degree, as anxiety and depression remain differentiated throughout the course of therapy. Also worth mentioning is the fact that in the current study we focused on depression as an outcome and anxiety symptoms as the complicating factors. In fact, it is likely that for individuals with significant depressive and anxiety symptomatology, complex bidirectional influences are at play, such that the selection of predictor vs. outcome is to some degree arbitrary. At the same time, we limited our focus to depression because a major depressive episode was the primary inclusion criterion, whereas anxiety symptoms were more variable, and IPT is first and foremost a treatment that targets depression. Nevertheless, the link between the two remains a difficult treatment target that deserves further attention. In this regard, the TVEM approach offers unique insight regarding not only the processes of psychotherapy, but also basic psychopathology.
Clinical Implications
As reviewed in the introduction, depressed patients who report high levels of co-occurring anxiety display a poorer treatment response among other deleterious outcomes (Coryell et al., 2012; Fava et al., 2008; Feske et al., 1998; Papakostas et al., 2008). Based on this considerable empirical base, practitioners should continue to assess and monitor or track anxiety among individuals presenting for depression with clinician administered or self-report measures of anxiety. Moreover, the current results highlight the potential importance of evaluating residual anxiety symptoms following early reductions in symptoms of depression and distress. Based on our findings, starting around session five and moving forward, an individual’s level of anxiety can explain a considerable and increasing proportion of his/her depressive symptomatology. At this point in treatment, it may be especially important for clinicians to assess carefully a patient’s anxiety level, and if elevated, consider implementing efforts to address these symptoms directly. Specifically, we recommend doing a functional analysis of how specific anxiety symptoms may be contributing to depression or interfering with active intervention strategies, and attempt to disrupt this process. The decreased rate of decline in symptoms in later sessions (i.e., the flattening of the intercept), along with a consistently strong association between anxiety and depression highlights the increased importance of tracking and treating anxiety in later sessions.
Recommendations and Future Directions for TVEM in Psychotherapy Research
The TVEM offers a number of compelling advantages for psychotherapy researchers interested in studying the processes of psychotherapy and psychopathology. Namely, it provides an intuitive method for elucidating dynamic processes. We additionally note that due to the relatively modest requirements for sample size, many existing psychotherapy studies may be amenable to further investigation using the TVEM, assuming they have a sufficient number of times of measurement. For those existing studies that included a large number of process measures at every session, the TVEM could be applied to profitably investigate their significance across time. For example, when in the treatment stream is alliance most important for predicting symptoms, or treatment satisfaction, or homework compliance?
For those applied researchers interested in using the TVEM, we recommend that future treatment studies be designed to include a greater frequency of measurement occasion, and that session-by-session assessments be augmented with daily diary or other intensive repeated measures in naturalistic settings (Moskowitz et al., 2009). This will allow for greater fidelity in uncovering key processes by which therapy takes its effect. For example, it is common in psychotherapies from the cognitive-behavioral tradition to ask patients to fill out detailed mood and behavior logs between psychotherapy sessions. These types of records would be rich data sources to draw upon in future TVEM studies in order to investigate the processes involved in psychopathology and psychotherapy at a much more finely grained level of analysis. Furthermore, when all events of measurement are tied to individual psychotherapy sessions, it becomes difficult to disentangle the dose effect of treatment from naturalistic change processes. In many respects what we have estimated here is a “dose-varying effect model” due to the coding of time by psychotherapy session. Different processes may occur on different time scales and it is important to match the periodicity of assessment to that of the putative process (Collins, 2006). Recall that even a static variable (e.g., gender) may have time-varying effects, but if a process is anticipated to occur on a given temporal scale it should ideally be assessed on that schedule. The TVEM can flexibly accommodate these within the same framework.
Additionally, we recommend that researchers be thoughtful in their application of this method, and ideally should pursue theoretically driven questions. We have demonstrated that the TVEM is a very sensitive analytic technique that can pick up on methodological aspects of the study. Specifically, consider its ability to capture the manner in which medication was prescribed, picking up increases in scores for those individuals starting medication midway through therapy because they remained symptomatic. Finally, we recommend that data be analyzed using multiple analytic approaches. In the introduction we contrasted TVEM with growth models and standard MLM, and for pedagogical purposes we outlined their limitations. Nevertheless, these methods may reveal potentially complementary aspects of the data.
Limitations
As is the case in any study, there are a number of limitations that bear mentioning. Chief among these limitations is the small size of the IPT group, which, due to low statistical power, limited our ability to perform more than an initial exploration of treatment differences. Clearly, these treatment-specific results should be considered promising but tentative pilot findings that remain to be confirmed in a larger trial design. A similar limitation is reflected in the relatively few male participants in this study, resulting in what was likely an underpowered test of gender effects. Second, due to the inconsistent manner in which medication was assigned across participants, little in the way of systematic conclusions can be drawn about its effects. Moreover, medication assignment based on symptom severity for some participants may have introduced subtle effects related to causal mechanisms that cannot be disentangled here.
Third, the weekly assessment of individuals’ depression and anxiety scores ended at the end of treatment, and therefore we are not able to ascertain the progression of the association between anxiety and depression after treatment. Future studies interested in dynamic effects would benefit from including more frequent assessments as part of the post-treatment follow-up phase. Fourth, it is a limitation that our time was coded in psychotherapy session as opposed to separately. As a result, this in some respects is a “dose-varying effect model” as we suggest above. Nevertheless, sessions were for the most part weekly in occurrence. Ideally, in future studies the assessment of anxiety and depression would occur on a separate schedule from the treatment, which would allow the effects of time and treatment to be better disentangled. Finally, this study would have benefitted from a larger set of repeatedly assessed mechanistic variables to allow for additional investigations into the dynamic associations over time. However, a number of these limitations serve an instructive function in how best to design studies of dynamic processes in psychotherapy, given that this study was intended to be an applied demonstration of a novel analytic technique. Applied researchers routinely have to contend with a number of limitations when working with real world data, and in this study we provided an example of how some of these can be addressed. Furthermore, this approach simultaneously provides guidance for how the TVEM may be employed in existing data sets and highlights the features of new studies that would allow for posing richer and more nuanced questions regarding dynamic psychotherapy mechanisms.
We should also note that the TVEM approach is not ideally suited for all longitudinal applications, and as with any new analytic techniques, additional methodological developments will strengthen its utility. As described above, the TVEM assumes that change over time will take on a relatively smooth shape, and the use of spline models to identify the shape of the change in the data can be viewed as a form of smoothing that necessarily ignores some information (Tan et al., 2012). For example, if one were interested in understanding rapid vacillations in mood or behavior between adjacent measurements (e.g., affective instability in borderline personality disorder; for example, see Trull et al., 2008), the TVEM may not be an optimal model because it is likely to blur over these effects. Similarly, the TVEM as currently instantiated assumes uniform rates of change across individuals, such that the only way to model interindividual differences in the rates of change is through covariates (e.g., group membership). Instead, growth curve models from the SEM and MLM traditions will be preferable approaches when the research goal involves testing and including individually estimated trajectories as outcomes and predictors. Additionally, tests of mediation, which are often relevant in treatment research (MacKinnon & Fairchild, 2009), have not been fully developed for the TVEM, which may limit its applicability in some studies.
Conclusion
In general, psychotherapy unfolds gradually, over weeks and months, and sometimes years. During this time, there are a number of processes that account for change when it occurs, and, conversely, there are processes that prevent change from happening. For researchers interested in targeting processes and mechanisms of change, the TVEM provides a potentially powerful statistical tool. Methods should match the empirical questions at hand. The targets of psychotherapy are often not limited to reduction or increase in some psychological variable, but disrupting or augmenting the relationship between two variables. In the introduction we outlined how a number of popular contemporary analytic approaches (e.g., LGCM, GMM, MLM) struggle to capture associations that vary in their strength over time. We also outlined the TVEM, and demonstrated its utility by elucidating a dynamic pattern of association between anxiety and depression across the course of IPT. We do not provide the final word on why this is occurring, but we do provide initial evidence that is suggestive of an interaction between processes and time, which serves to generate more hypotheses for future work. Furthermore, we provided a direct clinical recommendation of when anxiety is most important to attend to when a depressed patient presents with significant anxiety. Future studies may be able to apply the TVEM fruitfully to uncover additional processes in other therapies and pathologies.
Acknowledgments
We are grateful to the Penn State Methodology Center for making freely available the software, technical support, and exemplar literature for employing the statistical techniques and models we present here. We relied heavily on their generosity in the preparation of this work.
Support for this research was provided by the National Institute of Mental Health (T32MH018269, Wright; F32MH090629, Hallquist; R21MH061948, Frank; R01MH085874, Cyranowski). The opinions expressed herein are solely those of the authors and do not represent those of the funding source.
Footnotes
We also made efforts to estimate LGCMs, both univariate and multivariate, in an SEM framework. However, all models were poorly fitting and/or evidenced difficulty with estimation (e.g., negative variances). This is not surprising given the 17 time-points in this study, which the LGCM approach struggles to accommodate (Preacher et al., 2008). Thus, we limit our comparison of the TVEM to MLMs.
References
- Albus M, Scheibe G, Scherer J. Panic disorder with or without concomitant depression 5 years after treatment: a prospective follow-up. Journal of affective disorders. 1995;34(2):109–115. doi: 10.1016/0165-0327(95)00007-a. [DOI] [PubMed] [Google Scholar]
- Beevers CG, Miller IW. Unlinking negative cognition and symptoms of depression: evidence of a specific treatment effect for cognitive therapy. Journal of consulting and clinical psychology. 2005;73(1):68–77. doi: 10.1037/0022-006X.73.1.68. [DOI] [PubMed] [Google Scholar]
- Bollen KA, Curran PJ. Latent curve models: A structural equation perspective. New York: Wiley; 2006. [Google Scholar]
- Brown C, Schulberg HC, Madonia MJ, Shear MK. Treatment outcomes for primary care patients with major depression and lifetime anxiety disorders. The American journal of psychiatry. 1996;153:1293–1300. doi: 10.1176/ajp.153.10.1293. [DOI] [PubMed] [Google Scholar]
- Collins LM. Analysis of longitudinal data: The integration of theoretical model, temporal design, and statistical model. Annual Review of Psychology. 2006;57:505–528. doi: 10.1146/annurev.psych.57.102904.190146. [DOI] [PubMed] [Google Scholar]
- Cassano GB, Michelini S, Shear MK, Coli E, Maser JD, Frank E. The panic-agoraphobic spectrum: a descriptive approach to the assessment and treatment of subtle symptoms. American Journal of Psychiatry. 1997;154:27–38. doi: 10.1176/ajp.154.6.27. [DOI] [PubMed] [Google Scholar]
- Coryell W, Fiedorowicz JG, Solomon D, Leon AC, Rice JP, Keller MB. Effects of anxiety on the long-term course of depressive disorders. The British Journal of Psychiatry. 2012;200(3):210–215. doi: 10.1192/bjp.bp.110.081992. [DOI] [PMC free article] [PubMed] [Google Scholar]
- Craske MG, Barlow DH. Mastery of your anxiety and panic: Workbook for Primary Care Settings. New York: Oxford University Press; 2007. [Google Scholar]
- Cuijpers P, Geraedts AS, van Oppen P, Andersson G, Markowitz JC, van Straten A. Interpersonal psychotherapy for depression: a meta-analysis. The American journal of psychiatry. 2011;168(6):581. doi: 10.1176/appi.ajp.2010.10101411. [DOI] [PMC free article] [PubMed] [Google Scholar]
- Cumming G, Finch S. Inference by eye: Confidence intervals and how to read pictures of data. American Psychologist. 2005;60:170–180. doi: 10.1037/0003-066X.60.2.170. [DOI] [PubMed] [Google Scholar]
- Cyranowski JM, Frank E, Shear MK, Swartz H, Fagiolini A, Scott J, Kupfer DJ. Interpersonal psychotherapy for depression with panic spectrum symptoms: a pilot study. Depression and anxiety. 2005;21(3):140–142. doi: 10.1002/da.20069. [DOI] [PubMed] [Google Scholar]
- Cyranowski JM, Frank E, Winter E, Rucci P, Novick D, Pilkonis P, Kupfer DJ. Personality pathology and outcome in recurrently depressed women over 2 years of maintenance interpersonal psychotherapy. Psychological medicine. 2004;34(4):659–670. doi: 10.1017/S0033291703001661. [DOI] [PubMed] [Google Scholar]
- De Boor C. A Practical guide to splines. Applied Mathematical Sciences. 2001;27 (rev. Ed) POD. [Google Scholar]
- Fava M, Rankin MA, Wright EC, Alpert JE, Nierenberg AA, Pava J, Rosenbaum JF. Anxiety disorders in major depression. Comprehensive Psychiatry. 2000;41:97–102. doi: 10.1016/s0010-440x(00)90140-8. [DOI] [PubMed] [Google Scholar]
- Fava GA, Ruini C, Rafanelli C, Finos L, Conti S, Grandi S. Six-year outcome of cognitive behavior therapy for prevention of recurrent depression. American Journal of Psychiatry. 2004;161(10):1872–1876. doi: 10.1176/ajp.161.10.1872. [DOI] [PubMed] [Google Scholar]
- Fava M, Rush A, Alpert J, Balasubramani G, Wisniewski S, Carmin C, Trivedi M. Difference in treatment outcome in outpatients with anxious versus nonanxious depression: a STAR* D report. American Journal of Psychiatry. 2008;165(3):342–351. doi: 10.1176/appi.ajp.2007.06111868. [DOI] [PubMed] [Google Scholar]
- Fawcett J, Scheftner WA, Fogg L, Clark DC. Time-related predictors of suicide in major affective disorder. American Journal of Psychiatry. 1990;147:1189–1194. doi: 10.1176/ajp.147.9.1189. [DOI] [PubMed] [Google Scholar]
- Feske U, Frank E, Kupfer DJ, Shear MK, Weaver E. Anxiety as a predictor of response to interpersonal psychotherapy for recurrent major depression: an exploratory investigation. Depression and anxiety. 1998;8(4):135–141. [PubMed] [Google Scholar]
- Flint AJ, Rifat SL. Relationship between clinical variables and symptomatic anxiety in late-life depression. American Journal of Geriatric Psych. 2002;10(3):292–296. [PubMed] [Google Scholar]
- Forand NR, DeRubeis RJ. Pre-treatment anxiety predicts patterns of change in cognitive behavioral therapy and medications for depression. Journal of Consulting and Clinical Psychology. doi: 10.1037/a0032985. in press. [DOI] [PMC free article] [PubMed] [Google Scholar]
- Forand NR, Gunthert KC, Cohen LH, Butler AC, Beck JS. Preliminary 520 evidence that anxiety is associated with accelerated response in cognitive therapy for 521 depression. Cognitive Therapy and Research. 2011;35(2):151–160. [Google Scholar]
- Fournier JC, DeRubeis RJ, Shelton RC, Hollon SD, Amsterdam JD, Gallop R. Prediction of response to medication and cognitive therapy in the treatment of 525 moderate to severe depression. Journal of Consulting and Clinical Psychology. 2009;77(4):775–526. 787. doi: 10.1037/a0015401. [DOI] [PMC free article] [PubMed] [Google Scholar]
- Frank E, Cassano GB, Rucci P, Thompson WK, Kraemer HC, Fagiolini A, Forgione RN. Predictors and moderators of time to remission of major depression with interpersonal psychotherapy and SSRI pharmacotherapy. Psychological Medicine. 2011;41(1):151. doi: 10.1017/S0033291710000553. [DOI] [PMC free article] [PubMed] [Google Scholar]
- Frank E, Shear MK, Rucci P, Cyranowski JM, Endicott J, Fagiolini A, Cassano GB. Influence of panic-agoraphobic spectrum symptoms on treatment response in patients with recurrent major depression. American Journal of Psychiatry. 2000;157(7):1101–1107. doi: 10.1176/appi.ajp.157.7.1101. [DOI] [PubMed] [Google Scholar]
- Härdle W. Applied Nonparametric Regression. Cambridge: Cambridge University Press; 1990. [Google Scholar]
- Hamilton M. A rating scale for depression. Journal of Neurology, Neurosurgery, and Psychiatry. 1960;23:56–62. doi: 10.1136/jnnp.23.1.56. [DOI] [PMC free article] [PubMed] [Google Scholar]
- Hamilton M. The assessment of anxiety states by rating. British journal of medical psychology. 1959;32(1):50–55. doi: 10.1111/j.2044-8341.1959.tb00467.x. [DOI] [PubMed] [Google Scholar]
- Hastie TJ, Tibshirani RJ. Varying-coefficient models (with discussion) Journal of the Royal Statistical Society B. 1993;55:757–796. [Google Scholar]
- Hoover DR, Rice JA, Wu CO, Yang LP. Nonparametric smoothing estimates of time-varying coefficient models with longitudinal data. Biometrika. 1998;85:809–822. [Google Scholar]
- Hox JJ. Multilevel analysis: Techniques and applications. Taylor & Francis; 2010. [Google Scholar]
- Johnson J, Weissman MM, Klerman GL. Panic disorder, comorbidity, and suicide attempts. Archives of General Psychiatry. 1990;47(9):805. doi: 10.1001/archpsyc.1990.01810210013002. [DOI] [PubMed] [Google Scholar]
- Kessler RC, Berglund P, Demler O, Jin R, Koretz D, Merikangas KR, Wang PS. The epidemiology of major depressive disorder. JAMA: the journal of the American Medical Association. 2003;289(23):3095–3105. doi: 10.1001/jama.289.23.3095. [DOI] [PubMed] [Google Scholar]
- Klerman GL, Weissman MM, Rounsaville BJ, Chevron E. Interpersonal psychotherapy of depression. New York, NY: Academic Press, Basic Books Inc; 1984. [Google Scholar]
- Levenson JC, Wallace ML, Fournier JC, Rucci P, Frank E. The role of personality pathology in depression treatment outcome with psychotherapy and pharmacotherapy. Journal of Consulting and Clinical Psychology. 2012;80(5):719–729. doi: 10.1037/a0029396. [DOI] [PMC free article] [PubMed] [Google Scholar]
- Linehan MM. Cognitive-behavioral treatment of borderline personality disorder. Guilford Press; 1993. [Google Scholar]
- Littlefield AK, Sher KJ, Wood PK. Is “maturing out” of problematic alcohol involvement related to personality change? Journal of abnormal psychology. 2009;118:360–374. doi: 10.1037/a0015125. [DOI] [PMC free article] [PubMed] [Google Scholar]
- MacKinnon DP, Fairchild AJ. Current directions in mediation analysis. Current Directions in Psychological Science. 2009;18(1):16–20. doi: 10.1111/j.1467-8721.2009.01598.x. [DOI] [PMC free article] [PubMed] [Google Scholar]
- McArdle JJ. Latent variable modeling of differences and changes with longitudinal data. Annual Review of Psychology. 2009;60:577–605. doi: 10.1146/annurev.psych.60.110707.163612. [DOI] [PubMed] [Google Scholar]
- McArdle JJ, Bell RQ. An introduction to latent growth models for developmental data analysis 2000 [Google Scholar]
- Melartin TK, Rytsälä HJ, Leskelä US, Lestelä-Mielonen PS, Sokero TP, Isometsä ET. Current comorbidity of psychiatric disorders among DSM-IV major depressive disorder patients in psychiatric care in the Vantaa Depression Study. The Journal of clinical psychiatry. 2002;63(2):126–134. [PubMed] [Google Scholar]
- Morin AJ, Maïano C, Nagengast B, Marsh HW, Morizot J, Janosz M. General growth mixture analysis of adolescents’ developmental trajectories of anxiety: the impact of untested invariance assumptions on substantive interpretations. Structural Equation Modeling: A Multidisciplinary Journal. 2011;18(4):613–648. [Google Scholar]
- Moskowitz DS, Russell JJ, Sadikaj G, Sutton R. Measuring people intensively. Canadian Psychology. 2009;50(3):131. [Google Scholar]
- Mulder RT. Personality pathology and treatment outcome in major depression: a review. American Journal of Psychiatry. 2002;159(3):359–371. doi: 10.1176/appi.ajp.159.3.359. [DOI] [PubMed] [Google Scholar]
- Muthén B. Latent variable analysis: Growth mixture modeling and related techniques for longitudinal data. In: Kaplan D, editor. Handbook of quantitative methodology for the social sciences. Newbury Park, CA: Sage Publications; 2004. pp. 345–368. [Google Scholar]
- Muthén BO, Curran PJ. General longitudinal modeling of individual differences in experimental designs: A latent variable framework for analysis and power estimation. Psychological Methods. 1997;2(4):371–402. [Google Scholar]
- Papakostas GI, Fava M, Thase ME. Treatment of SSRI-resistant depression: a meta-analysis comparing within-versus across-class switches. Biological psychiatry. 2008;63(7):699. doi: 10.1016/j.biopsych.2007.08.010. [DOI] [PubMed] [Google Scholar]
- Preacher KJ, Wichman AL, MacCallum RC, Briggs NE. Latent growth curve modeling. Vol. 157. Sage; 2008. [Google Scholar]
- Raftery AE. Bayesian model selection in social research. Sociological methodology. 1995;25:111–164. [Google Scholar]
- Raudenbush SW, Bryk AS. Hierarchical linear models: Applications and data analysis methods. Vol. 1. Sage Publications; 2001. Incorporated. [Google Scholar]
- Roy-Byrne PP, Stang P, Wittchen HU, Ustun B, Walters E, Kessler RC. Lifetime panic-depression comorbidity in the National Comorbidity Survey Association with symptoms, impairment, course and help-seeking. The British Journal of Psychiatry. 2000;176(3):229–235. doi: 10.1192/bjp.176.3.229. [DOI] [PubMed] [Google Scholar]
- Rucci P, Miniati M, Oppo A, Mula M, Calugi S, Cassano GB. The structure of lifetime panic-agoraphobic spectrum. Journal of Psychiatric Research. 2009;43:366–379. doi: 10.1016/j.jpsychires.2008.04.002. [DOI] [PubMed] [Google Scholar]
- Shafer AB. Meta-analysis of the factor structures of four depression questionnaires: Beck, CES-D, Hamilton, and Zung. Journal of clinical psychology. 2006;62(1):123–146. doi: 10.1002/jclp.20213. [DOI] [PubMed] [Google Scholar]
- Shear MK, Frank E, Rucci P, Fagiolini DA, Grochocinski VJ, Houck P, Banti S. Panic-agoraphobic spectrum: reliability and validity of assessment instruments. Journal of psychiatric research. 2001;35(1):59–66. doi: 10.1016/s0022-3956(01)00002-4. [DOI] [PubMed] [Google Scholar]
- Shiyko MP, Lanza ST, Tan X, Li R, Shiffman S. Using the time-varying effect model (TVEM) to examine dynamic associations between negative affect and self-confidence on smoking urges: differences between successful quitters and relapsers. Prevention Science. 2012;13:288–299. doi: 10.1007/s11121-011-0264-z. [DOI] [PMC free article] [PubMed] [Google Scholar]
- Singer JD, Willett JB. Applied longitudinal data analysis: Modeling change and event occurrence. Oxford University Press; USA: 2003. [Google Scholar]
- Smits JAJ, Minhajuddin A, Thase ME, Jarrett JB. Outcomes of acute phase cognitive therapy in outpatients with anxious versus nonanxious depression. Psychotherapy and Psychosomatics. 2012;81:153–160. doi: 10.1159/000334909. [DOI] [PMC free article] [PubMed] [Google Scholar]
- Tan X, Shiyko MP, Li R, Li Y, Dierker L. A time-varying effect model for intensive longitudinal data. Psychological Methods. 2012;17:61, 77. doi: 10.1037/a0025814. [DOI] [PMC free article] [PubMed] [Google Scholar]
- Trull TJ, Solhan MB, Tragesser SL, Jahng S, Wood PK, Piasecki TM, Watson D. Affective instability: Measuring a core feature of borderline personality disorder with ecological momentary assessment. Journal of Abnormal Psychology. 2008;117(3):647. doi: 10.1037/a0012532. [DOI] [PubMed] [Google Scholar]
- Wright AGC, Hallquist MN. Mixture modeling methods for the assessment of normal and abnormal personality II: Longitudinal models. Journal of Personality Assessment. doi: 10.1080/00223891.2013.830262. in press. [DOI] [PMC free article] [PubMed] [Google Scholar]
- Wright AGC, Pincus AL, Lenzenweger MF. A parallel process growth model of avoidant personality disorder symptoms and personality traits. Personality Disorders: Theory, Research, and Treatment. doi: 10.1037/a0027773. in press. [DOI] [PMC free article] [PubMed] [Google Scholar]
- Yang J, Tan X, Li R, Wagner A. TVEM (time-varying effect model) SAS macro suite users’ guide (Version 2.1.0) University Park: The Methodology Center, Penn State; 2012. [Google Scholar]
- Zimmerman M, Mattia JI, Posternak MA. Are subjects in pharmacological treatment trials of depression representative of patients in routine clinical practice? American Journal of Psychiatry. 2002;159(3):469–473. doi: 10.1176/appi.ajp.159.3.469. [DOI] [PubMed] [Google Scholar]