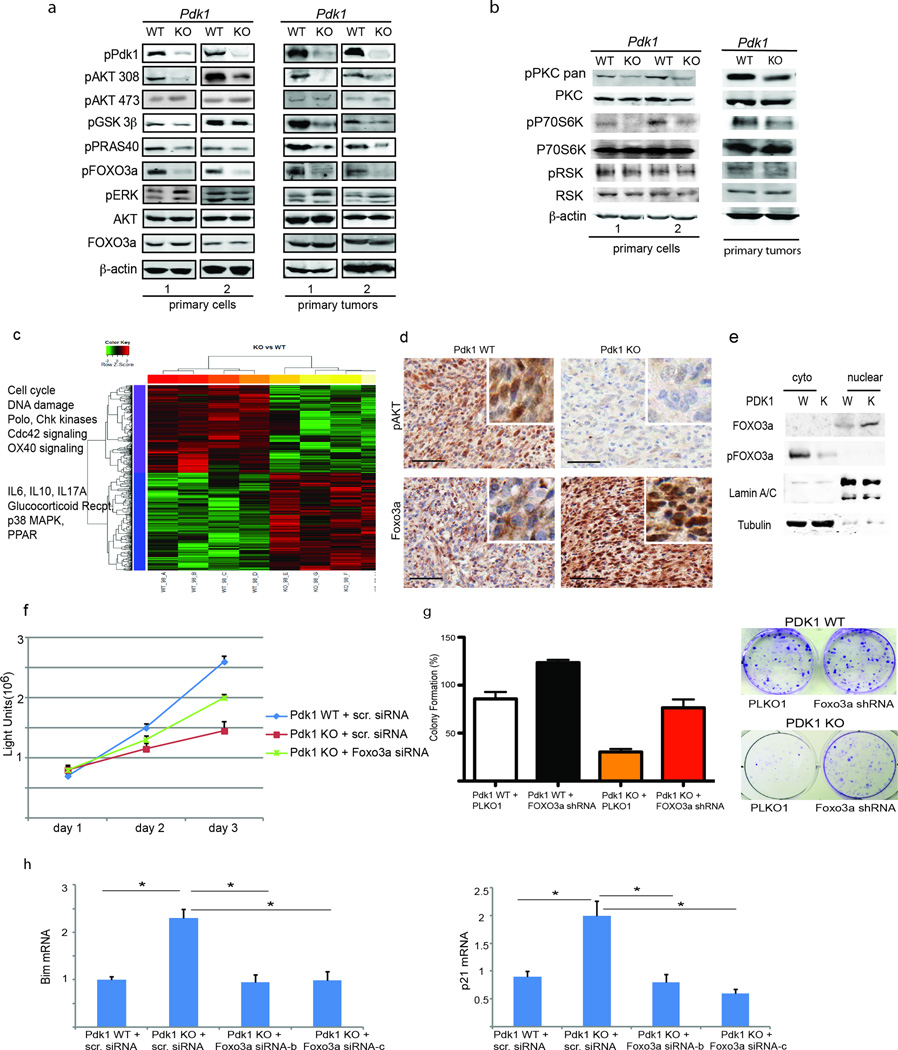
Figure 3. Pdk1 inactivation attenuates AKT and PKC signaling.
(a and b) Western blot analysis was performed using protein lysates from melanoma tumors and their derived primary melanomas cultures under the genetic background BrafV600E::Pten−/−::Cdkn2a−/− with the indicated antibodies. (c) Heat map showing select genes and pathways that were up- or down-regulated in Pdk1–/::BrafV600E::Pten−/−::Cdkn2a−/− melanomas (n = 4). The selected genes have p-values less than or equal to 0.05 and fold changes are >2. The normalized expression signals in the heat map are shown from green (lower) to red (higher signal). Significant genes with similar expression pattern are indicated in bars at the left of the heat map (see Tables S1 to S4 for details). (d) Representative immunostaining of pAKT 308 and Foxo3a in the Pdk1 WT and KO melanomas (BrafV600E::Pten−/−::Cdkn2a−/−). Enlarged areas are shown in insets. (e) Nuclear and cytoplasmic fractionation was performed using protein lysates from primary melanoma cultures under the genetic background BrafV600E::Pten−/−::Cdkn2a−/−, western blot was performed and the membranes were probed with the indicated antibodies. (f) Primary melanoma cultures established from the indicated Pdk1 WT and KO tumors (BrafV600E::Pten−/−::Cdkn2a−/−) were analyzed for cell proliferation (ATP Lite assay) following their transfection with Foxo3a siRNA expression vector. (g) Cultures used in panel (e) were monitored for colony formation assay (representative image of colonies formed in culture is shown on the right panel) following their infection with Foxo3a shRNA expression vector. The graph represents the quantification of the number of colony-forming cells after 7 days in culture. Analysis was performed in triplicates and repeated two times. (h) Cultures used in panel (f) were monitored for changes in gene expression following transfection with two different Foxo3a siRNAs, using QPCR analysis for Bim and p21 mRNA levels. *P < 0.0005.

