Abstract
PURPOSE
To investigate the T2 relaxation values of infrapatellar fat pad (IFP) after arthroscopic surgery.
MATERIALS AND METHODS
This study was approved by the institutional review board; all individuals signed informed consent. We performed MR imaging in sixteen knees from eight subjects. Prior to imaging, each subject had unilateral arthroscopic knee surgery and an asymptomatic non-operated contralateral knee. We used a 10-echo multiple-TE fast-spin echo pulse sequence for creation of T2 relaxation time maps. Two musculoskeletal radiologists independently placed regions of interest in the IFP, suprapatellar subcutaneous and deep intermuscular adipose tissue. Qualitative assessments were performed to assess fibrotic changes affecting patellar retinaculum and IFP. Statistical analyses of T2 values determined differences between groups, correlation with time after surgery, and cut-off values to differentiate groups.
RESULTS
The average time between arthroscopy and imaging was 3.5 ± 0.4 years. IFP of knees with prior surgery had significantly shorter mean T2 values (133 ± 14 ms) when compared to control knees (147 ± 8 ms, P = 0.03). There was no significant difference between operated and control knees regarding T2 values of suprapatellar subcutaneous (P = 0.3) or deep intermuscular adipose tissue (P = 0.2). There was no correlation between IFP T2 values and time after surgery (P > 0.2). IFP T2 values ≤ 139 ms had 75% sensitivity and 88% specificity to identify prior arthroscopy.
CONCLUSION
Shortening of T2 relaxation values is present in IFP chronically after arthroscopic surgery and may be an indicator of adipose tissue fibrosis.
Keywords: T2 relaxometry, infrapatellar fat pad, fibrosis, arthroscopy, MRI
INTRODUCTION
The infrapatellar fat pad (IFP), also known as Hoffa’s fat pad, occupies the anterior knee compartment. It is intracapsular and extrasynovial, delimited posteriorly by the ligamentum mucosum, transverse meniscal ligament, anterior meniscal horns and tibial periosteum (1). Anteriorly, the IFP is in contact with the patellar tendon, retinacula, and inferior pole of patella (1). The IFP is richly vascularized by anastomosing branches of the genicular arteries and highly innervated by a branch of the tibial nerve (2,3). The precise function of the IFP is unknown, however there is evidence suggesting it is a source of reparative cells after injury and also provides biomechanical efficiency to the patellofemoral compartment (1).
The IFP is a common site of inflammation and fibrosis. A variety of fibrotic lesions affect the IFP – such as Hoffa’s disease, anterior interval scarring and infrapatellar contracture syndrome – and may occur as a consequence of direct trauma, surgery, or both (4–8). Arthroscopic surgery has been implicated in the development of IFP fibrosis due to scarring from placement of arthroscopic portals and patellar tendon harvesting for ACL reconstruction (1,8). Previous studies have described qualitative indicators of IFP fibrosis as well as descriptors to differentiate IFP fibrosis from mass-like processes, such as pigmented villonodular synovitis (PVNS) (9). However, no quantitative assessment of IFP signal characteristics is available in postoperative knees. While qualitative assessments are strongly dependent on reader experience and can be biased by patient history, quantitative parameters may allow for objective measures of IFP changes. Development of quantitative reference values may provide critical information in monitoring the progression of IFP fibrosis, supporting management decisions that range from physical therapy to surgical IFP excision, anterior interval release, and synovectomy (1).
The goal of this study was to describe quantitative reference values to determine the presence of post-surgical changes affecting the IFP. To this end, we prospectively examined the T2 relaxation values of multiple fat compartments in knees of subjects with previous arthroscopic surgery, compared to their contralateral non-operated knees.
MATERIALS AND METHODS
Subjects and Clinical Information
This study was approved by our Institutional Review Board and was Health Insurance Portability and Accountability Act compliant. Written informed consent was obtained from all subjects prior to the study. We recruited subjects from our institution’s orthopedics clinic who volunteered for MR imaging of bilateral knees. Subjects had history of prior unilateral arthroscopic surgery, and an intact, asymptomatic contralateral knee with no history of trauma or surgery.
Imaging Protocol and Post-processing
MR imaging of bilateral knees was performed on a 3-Tesla system (Siemens Trio, Erlangen, Germany) using an 8-channel transmit-and-receive knee coil. A tri-plane gradient echo localizer pulse sequence with repetition time (TR) of 15 ms, echo-time (TE) of 5 ms, and slice thickness of 7 mm was obtained. A two-dimensional sagittal multi-slice multi- fast spin echo pulse sequence echo (MSME, 10 echo-times) was used for image acquisition, using the following parameters: TR = 1700ms, TE = 10.6, 21.2, 31.8, 42.2, 53.0, 63.6, 74.2, 84.4, 95.4, 106.0 ms, FOV = 140 × 140 mm, number of signal averages = 1, matrix = 320 × 320, slice thickness = 3 mm, slice gap = 0 mm, bandwidth = 250 Hz/pixel, number of slices = 26–30, total scan time = 11 minutes per knee. Imaging parameters were identical for operated and non-operated knees. Post-contrast pulse sequences were not performed.
A slice through the largest sagittal cross-section of the IFP with no evidence of metallic artifact was used to generate off-line T2 relaxation time maps created on a pixel-by-pixel basis for analyses. All T2 relaxation times were calculated from a mono-exponential fit using OsiriX software version 5.6 (http://www.osirix-viewer.com/index.html).
Imaging Analyses
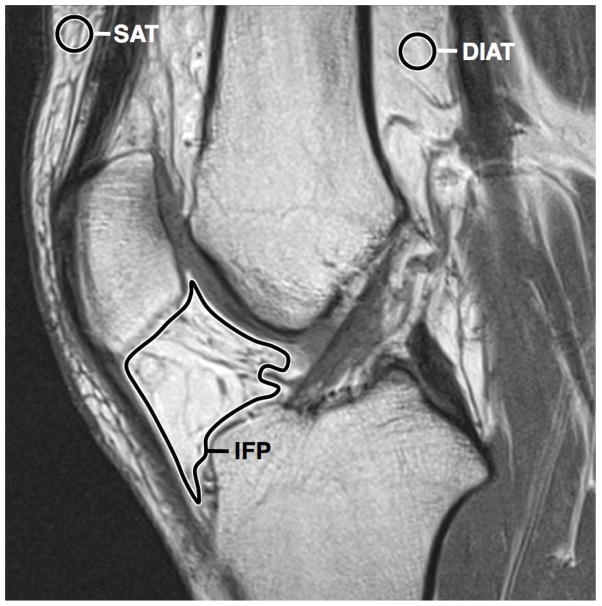
T2 relaxation time maps were independently analyzed by two fellowship-trained radiologists (MT and AKT, 16 and 5 years of experience in musculoskeletal radiology, respectively). Each observer independently measured the mean and standard deviation (SD) of T2 relaxation values in 3 separate regions of interest (ROIs): (a) free-hand ROI traced delimiting the IFP, excluding the transverse meniscal ligament, subchondral bone, and synovial fluid; (b) round 22 mm2 ROI manually placed in the suprapatellar subcutaneous adipose tissue; and (c) round 22 mm2 ROI manually placed in the deep intermuscular adipose tissue (Figure 1). All image analyses were performed using OsiriX software version 5.6 (http://www.osirix-viewer.com/index.html). The T2 relaxation values obtained from both readers were averaged for statistical analyses.
Figure 1.
Sagittal PD-weighted MR image of non-operated knee showing location and tracing of ROIs. SAT, subcutaneous adipose tissue; DIAT, deep intermuscular adipose tissue; IFP, infrapatellar fat pad.
Qualitative assessments were independently performed by the two above-mentioned radiologists using methodology modified from a prior study (9), as follows: on a PD-weighted (TE = 10.6 ms) sagittal slice, the radiologists recorded the presence or absence of fibrosis affecting the medial (MPR) or lateral (LPR) patellar retinaculum, defined as a focal area of low signal intensity retinacular thickening. The readers also recorded fibrosis of medial or lateral IFP, defined as linear areas of irregular low signal intensity.
Since the radiologists were allowed to visualize all sagittal images obtained in each knee, it was not possible to perform blinded readouts since surgical changes (i.e., ACL reconstruction) were visible on operated knees.
Statistical Analyses
One-way analysis of variance t-test and pairwise correlations were performed with JMP version 10 software (SAS Institute, Cary, NC). Receiver operating characteristic (ROC) curve (to determine optimal threshold values), intra-class correlation coefficient (ICC) and Kappa statistic (for interobserver agreement of quantitative and qualitative parameters, respectively) were calculated using MedCalc version 9.2.1.0 software (MedCalc, Mariakerke, Belgium). ICC ranges from 0 (no agreement) to 1 (perfect agreement) were used. A κ value of 0–0.20 indicated poor agreement; 0.21– 0.40, fair agreement; 0.41–0.60, moderate agreement; 0.61–0.80, good agreement; and 0.81–1.00, very good agreement. P < 0.05 was considered to indicate significant differences. All measurements were expressed in milliseconds ± standard deviation.
RESULTS
Subject selection and Clinical Information
A total of sixteen knees from eight subjects were examined (4 males and 4 females; aged 38 ± 8.7 years). Subjects were active on minimal to moderate athletic level before surgery, and had a primary complaint of unilateral persistent pain or instability that limited athletic activities or work, and prompted the decision to undergo arthroscopic surgery. Detailed clinical and surgical information for each patient is outlined on Table 1. One subject had prior arthroscopic surgery and complained of mild tenderness in the inferior pole of the right patella. All remaining subjects had a positive unilateral Lachmann test (indicative of ACL rupture). Half of subjects had positive unilateral grade 2 pivot shift and anterior drawer tests (indicative of ACL rupture). All patients underwent arthroscopic surgery at our institution, with an average of 3.5 ± 0.4 years between surgery and multi-echo MR imaging acquisition.
Table 1.
Clinical and surgical information from subjects participating in the study.
| ID | Age | Gender | Δt | Side | Diagnosis at Arthroscopy | Arthroscopic Surgery Performed * |
|---|---|---|---|---|---|---|
| 1 | 46 | F | 3.2 | R | ACL complete tear, LM tear | ACL reconstruction (patellar tendon graft), partial lateral meniscectomy |
| 2 | 35 | F | 3.6 | R | ACL complete tear, LM tear | ACL reconstruction (patellar tendon graft), partial lateral meniscectomy |
| 3 | 24 | F | 2.7 | R | Intact ACL graft **, Patellar chondral defect | Patellar chondroplasty, lysis of adhesions and hardware removal |
| 4 | 50 | M | 3.8 | R | ACL complete tear, LM tear, MM tear, patellofemoral and lateral tibial plateau chondral defect | ACL reconstruction (patellar tendon graft), partial lateral and medial meniscectomy, chondroplasty |
| 5 | 32 | M | 3.8 | R | ACL complete tear, LM tear | ACL reconstruction (patellar tendon graft), partial lateral meniscectomy |
| 6 | 46 | M | 3.6 | L | ACL complete tear, MM tear, patellar and medial femoral condyle chondral defect | ACL reconstruction (hamstring tendon graft), partial medial meniscectomy, chondroplasty |
| 7 | 37 | M | 3.6 | L | ACL complete tear | ACL reconstruction (patellar tendon graft) |
| 8 | 34 | F | 3.6 | L | ACL complete tear, LM tear | ACL reconstruction (hamstring tendon graft), partial lateral meniscectomy |
Δt (years between surgery and imaging), ACL (anterior cruciate ligament), LM (lateral meniscus), MM (medial meniscus).
All cases used two portals for arthroscopy (inferolateral and inferomedial).
Surgery for ACL reconstruction one year before.
Quantitative Parameters
The results for comparison of mean T2 relaxation values from all adipose tissue measurements between groups and ROC cut-off values for IFP values to detect operated knees are outlined on Table 2. The IFP of operated knees showed significantly lower mean T2 relaxation values (Figures 2 and 3). No significant differences were seen between operated and non-operated knees regarding T2 relaxation values of suprapatellar and deep intermuscular adipose tissue. There was no significant correlation between time since surgery and T2 relaxation values of IFP (P = 0.2). The ICC for measures of T2 relaxation values for IFP, subcutaneous, and deep intermuscular adipose tissue between the two observers were 0.9989 (95% confidence interval = 0.9965 – 0.9996), 0.9787 (0.9404 – 0.9925), and 0.9721 (0.9199 – 0.9903), respectively. These results showed overall excellent agreement between observer measurements for all parameters.
Table 2.
Results for statistical analyses of 16 knees.
| Measurement * | Operated (ms) | Non-operated (ms) | P-value | Cut-off (ms) ** | Sensitivity (%) | Specificity (%) |
|---|---|---|---|---|---|---|
| IFP T2 value | 133 ± 14 | 147 ± 8 | 0.03 | ≤ 139 | 75 | 88 |
| SAT T2 value | 141 ± 11 | 147 ± 16 | 0.3 | - | - | - |
| DIAT T2 value | 146 ± 25 | 158 ± 13 | 0.2 | - | - | - |
All measurements are mean ± standard deviation.
IFP: infrapatellar fat pad.
SAT: suprapatellar adipose tissue.
DIAT: deep intermuscular adipose tissue.
ms: milliseconds.
obtained from largest sagittal cross-section of IFP.
calculated for highest sensitivity and specificity. ROC area under the curve of 0.781 (95% confidence interval = 0.509 – 0.944), P = 0.03.
Figure 2.
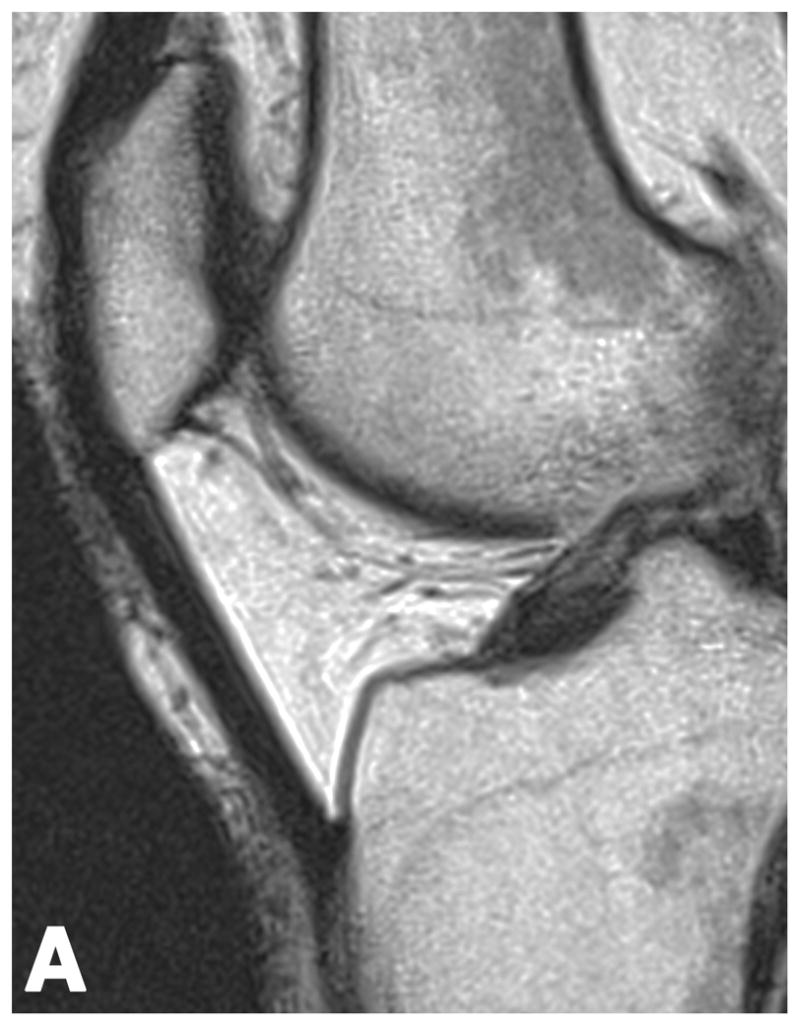
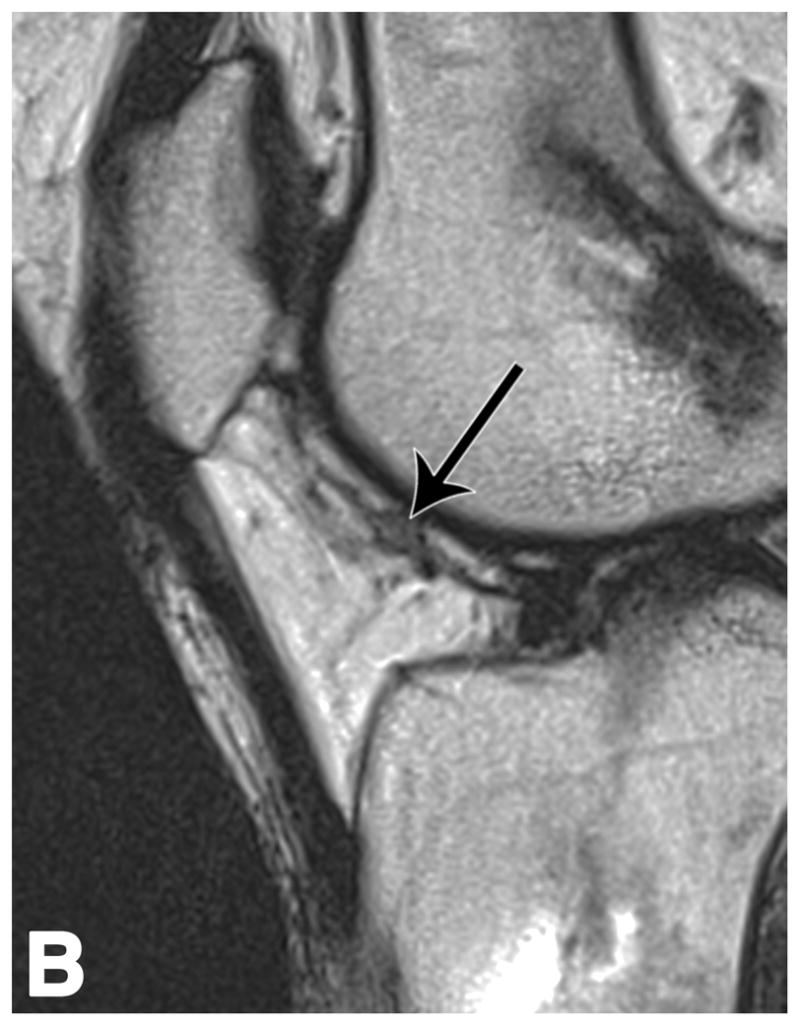
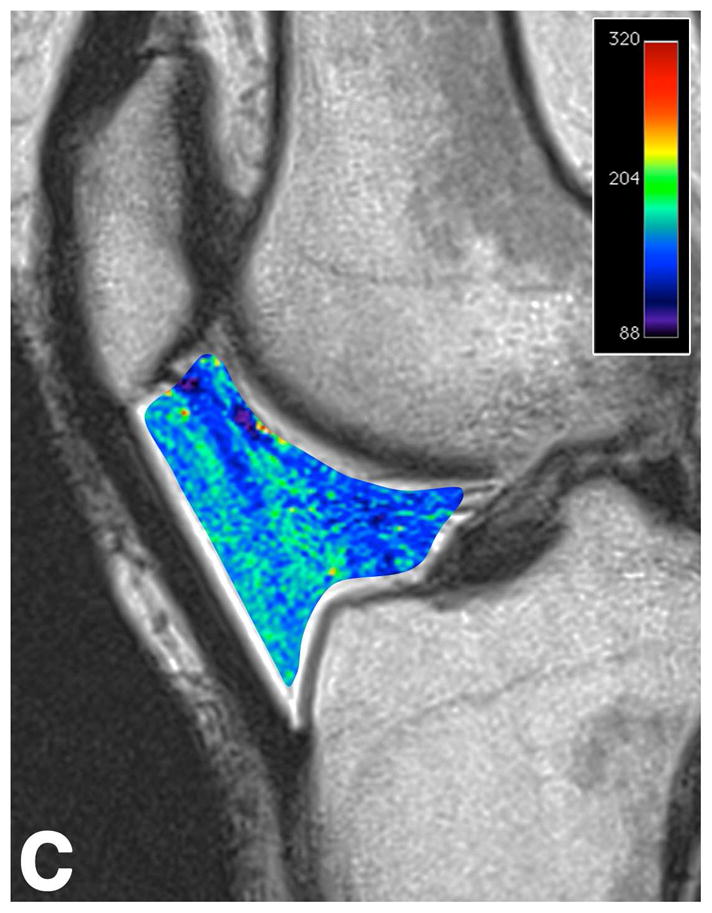
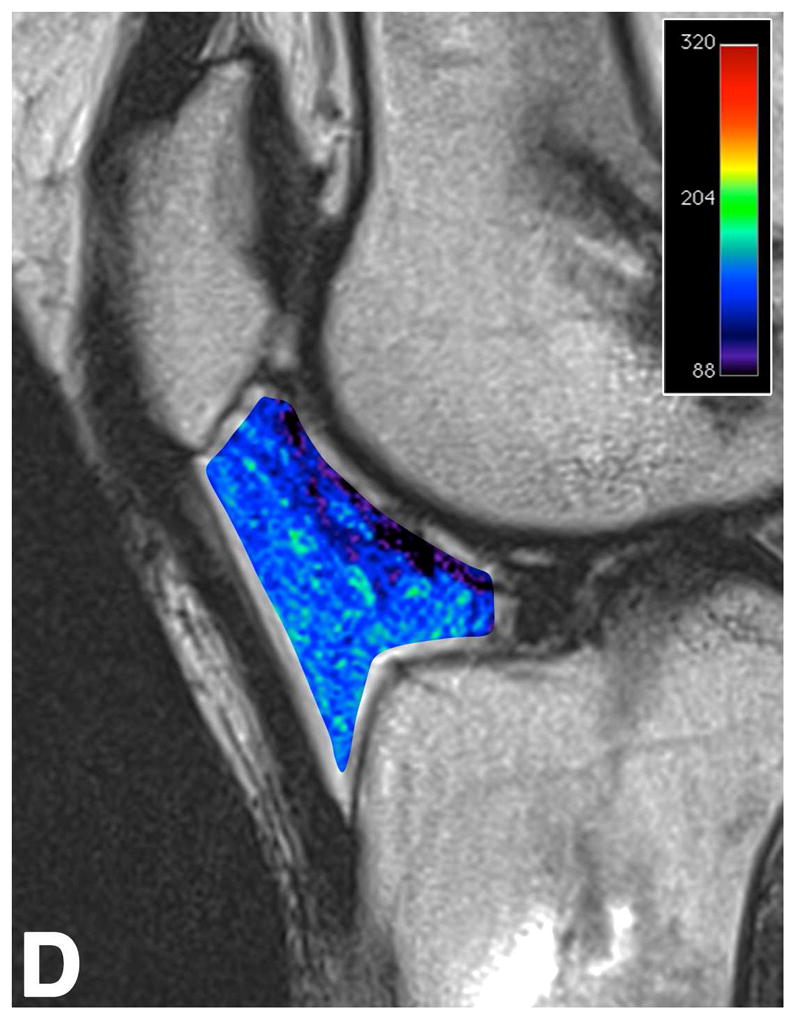
Sagittal T2-weighted (TR/TE = 1700/106) MR images of bilateral knees of a 46-year-old female, with history of prior right ACL arthroscopic repair (3.2 years ago). (A) Non-operated left knee shows normal appearance of the IFP. (B) Operated right knee shows area of presumed fibrosis (arrow) affecting the deep portion of IFP. (C) Overlaid T2 relaxation map of non-operated left knee with mean values of 163 ± 19 ms. (D) Overlaid T2 relaxation map of operated right knee shows shorter diffusely mean T2 values (150 ± 18 ms) present in areas of obvious fibrosis and normal-appearing adipose tissue in the anterior IFP. The T2 relaxation maps use a narrow scale from 88 to 320 ms for illustrative purposes.
Figure 3.
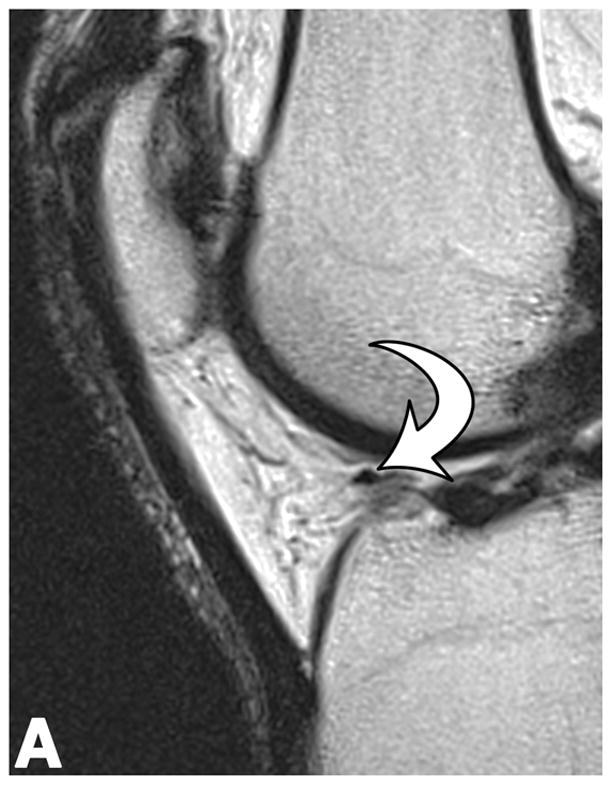
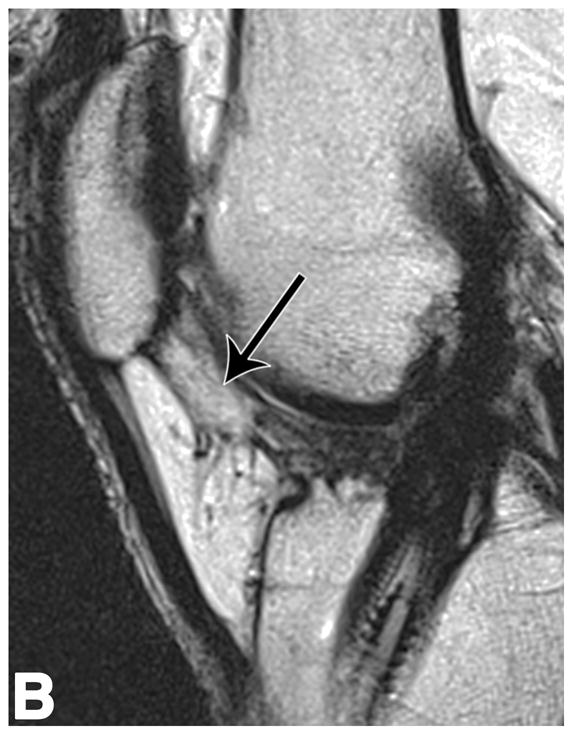
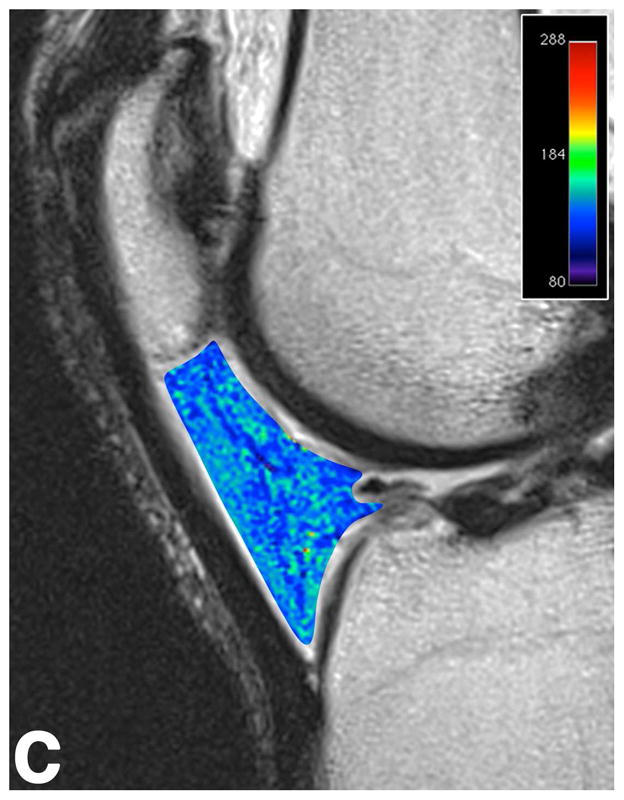
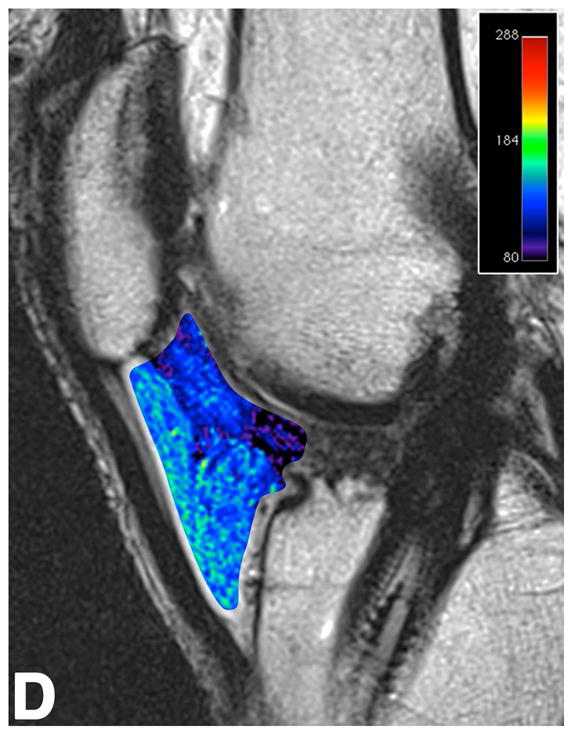
Sagittal T2-weighted (TR/TE = 1700/106) MR images of bilateral knees of a 46-year-old male, with history of prior left ACL arthroscopic repair using hamstring tendon graft (3.6 years ago). (A) Non-operated right knee shows normal appearance of the IFP and transverse meniscal ligament (curved arrow). (B) Operated left knee shows area of presumed fibrosis (arrow) affecting the deep portion of IFP. (C) Overlaid T2 relaxation map of non-operated right knee with mean values of 145 ± 12 ms. (D) Overlaid T2 relaxation map of operated left knee showing shorter mean T2 values (130 ± 27 ms). The T2 relaxation maps use a narrow scale from 80 to 288 ms for illustrative purposes.
Qualitative Parameters
Inter-observer agreement among readers for detection of fibrosis was very good for MPR (κ = 0.88), good for LPR (κ = 0.64), very good for medial IFP (κ = 1.00), and good for lateral IFP (κ = 0.74). In operated knees, fibrosis of the MPR, LPR, medial and lateral IFP was seen in 88% (7/8), 25% (2/8), 100% (8/8), and 88% (7/8), respectively. No mass-like lesions (i.e., Cyclops lesion) were identified. As expected, changes suggestive of fibrosis were not seen in non-operated knees.
DISCUSSION
Our study showed that 3.5 years after arthroscopic surgery, T2 relaxation values were significantly lower in IFP of operated knees compared to controls. Furthermore, T2 relaxation times of IFP discriminated operated from control knees with good sensitivity and specificity. While qualitative MR imaging of IFP fibrosis has been extensively discussed in the literature (1,4,5,7,9), no quantitative assessment has compared operated to non-operated knees. In a prior study using conventional MR imaging, qualitative features indicating prior knee arthroscopy were examined, including low signal intensity fibrosis of the MPR, LPR, medial and lateral IFP (9). Detection of fibrosis affecting the MPR had 82% sensitivity and 72% specificity to detect prior knee arthroscopy (9). Furthermore, a patient with visible fibrosis of the MPR was 45.5 times more likely to have had prior knee arthroscopy (9). Using similar methodology, we found evidence of MPR fibrosis in 88% of knees with prior arthroscopy. Objective measures from our study further extend these findings by providing reference values that allow monitoring the evolution of IFP fibrosis after knee arthroscopy or open surgery. Furthermore, our data support the notion that objective measures of IFP fibrosis are feasible and may overcome limitations of qualitative assessments, such as reader experience, reproducibility and clinical bias.
Hemorrhagic and inflammatory changes that lead to IFP scarring and fibrosis can be secondary to acute trauma, repetitive microtrauma, and iatrogenic injury (7,8,10,11). Iatrogenic injury to the IFP typically occurs from the creation of arthroscopic portals and scarring from patellar tendon harvest during ACL reconstruction (1,8,9). Arthroscopically, chronic fibrosis of IFP appears as whitened tissue with a firm texture (12–15). On MR imaging, post-surgical fibrosis of the IFP appears as linear irregular hypointense signal intensity on T1-, T2-, and proton-density weighted MR images, tracking along portal paths (1,4,9). While scarring of IFP is thought to peak at 6 months post-arthroscopy and gradually decline afterwards (9,16), both quantitative and qualitative measures from our study show persistence of changes suggestive of IFP fibrosis up to 3.5 years after surgery.
There is limited data on T2 relaxation time changes in adipose tissue fibrosis. In a study of retroperitoneal fibrosis using low magnetic field strength (0.35-Tesla), T2 relaxation values of fibrosis (54–64 ms) were lower than retroperitoneal fat (73 ms) (17). When examining T2 values of myocardial fibrosis in mice, Bun et al. (18) found a strong negative correlation between myocardial T2 relaxation times and myocardial collagen content in diabetic mice. Experimental inducement of liver and marrow fibrosis in animal models has shown initial prolongation of T2 values within 1–4 weeks likely related to edema, inflammatory change and hemorrhage (18,19). At 60 days, marrow of irradiated rats showed a dose-dependent marked shortening of T2 values that was attributed to the combined effect of fibrosis and hemosiderin susceptibility effect from resolving hemorrhage (19). While long-term studies of adipose tissue fibrosis after damage are not available, it is possible that macrophage clearance of hemosiderin over the span of several years may decrease its contribution to T2 shortening. Potential explanations for lower T2 relaxation values in chronic fibrotic tissues as in our cohort include lower water content and greater overall surface area in the form of intra- or extra-cellular fibrillar macromolecules, which tend to yield shorter T2 values (18,20). In our cohort of post-operative IFP, although subjects were studied 3.5 years after surgery and had qualitative findings of fibrosis, there could be superimposed changes from hemorrhage and blood products contributing to T2 shortening. This hemosiderin component may be located within the substance of fibrotic scars and not macroscopically visible on proton-density weighted MR images. However, evidence from prior studies examining IFP tissue after ACL injury and knee surgery point towards a significant upregulation in collagen deposition (8,21).
Although the exact mechanism of arthrofibrosis is unknown, it is likely that inflammatory and fibrogenic cytokines produced by the inflamed synovium promote activation and proliferation of fibroblasts, leading to excessive deposition of collagen in the synovium and IFP (8,21). In a prior study that analyzed histology of arthrofibrotic tissue following knee ligament surgery, marked synovial hyperplasia, infiltration of inflammatory cells, and vascular proliferation were noted up to 16 months after surgery (21). Importantly, immunohistochemistry revealed diffusely increased type III and VI collagen, with the latter more prevalent subsynovially and around capillary walls (21). In fact, increased amounts of collagen type VI have been observed in fibromatosis, keloids, lung fibrosis, and can be increased 10-fold in liver fibrotic livers (21). Murakami et al. (8) noted that beyond 3 months after ACL injury, IFP synovitis subsided while fibrosis progressed. In another study, a significant increase in synovial collagen of IFP after ACL reconstruction was seen by immunohistochemistry, regardless of surgical approach (patellar or semitendinosus/gracilis tendon autograft) (7). However, most variability and severity in fibrosis was seen in patients with patellar tendon autografts, leading the authors to speculate that patellar tendon harvest is more likely to increase IFP inflammation due to their proximity (7). Although the goal of our study was not to compare IFP changes from both techniques or obtain IFP histology, it seems reasonable to hypothesize that the overall shortening of T2 relaxation times in operated knees likely had an important contribution from increased collagen content.
Our study has limitations. At the time of imaging, our subjects did not have specific symptoms of IFP fibrosis, so our results cannot be linked to specific post-surgical symptoms. There was no record of intra-articular knee injections before or after surgery, which could contribute to signal changes of the IFP. Tissue samples were not obtained from IFP for histologic analysis after imaging to assess the presence of fibrosis. While scarring and fibrosis are the most likely chronic change after arthroscopy, T2 shortening of IFP could also be influenced by other non-fibrotic entities such as hemosiderin and ossification from fat necrosis. As performed in our study, T2 relaxation measurements may be subject to variability introduced by ROI placement, as well as choice of MR imaging coils and acquisition parameters. We did not obtain serial MR imaging studies to examine the evolution of T2 relaxation values after surgery, with our data reflecting only chronic changes. Therefore, our lack of correlation between T2 relaxation values and time after surgery may be due to the absence of cases with sub-acute and shorter follow-up time course in our cohort. However, our results provide insight into chronic arthroscopic IFP changes without influence from acute postoperative hemorrhage and inflammation typically seen in the first year after arthroscopic surgery.
In summary, shortening of T2 relaxation values in IFP was seen in knees with prior arthroscopic surgery compared to control knees. While these findings suggest this phenomenon could be related to post-surgical changes that cause T2 shortening, such as adipose tissue fibrosis, more extensive studies with surgical and histopathological correlation are warranted.
Acknowledgments
GRANT SUPPORT: This study was supported by the National Institutes of Health (R01 AR055612) and MGH Department of Radiology.
Footnotes
DISCLOSURE: No conflict of interest.
Conflict of interest
The authors declare that they have no conflict of interest.
References
- 1.Dragoo JL, Johnson C, McConnell J. Evaluation and treatment of disorders of the infrapatellar fat pad. Sports medicine. 2012 Jan 1;42(1):51–67. doi: 10.2165/11595680-000000000-00000. [DOI] [PubMed] [Google Scholar]
- 2.Scapinelli R. Vascular anatomy of the human cruciate ligaments and surrounding structures. Clinical anatomy. 1997 Jan;10(3):151–62. doi: 10.1002/(SICI)1098-2353(1997)10:3<151::AID-CA1>3.0.CO;2-X. [DOI] [PubMed] [Google Scholar]
- 3.Kennedy JC, Alexander IJ, Hayes KC. Nerve supply of the human knee and its functional importance. The American journal of sports medicine. 1982;10(6):329–35. doi: 10.1177/036354658201000601. [DOI] [PubMed] [Google Scholar]
- 4.Jacobson JA, Lenchik L, Ruhoy MK, Schweitzer ME, Resnick D. MR imaging of the infrapatellar fat pad of Hoffa. Radiographics. 1997;17(3):675–91. doi: 10.1148/radiographics.17.3.9153705. [DOI] [PubMed] [Google Scholar]
- 5.Steadman JR, Dragoo JL, Hines SL, Briggs KK. Arthroscopic release for symptomatic scarring of the anterior interval of the knee. The American journal of sports medicine. 2008 Sep;36(9):1763–9. doi: 10.1177/0363546508320480. [DOI] [PubMed] [Google Scholar]
- 6.Paulos LE, Wnorowski DC, Greenwald AE. Infrapatellar contracture syndrome. Diagnosis, treatment, and long-term followup. The American journal of sports medicine. 1994;22(4):440–9. doi: 10.1177/036354659402200402. [DOI] [PubMed] [Google Scholar]
- 7.Murakami S, Muneta T, Ezura Y, Furuya K, Yamamoto H. Quantitative analysis of synovial fibrosis in the infrapatellar fat pad before and after anterior cruciate ligament reconstruction. The American journal of sports medicine. 1997;25(1):29–34. doi: 10.1177/036354659702500106. [DOI] [PubMed] [Google Scholar]
- 8.Murakami S, Muneta T, Furuya K, Saito I, Miyasaka N, Yamamoto H. Immunohistologic analysis of synovium in infrapatellar fat pad after anterior cruciate ligament injury. The American journal of sports medicine. 1995;23(6):763–8. doi: 10.1177/036354659502300622. [DOI] [PubMed] [Google Scholar]
- 9.Discepola F, Park JS, Clopton P, Knoll AN, Austin MJ, Le HBQ, et al. Valid MR imaging predictors of prior knee arthroscopy. Skeletal radiology. 2012 Jan;41(1):67–74. doi: 10.1007/s00256-011-1121-7. [DOI] [PubMed] [Google Scholar]
- 10.Chung CB, Skaf A, Roger B, Campos J, Stump X, Resnick D. Patellar tendon-lateral femoral condyle friction syndrome: MR imaging in 42 patients. Skeletal radiology. 2001 Dec;30(12):694–7. doi: 10.1007/s002560100409. [DOI] [PubMed] [Google Scholar]
- 11.Abreu MR, Chung CB, Trudell D, Resnick D. Hoffa’s fat pad injuries and their relationship with anterior cruciate ligament tears: new observations based on MR imaging in patients and MR imaging and anatomic correlation in cadavers. Skeletal radiology. 2008 Apr;37(4):301–6. doi: 10.1007/s00256-007-0427-y. [DOI] [PubMed] [Google Scholar]
- 12.Kumar D, Alvand A, Beacon JP. Impingement of infrapatellar fat pad (Hoffa’s disease): results of high-portal arthroscopic resection. Arthroscopy. 2007 Nov;23(11):1180–1186.e1. doi: 10.1016/j.arthro.2007.05.013. [DOI] [PubMed] [Google Scholar]
- 13.Ogilvie-Harris DJ, Giddens J. Hoffa’s disease: arthroscopic resection of the infrapatellar fat pad. Arthroscopy. 1994 Apr;10(2):184–7. doi: 10.1016/s0749-8063(05)80091-x. [DOI] [PubMed] [Google Scholar]
- 14.Bayar A, Turhan E, Ozer T, Keser S, Ege A, Erdem Z. The fate of patellar tendon and infrapatellar fat pad after arthroscopy via central portal. Knee surgery, sports traumatology, arthroscopy. 2008 Dec;16(12):1114–20. doi: 10.1007/s00167-008-0612-0. [DOI] [PubMed] [Google Scholar]
- 15.Von Engelhardt LV, Tokmakidis E, Lahner M, Dàvid A, Haage P, Bouillon B, et al. Hoffa’s fat pad impingement treated arthroscopically: related findings on preoperative MRI in a case series of 62 patients. Archives of orthopaedic and trauma surgery. 2010 Aug;130(8):1041–51. doi: 10.1007/s00402-010-1133-0. [DOI] [PubMed] [Google Scholar]
- 16.Gohil S, Falconer TM, Breidahl W, Annear PO. Serial MRI and clinical assessment of cyclops lesions. Knee surgery, sports traumatology, arthroscopy. 2013 Apr 10; doi: 10.1007/s00167-013-2480-5. [DOI] [PubMed] [Google Scholar]
- 17.Hricak H, Higgins CB, Williams RD. Nuclear magnetic resonance imaging in retroperitoneal fibrosis. AJR American journal of roentgenology. 1983 Jul;141(1):35–8. doi: 10.2214/ajr.141.1.35. [DOI] [PubMed] [Google Scholar]
- 18.Bun S-S, Kober F, Jacquier A, Espinosa L, Kalifa J, Bonzi M-F, et al. Value of in vivo T2 measurement for myocardial fibrosis assessment in diabetic mice at 11.75 T. Investigative radiology. 2012 May;47(5):319–23. doi: 10.1097/RLI.0b013e318243e062. [DOI] [PubMed] [Google Scholar]
- 19.Sugimura H, Kisanuki A, Tamura S, Kihara Y, Watanabe K, Sumiyoshi A. Magnetic resonance imaging of bone marrow changes after irradiation. Investigative radiology. 1994 Jan;29(1):35–41. doi: 10.1097/00004424-199401000-00005. [DOI] [PubMed] [Google Scholar]
- 20.Cameron IL, Ord VA, Fullerton GD. Characterization of proton NMR relaxation times in normal and pathological tissues by correlation with other tissue parameters. Magnetic resonance imaging. 1984 Jan;2(2):97–106. doi: 10.1016/0730-725x(84)90063-8. [DOI] [PubMed] [Google Scholar]
- 21.Zeichen J, van Griensven M, Albers I, Lobenhoffer P, Bosch U. Immunohistochemical localization of collagen VI in arthrofibrosis. Archives of orthopaedic and trauma surgery. 1999 Jan;119(5–6):315–8. doi: 10.1007/s004020050417. [DOI] [PubMed] [Google Scholar]


