Abstract
Pseudomonas aeruginosa is a monoflagellated bacterium that can use its single polar flagellum to swim through liquids and move collectively over semisolid surfaces, a behavior called swarming. Previous studies have shown that experimental evolution in swarming colonies leads to the selection of hyperswarming bacteria with multiple flagella. Here we show that the advantage of such hyperswarmer mutants cannot be explained simply by an increase in the raw swimming speed of individual bacteria in liquids. Cell tracking of time-lapse microscopy to quantify single-cell swimming patterns reveals that both wild-type and hyperswarmers alternate between forward and backward runs, rather than doing the run-and-tumble characteristic of enteric bacteria such as E. coli. High-throughput measurement of swimming speeds reveals that hyperswarmers do not swim faster than wild-type in liquid. Wild-type reverses swimming direction in sharp turns without a significant impact on its speed, whereas multiflagellated hyperswarmers tend to alternate fast and slow runs and have wider turning angles. Nonetheless, macroscopic measurement of swimming and swarming speed in colonies shows that hyperswarmers expand faster than wild-type on surfaces and through soft agar matrices. A mathematical model explains how wider turning angles lead to faster spreading when swimming through agar. Our study describes for the first time the swimming patterns in multiflagellated P. aeruginosa mutants and reveals that collective and individual motility in bacteria are not necessarily correlated. Understanding bacterial adaptations to surface motility, such as hyperswarming, requires a collective behavior approach.
Introduction
Pseudomonas aeruginosa is an opportunistic human pathogen and an environmental microbe that is capable of living in a variety of environments. This versatile microbe has several types of motility including twitching, swimming and swarming motility. Swimming in P. aeruginosa is mediated by a single polar flagellum1. Its flagellar motor can rotate in two directions, clockwise or counterclockwise, resulting in either forward or backward propulsion in aqueous environments2. Swarming is a collective form of surface motility where a dense colony of bacteria migrates on a semi-solid surface, such as an agar gel3, 4. Like swimming, swarming motility requires flagellar motility3 but, in addition, it requires the production and secretion of rhamnolipid surfactants thought to reduce friction between bacteria and the surface5–11. Swarming occurs in many species of bacteria12. The fact that the same flagellar system that drives swarming also enables to swim in liquids raises the question of whether swimming and swarming are distinct phenomena13. Here we present evidence that these are indeed distinct phenomena, at least in P. aeruginosa.
We analyze hyperswarmer mutants with dramatically enhanced swarming capabilities, obtained recently from experimental evolution14. All independently evolved hyperswarmer mutants harbor single point mutations in the same protein, FleN, which is the anti-activator of the flagellar master regulator15. The genetic causality of the hyperswarmer genotype was firmly established using microbial genetics techniques15. Hyperswarmers have 2 or more polar flagella, in contrast with the single polar flagellum of wild-type (Fig. 1A and E). In a swarming assay, a single wild-type P. aeruginosa colony covers about ⅓ of the agar plate making characteristic branched patterns14. In contrast, colonies of hyperswarmers can cover the whole agar plate and show no branching patterns (Fig. 1B). Hyperswarmers are also poor biofilm formers compared to wild-type. This supports the existence of an antagonism between biofilm formation and motility which may affect the pathogenicity of P. aeruginosa and may eventually lead to new therapies against biofilm formation13.
Figure 1.
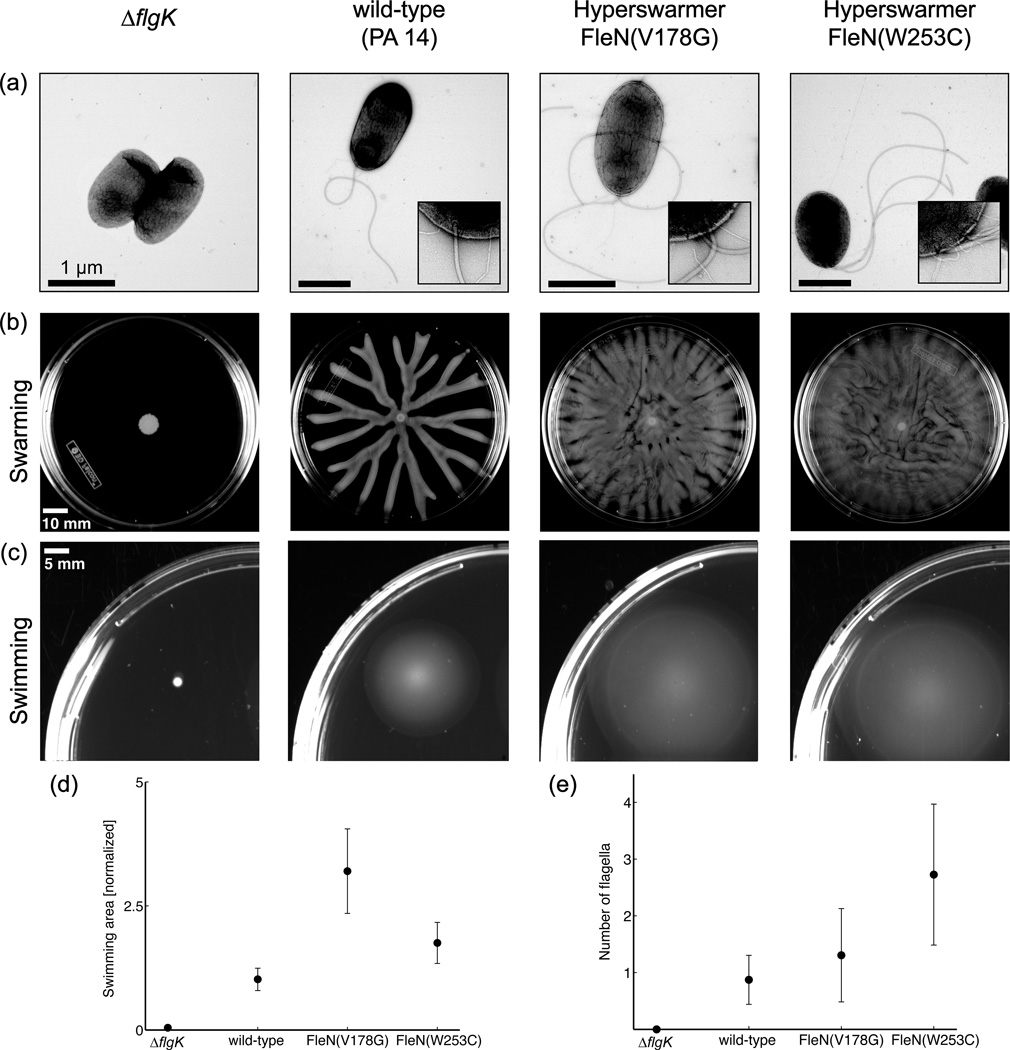
Motility patterns of non-flagellated (∆flgK), mono-flagellated (wild-type) and multi-flagellated (two hyperswarmer clones) Pseudomonas aeruginosa, as shown by transmission electron microscopy (a). Insets show 88,000× magnification of the cell pole. Swarming (b) and swimming (c) motility are dependent on the number of flagella. (d) Quantification of the swimming area for the different strains and (e) quantification of the number of flagella. Data and pictures reproduced from van Ditmarsch14.
Since the discovery of the multiflagellated, hyperswarming FleN mutants is very recent14, very little is still known about their swimming behavior. Completely knocking out FleN creates multiflagellated mutants unable to swim15,14, whereas our point mutation hyperswarmers show increased swimming in classical the soft agar assay (Fig. 1C,D). However, classical swimming assays still portray macroscopic motility behaviors that are not informative of single cell motility. Because flagella are required for both swimming and swarming, an intriguing question is if the increased number of flagella in hyperswarmers translates into enhanced swimming at the single-cell level. This study is, to the best of our knowledge, the first observation of swimming patterns in this kind of multiflagellated mutant of P. aeruginosa.
We confirmed with macroscopic measurements of swarming motility and swimming through soft agar that hyperswarmers spread faster in these environments. Then we investigated whether hyperswarmers swim faster than wild-type P. aeruginosa in liquid by measuring swimming speeds using a single-cell tracking method and quantitative image analysis. Counter-intuitively, we observed that hyperswarmers do not swim faster than wild-type. Having multiple flagella does, however, increase the variability in swimming speed of single cells, which become much more likely to alter their speed after a turn and to make wider turns than the wild-type. We also performed single-cell tracking through soft agar. We observed that wild-type P. aeruginosa swim slightly faster than hyperswarmers in this environment. However, hyperswarmers diffuse much faster than wild-type. A mathematical model with adjustable turning angle explains how a wider turning angle distribution can lead to a faster spreading. These contrasting observations support that in order to understand the evolutionary adaptations to swarming, such as hyperswarming, one must study bacterial motility from a collective behavior perspective.
Results and discussion
Hyperswarmers move faster through and on agar gels
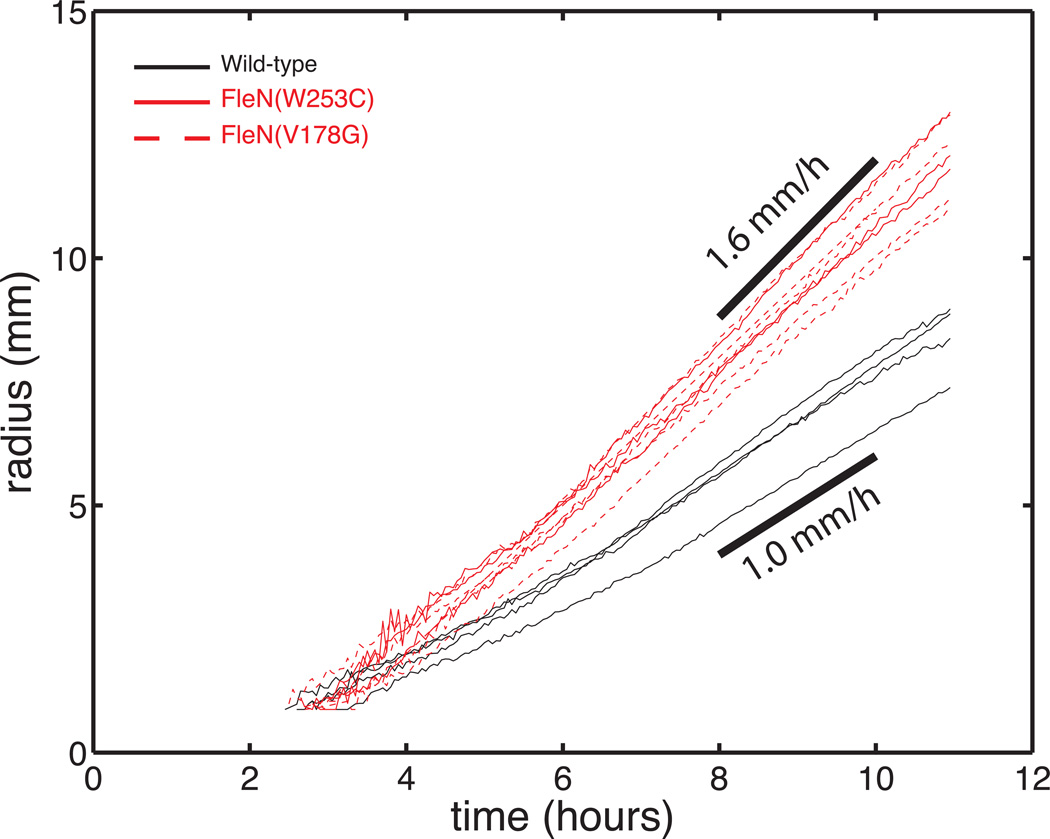
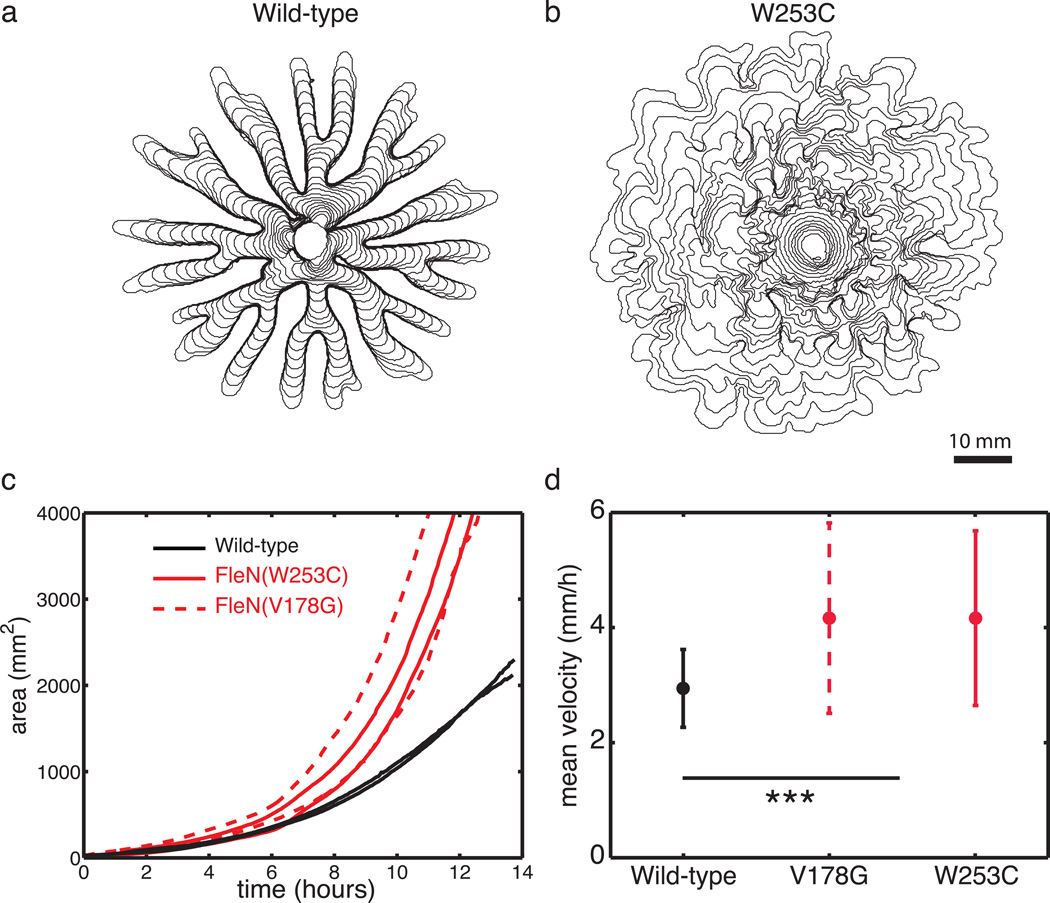
Swarming and swimming through agar in P. aeruginosa and its hyperswarmer mutants has only been compared through end-point measurements14. Here we measured the expansion speed by tracking the colony edge over time. We first quantified swimming in the classical microbiology swimming assay. This assay consists of observing the spreading of a colony as it swims through soft agar prepared at a concentration of 0.3% (w/v). In agreement with previous measurements14, both hyperswarmer clones spread significantly faster than wild-type (Fig. 2). Next, we tracked the expansion of swarming colonies (Fig. 3A,B). The total area of the colony (Fig. 3C) and the speed of the advancing edge (tracked by following the tip of the tendrils for wild-type, or the protrusions for the hyperswarmers, Fig. 3D) reveal that hyperswarmers are faster than wild-type (Fig. 2D, p<0.001 by Kruskal-Wallis test). The typical swimming speed (1 mm/h) does not match the typical swarming speed (3 mm/h), reinforcing that these two motility modes differ mechanistically.
Figure 2.
Hyperswarmers spread faster than wild-type P. aeruginosa when swimming through 0.3% (w/v) agar, the classical microbiology assay to assess motility. Plot shows the radius of expanding swimming colonies as a function of time.
Figure 3.
Hyperswarmers spread faster than wild-type P. aeruginosa over soft surfaces prepared at 0.5% (w/v) agar (swarming media). (a) Contour plot from a time lapse of swarming wild-type. Contours drawn at 10 minutes intervals. (b) Contour plot for the hyperswarmer with mutation FleN(W253C), also drawn at 10 minutes intervals. (c) The area of the expanding colony over time shows that hyperswarmers spread faster than wild-type over swarming media. (d) Mean velocity of the swarming colony front confirms that hyperswarmers are faster than wild-type in swarming media.
Time lapse imaging of bacteria and flagellar filaments
In order to observe P. aeruginosa swimming patterns in liquid we labeled bacteria using Alexa Fluor® 488 carboxylic acid, succinimidyl ester which binds to lysine residues16. This dye will bind to any protein on the membrane of bacteria as well as their flagella. There are about 30 lysines per flagellin unit, and each flagellum is made of thousands of flagellins17. We then imaged bacteria using fluorescence microscopy and constructed time-lapse videos at an average frame rate of 16.6 fps.
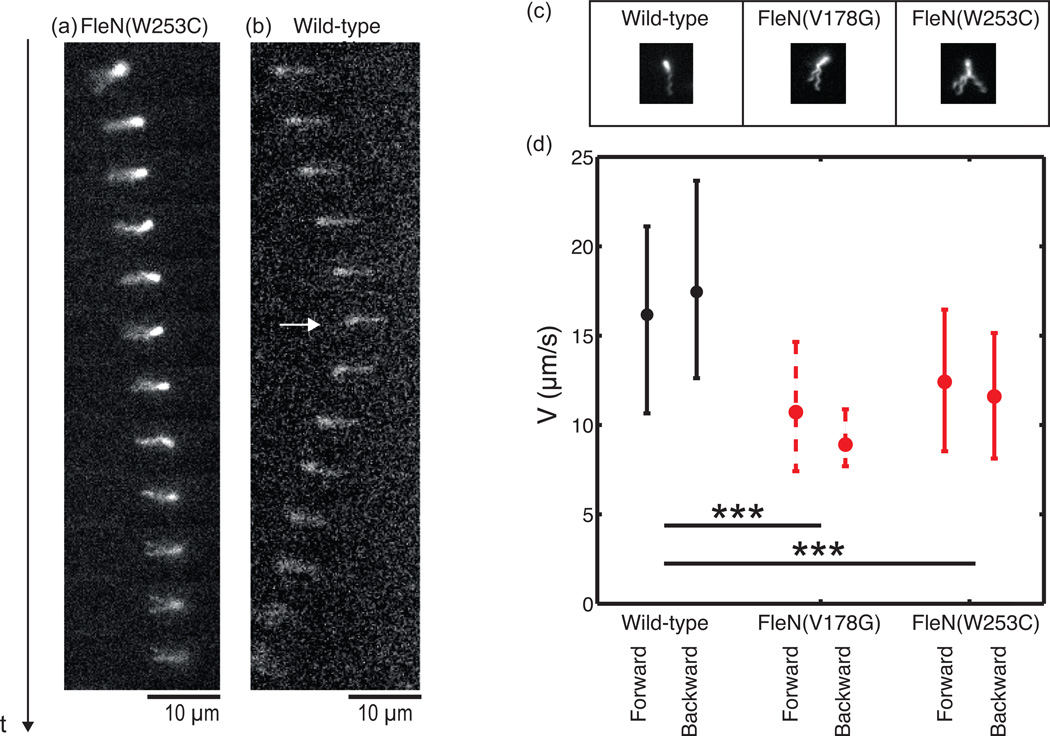
We first observed wild-type swimming patterns. The time-lapse videos confirmed that bacteria can swim both backwards and forwards2, i.e. with their single flagellum ahead or behind according to the direction of movement. The movement is always along the long axis of the rod-shaped bacterium. In some instances the time-lapse captured a cell reversing the direction of movement (Fig. 4B), which it presumably does by changing the rotation of the flagellum18.
Figure 4.
Temporal sequence of swimming of fluorescently labeled P. aeruginosa (Δt = 60ms) showing (a) a hyperswarmer forward run with two spatially separate flagella, (b) a wild-type backward-to-forward run (white arrow indicates the turning time) (c) flagellar organization of wild-type and the two hyperswarmer clones (pictures are taken when bacteria are attached to glass, to enhance image quality). (d) There is no significant difference in speed between forward and backward runs for any strain, but hyperswarmers swim significantly slower than wild-type (p<0.001 by Kruskal-Wallis test). Dots represents median values of velocities and lower and upper bound represent respectively 25% and 75% percentile of velocities distributions.
We selected hyperswarmer mutants from our previous study with two distinct FleN mutations (FleN(V18G) and FleN(W253C)), conferring on average 1.5 or 3 flagella per cell, respectively14 (Fig 1E and 4C). Hyperswarmers apparently swim regularly, although the flagellar configuration varies from cell to cell. A fraction of the hyperswarmers shows a tidy flagellar arrangement that is indistinguishable from wild-type. These cells could be part of the small fraction of the population that has a single flagellum, which is expected due to large variability in the number of flagella in these mutants14. Alternatively, these cells could have multiple flagella that form a bundle, as happens in E. coli swimming runs. Nonetheless, the majority of the hyperswarmer cells display multiple flagella that are not in a bundle and therefore are clearly visible (Fig 4C). Even when the flagella do not bundle, the bacteria are still capable of swimming (Fig. 4A).
We tracked the cells in 2D and quantified the average running speed both in forward and backward runs (Fig. 4D). In all three strains there is no significant difference between forward and backward speeds. Even though the sample number is relatively small (427, 65 and 219 respectively, with around 80% running forward and 20% running backward) the comparison suggests that hyperswarmers swim slower, rather than faster, than wild-type (Fig. 4D).
High throughput imaging of swimming trajectories in pseudo 3D
Our observations from fluorescent labeled-bacteria and their flagella suggest differences in the swimming patterns of wild-type and hyperswarmers, but the statistics are not sufficient to inform on how bacteria change swimming direction. We therefore opted to track swimming unlabeled bacteria using phase contrast microscopy at lower magnification. Tracking unlabeled bacteria has the disadvantage that the flagella are no longer visible and, therefore, the swimming orientation may not be determined. However, this type of imaging presents several advantages. First, lower magnification allows a wider field of view and therefore much higher throughput to quantify their turning behaviors. Second, data can be obtained for longer periods as the illumination is not nearly as damaging to the cells as exposing the cells to an Hg lamp for fluorescence microscopy. Third, phase contrast microscopy allows estimating the position of bacteria in the third dimension: when the bacteria are exactly in the focal plane they are seen in black. Bacteria not directly in the focal plane, but close enough to remain visible, become blurry and have a characteristic gray value profile that can be used to estimate their vertical location (Fig. S1A–C). We constructed a calibration curve of gray values as a function of the distance to the focal plane using immobilized bacteria. Then we applied this calibration to estimate the distance to the focal plane for swimming bacteria. With the reasonable assumption that bacteria do not reverse direction when crossing at the focal plane, it is possible to transform 2D trajectories into pseudo 3D (Fig. S1D inset). As expected, cell speed computed using pseudo 3D is measurably higher than the speed computed from 2D data alone (Fig. S1D).
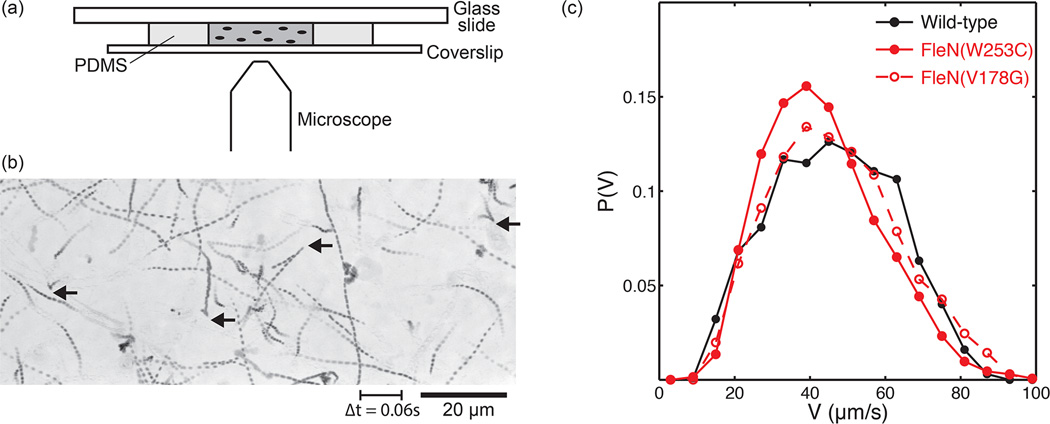
The swimming speeds of wild-type P. aeruginosa and the hyperswarming mutants quantified using this method show a large variance (Fig. 5). Wild-type has a median speed of 46.2 µm/s, but the fastest run recorded was faster than 90 µm/s. The FleN(V178G) hyperswarmer had a median speed of 45.3 µm/s whereas mutant FleN(W253C), which has more flagella, had a slower mean speed of 41.8 µm/s. It should be noted that the speeds measured by the pseudo 3D method were approximately twice as high as the speeds measured with a 2D method when the bacteria and their flagella were fluorescently labeled (Fig. 3C) and the mismatch cannot be explained from a simple conversion of 2D to 3D. The difference is most likely caused either by damage due to the excitation wavelength used in fluorescence imaging or by the labeling procedure itself, which involves binding of large quantities of Alexa molecules to the cell wall and flagella. Nonetheless, both the fluorescence data and the pseudo 3D data agree that hyperswarmers do not swim faster than wild-type in bulk liquid. The recorded mean speed for both hyperswarmers is actually slower than wild-type, although only the mutant with higher flagella number, FleN(W253C), is sufficiently different to pass a Kruskall-Wallis statistical significance test (p<0.001). Altogether, the typical single-cell swimming speed is two orders of magnitude larger (50 µm/s, ~ 180 mm/h) than swarming speed (3 mm/h) or the speed of swimming through agar (1 mm/h).
Figure 5.
Swimming of P. aeruginosa in phase contrast microscopy: (a) Diagram of PDMS microchamber used for imaging. (b) Minimum intensity temporal projection image reveals individual trajectories, made of nearly straight runs and sharp turns (indicated with black arrows). (c) Speed distributions show that wild-type swims slightly faster than the two hyperswarmers.
Bacteria of other species are known to differentiate when swarming on agar19–21. Evidence of cellular differentiation in P. aeruginosa swarming is less clear, although there are differences in gene expression22. Therefore, it is relevant to confirm whether the previous results are still valid using cells harvested from swarms rather than cells taken from overnight shaken cultures. We collected cells from two locations: at the edge of the swarm, and at a distance of 3 mm from the edge. Cells were then diluted in 1× PBS and immediately used in tracking experiments. Wild-type cells were found to swim faster (39.7 µm/s at the edge) than hyperswarmers (30.3 µm/s at the edge for FleN(V178G), p<0.001 by Kruskal-Wallis test, Fig. S2). However, no difference of velocities could be detected between cells from the edge and cells further in the swarm, for both hyperswarmers and wild-type. During these observations, no significant difference of cell size or swimming pattern was noticed between cells collected at the edge and cells collected deeper in the swarm. These observations confirm that hyperswarmer cells do not swim faster than wild-type cells in liquid, even when cells are harvested directly from swarming colonies.
Hyperswarmers have distinct swimming patterns
The visual inspection of a large number of swimming trajectories suggested the following model of swimming behavior: wild-type makes long swim runs that end in a sharp turn. Each run is followed by another run in the opposite direction and is likely caused by a reversal of the rotation of the single polar flagellum. There seems to be no obvious qualitative difference between alternating runs. Hyperswarmers also swim in long runs and execute sharp turns between runs. However, the turning angles seem much wider than those in wild-type. Also, it is much more common to observe hyperswarmers changing running speed after a turn in swimming direction.
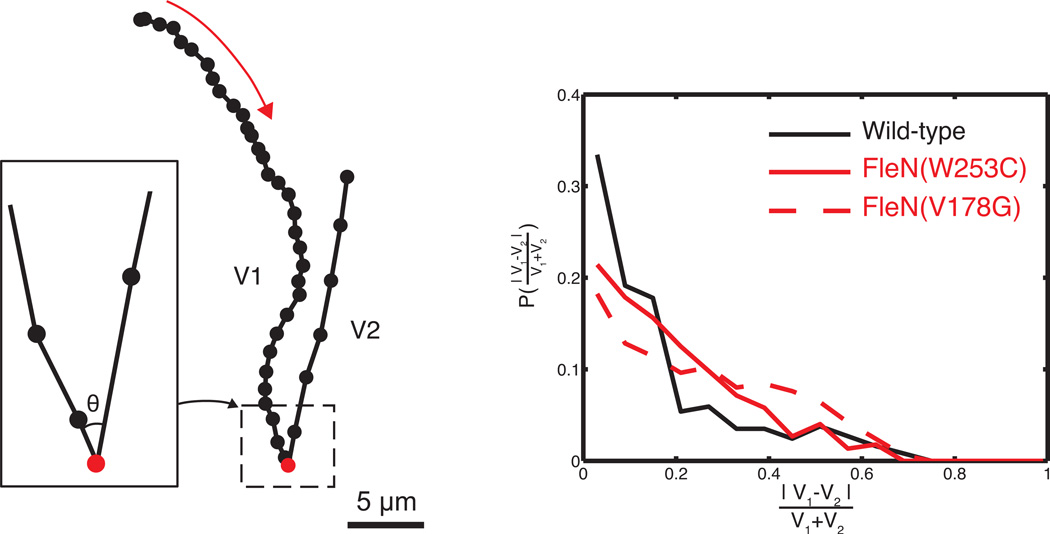
In order to quantify these visual observations, we computed the change in speed following a reversal in swimming direction (Fig. S3). We detected “turns” by identifying consecutive movement vectors separated by a very sharp angle (< 90°, Fig 6A). Using trajectories that have only a single “turn”, i.e. trajectories that include samples from two consecutive runs (two segments) we calculated the average speed of each segment, V1 and V2, and used those values to calculate the relative difference between consecutive runs, |V1-V2|/(V1+V2). The change in speed quantified using this method showed a significant difference between wild-type and hyperswarmers (Fig. 6B). All three strains had a high frequency of trajectories where the average speed before and after the turn was very similar (|V1-V2|/(V1+V2)≈0). The frequency of turns with significant changes in speed drops sharply for the wild-type, meaning that bacteria continue with the same speed. In contrast, hyperswarming mutants showed large differences in the speed of consecutive runs at a much higher frequency (p<0.001 by Kruskal-Wallis test; for runs differing >20%).
Figure 6.
(a) When one turn is detected (θ < π/2) trajectories are split in two separate runs, whose mean speeds are V1 and V2. The red arrow describes the direction of swimming. (b) The distribution of the normalized difference between V1 and V2 show that consecutive run speeds are more consistent for wild-type than for hyperswarmers.
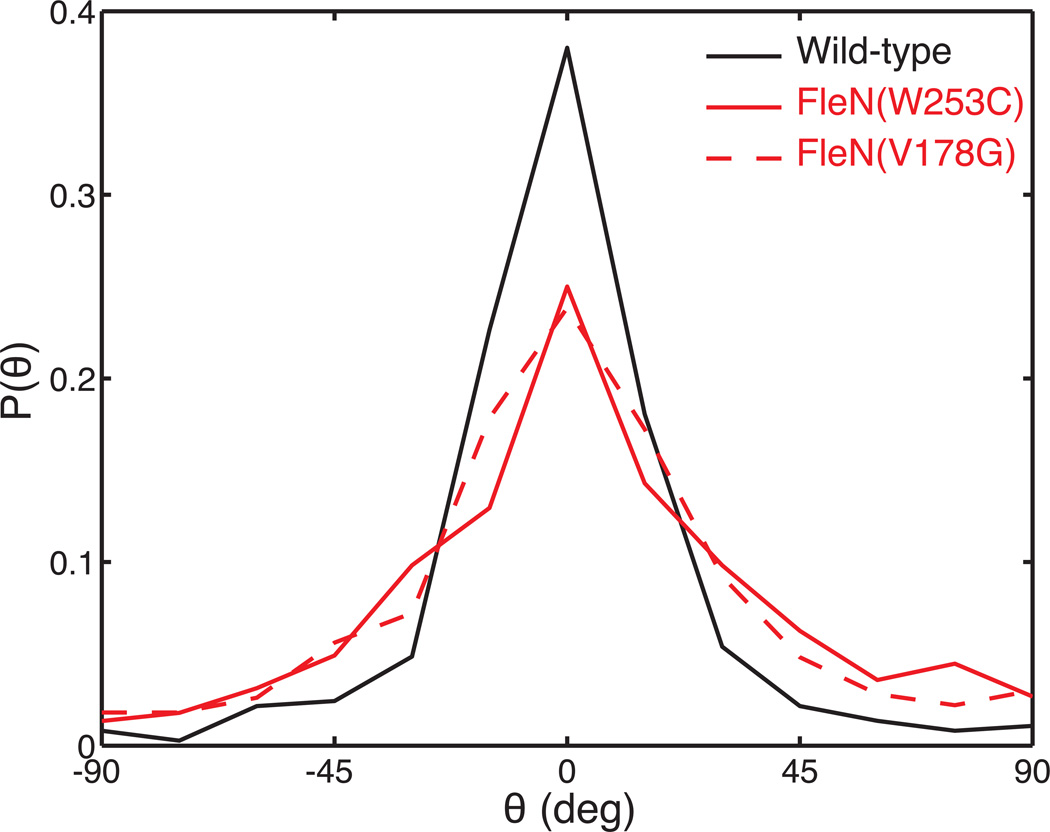
Next, we quantified the distribution of turning angles. For this, we defined the direction of rotation as positive when bacteria turn counterclockwise in the images. This quantification revealed another significant difference in swimming patterns: while turns tended to be very sharp (Θ≈0), hyperswarmers show a wider distribution in turning angle than wild-type (p<0.001 by Kruskal-Wallis test on the absolute values of turning angles). About 5% of the turns have an angle wider than 45° (Fig. 7).
Figure 7.
Angular distribution of turns. Turns are sharper for wild-type than for the hyperswarmers.
Hyperswarmers diffuse faster through agar
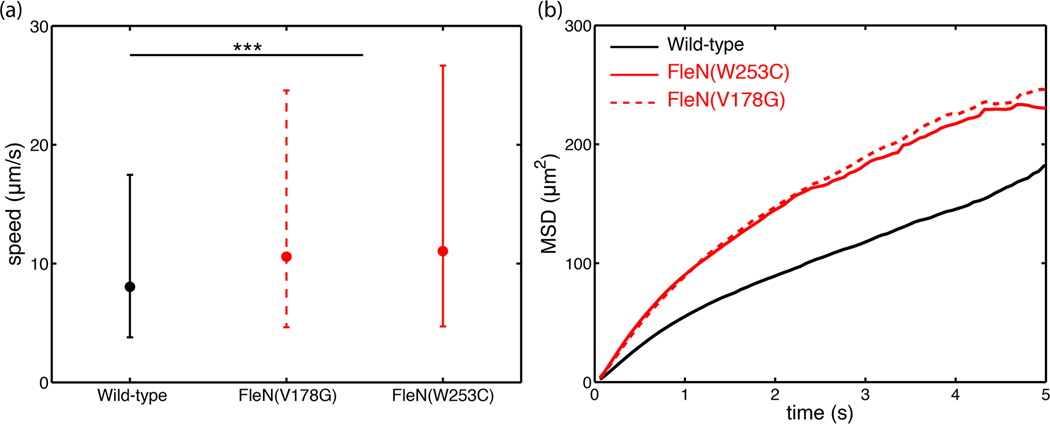
To understand how the single-cell swimming patterns in liquid translate into bacterial spreading in a structured environment, we observed P. aeruginosa swimming through 0.3% (w/v) agar at the single-cell level. The trajectories of both wild type and hyperswarmers are similar to their trajectories in liquid, consisting of run and turns. Using automatic cell tracking, we could quantify the displacements and velocities. It should be noted that pseudo-3D tracking could not be performed in these conditions because of the poorer imaging quality through agar. Measured velocities are therefore only 2D velocities. Nonetheless, in this structured environment, hyperswarmers swim significantly faster (median speed 10.6 µm/h for mutation FleN(V178G) and 11.0 µm/h for mutation FleN(W253C), Fig 8a) than the wild-type (median speed 8.6 µm/h, p<0.001 by Kruskal-Wallis test). Hyperswarmer populations also spread faster, as shown by a higher diffusion coefficient extracted from mean-squared-displacement curves (D=29.8 µm2/s for wild-type, D=44.8 µm2/s for mutation FleN(V178G), D=41.6 µm2/s for mutation FleN(W253C), Fig 8b).
Figure 8.
(a) Hyperswarmers swim faster than wild-type through 0.3% (w/v) agar. Dots denote median velocities. Lower and upper bound represent respectively 25% and 75% percentile of velocities distributions. (b) Mean-squared-displacement P. aeruginosa when swimming through soft agar.
Modeling run-and-turn swimming explains the advantage of multiple flagella in spreading
We showed previously that hyperswarmers tend to change directions with a wider angle than wild-type, when swimming in liquid. Here, a simple model is proposed to show the importance of the turning angle distribution. We started from a simplified wormlike-chain model23, but with a change of direction after each run (Fig. S4a). At each time step, a cell runs over a distance L, with a velocity V. After this run, the cell reverses its running direction, but with a turning angle theta θ. The distribution of turning angle is peaked at π and is assumed to be normal for simplicity with a standard deviation σ (Fig. S4b). With these hypotheses, the average squared distance from the origin after n steps is
| [1] |
(for large n)23, where γ = <cos(θ)>. If σ=0, then γ =−1 and D=0. If σ is high, then the distribution is flat, γ=0, and E[R2]= Ln1/2. This model shows how the distribution of turning angle can change the spreading dynamics (Fig. S4c). Using equation 1, we are able to infer γ from the experimental swimming velocities and diffusion coefficients. We estimate L = 10 µm from trajectories (Fig. S5), which we assume to be constant over strains because this is a property of the environment, and n=t/τ (with τ=L/V). Then γ=−0.40 (σ=1.35) for FleN(V178G), γ=−0.45 (σ=1.26) for FleN(W253C), and γ =−0.48 (σ=1.21) for wild-type. It should be noted that those values of γ do not allow comparing the model with the actual macroscopic spreading speed for three reasons. First, the spreading is linear in time, whereas the model predicts that the size of the colony goes with t1/2. Second, the actual distribution of distance exceeds the one predicted by previous equation, as shown by 99% percentile distance obtained by simulation (Fig. S4d). Third, several aspects of bacterial migration are not considered, such as cellular growth, chemotaxis, wide distribution of velocities, and wide distribution of run lengths. Nonetheless, the model supports that wider turning angle distributions can lead to a faster population spreading in such a structured environment.
Conclusion
How behaviors of dense groups can be extrapolated from the traits of individuals is a central problem in biology. A vast literature on collective behavior in animal groups such as flocks of bird (e.g. Cavagna24) and schools of fish (e.g. Berdahl25) supports that many group properties emerge from close interactions between individuals. Interactions between cells are also key in collective migratory patterns in cell biology26, 27 and may help explain cancer invasiveness28 and tissue development29. Interactions between cells can be mechanical but also chemical, through the release and detection of diffusible chemical substances that can travel relatively large distances30, 31. Swarming in P. aeruginosa is a model system that allows tackling this problem from a quantitative perspective. In spite of its simplicity, P. aeruginosa shares important features of multicellular organisms such as cell-to-cell communication32 and the sharing of secreted products33, 34 which also act as long range morphogenic cell-cell modulators7. These important features are combined with the simplicity of a bacterial model, such as short generation times and large populations numbers.
Here, we contrasted single-cell swimming behavior of P. aeruginosa to its motility at the collective level. We observed that wild-type P. aeruginosa cells swim in a back-and-forth pattern in liquid. These swimming patterns are consistent with recent rotational measurements from tethered P. aeruginosa18 and swimming patterns measured in Pseudomonas fluorescens35, a non-pathogenic relative of P. aeruginosa. We also measured the single-cell swimming patterns of hyperswarmer mutants that we recently obtained by experimental evolution14 but saw no evidence of faster motility in liquid. Our observations, therefore, raise the question of how investigating swimming in liquid can help in understanding densely packed, surface-associated communities.
Measurements of change in speed after a turn and turning angles reveal that hyperswarmers do have differences in swimming behaviors in liquid compared to wild-type. The swimming behavior of hyperswarmers seems at odds with their advantage in swarming colonies since (1) their median swimming speed is not faster, (2) they tend to change speed more frequently after a sharp turn and (3) the turns tend to be wider than those of the wild-type. Extracted from swarms and diluted to liquid phase, hyperswarmers swim even slower than wild-type. Nonetheless, hyperswarmers do outperform wild-type P. aeruginosa in swarming competitions and they also do better in the traditional swimming assay. In a swarming colony, bacteria are closely packed and their displacement may involve long-range correlation and collective flow. Thus swarming is radically different from single-cell swimming motility.
The implications of these results for our understanding of hyperswarming evolution is that hyperswarmers evolve in the lab not due to faster swimming speed but because of a specific advantage in collective motility that occurs in the setting of a swarming colony. Our results also highlight the importance of the substrate as being key to the emergence of collective migration in P. aeruginosa. Both swarming patterns and swimming through soft agar are likely highly dependent on cell–cell interactions as well as modulated by the environment. Thus, to some extent, these migratory behaviors are not cell-autonomous. Swimming through agar, as wide as the mesh may be, is significantly different from swimming in liquid. Under those conditions, having multiple flagella allows P. aeruginosa to spread more, for example by introducing wider turning angles that accelerate population diffusion through the agar medium.
Our results therefore highlight that investigating swimming in liquid media alone may provide a limited view of the rich motile behaviors of bacteria. Bacteria often do not live in low density-liquid cultures but rather in high-density communities associated with bio-gels or hard surfaces. Recent studies are going in this direction by investigating collective swimming patterns in high density populations36, motility through mucin biogels37, 38 and in partially saturated porous materials that mimic soil39.
Experimental Methods
Bacterial strains
All of the strains used in this study were based on the laboratory strain Pseudomonas aeruginosa PA14. The non-motile strain is isogenic to PA14, except for a clean deletion of flgK (encoding the flagellar hook protein FlgK; ∆flgK40). The two hyperswarmer strains used in this study have two different FleN mutations. Both came from the experimental evolution14. The first FleN(V178G) was denominated as clone 4 in that study and the second FleN(W253C) was denominated as clone 10. Bacterial cells were routinely grown in LB Miller at 37°C with aeration.
Bacterial assays
Swarming assays are performed in standard conditions using 0.5% (w/v) agar33. Briefly: an overnight culture of bacteria is washed twice in 1× PBS and 2 µL of the washed suspension is used to inoculate a swarming plate in the center. The plates are then flipped and imaged for 24h at 37°C. Swimming assays were performed with slight adaptations to standard protocol in 0.3% (w/v) agar plates40. Cells from overnight cultures were washed twice in 1× PBS before normalizing their density to 1 OD600. A pipet tip was then dipped into the washed suspension and used to point inoculate a swimming plate, then flipped and imaged for 16h at 37°C.
Microscopy and cell tracking
A PDMS layer is first made using Sylgard mix, laid between two Plexiglas sheets spaced by 400 µm PET spacer, and cured overnight at 65°C. A 1 cm × 1 cm square of PDMS is cut from this layer, and then punched using a 5-mm diameter punch tool. The PDMS square is then laid on a glass slide. A drop of 30 µL of a bacterial suspension is deposited in the round chamber, then covered by a coverslip. As glass is more hydrophobic than PDMS, the excess of water from drop is pushed out of the PDMS-coverslip slit, removing any remaining layer of water. The fluid is enclosed in this microchamber and the chamber shows only very limited internal flow. As bacterial swimming is disturbed when near a solid surface41, observations were performed in the middle of the chamber (200 µm from any boundary).
Cells from the exponential growth phase in LB Miller are diluted to 0.005 OD600 in 1× PBS without centrifugation, as centrifugation can be harmful to flagella42. Cells are then gently incubated at 37°C on a rotary shaker for one hour. Finally, the cell solution is enclosed in the microchamber, and immediately imaged. Fluorescence imaging is carried out using an Axiovert 200M inverted microscope (Zeiss) equipped with a CoolSNAP ES CCD Camera (Photometrics) and Hg lamp, with a ×40 and a ×63 lens at 16.6 fps (acquisition time = 10 ms) during 12 seconds. The ×63 lens is used for high-resolution imaging (Fig. 2). Phase contrast imaging was carried out using a Zeiss video-microscope, with ×10 phase contrast lens, with Orca2-ER CCD camera (Hamamatsu), at 16 fps (acquisition time = 2 ms) during 20 seconds. A few hundred trajectories are recorded per video. A few tens of videos are shot for each strain.
Flagellar staining
Flagellar staining is adapted from Darnton43: cells in exponential phase are gently washed three times in 1× PBS (350 rcf for 10 min). The final pellet is adjusted to a volume of 0.5 mL of 1× PBS (~1 OD600). 10 µL of a solution of Alexa Fluor 488 carboxylic acid, succinimidyl ester (Molecular Probes) (10 mg/mL in dimethyl sulfoxide (DMSO)) are added, and the cells are labeled for 90 min at room temperature. Excess dye is removed by washing three times in 1× PBS. The labeled cells are diluted to 0.1 OD600 for observation.
Conversion of 2D tracks into 3D
Trajectories are extracted from images using Matlab and the Crocker algorithm44. Bacteria are first tracked in two dimensions only. In phase contrast imaging, bacteria appear as black spots when in focus, and as white spots when out of focus. The background appears as a grey field. Using an "altitude versus grayvalue" calibration curve, the third dimension coordinate is added to bacterial locations. As grayvalue gives only absolute value of distance to focal plane, trajectories are considered to cross this focal plane only once: thus absolute altitude can be converted to relative altitude, then to a vertical component of speed.
Determination of turning angles
Turning events are first automatically detected using a π/2 threshold for the angle between all consecutive velocity vectors of each trajectory. A second sorting was carried out manually to keep only trajectories where turning points split trajectories in two clear runs. Solely trajectories with one single turn and two runs were considered in the analysis. For the sake of precision, turning angles are not measured between consecutive frames but between three frames (Δt=0.18 seconds) on either side.
Swarming speed measurement
Swarming was quantified by tracking the edge of binary images obtained from direct thresholding. Tips or protrusions are first detected using distance transform (function bwdist in Matlab) of the binary image, then tracked using Crocker algorithm44.
Supplementary Material
Acknowledgments
This work was supported by the Office Of The Director, National Institutes Of Health of the National Institutes of Health under Award Number DP2OD008440 to JBX. CCF is supported by Integrated Cancer Biology Program under grant U54 CA14896704 grant as an independent fellow of the Computational Biology Center at Memorial Sloan-Kettering.
References
- 1.Chevance FF, Hughes KT. Nature reviews. Microbiology. 2008;6:455–465. doi: 10.1038/nrmicro1887. [DOI] [PMC free article] [PubMed] [Google Scholar]
- 2.Armitage JP, Evans MC. FEBS letters. 1983;156:113–118. doi: 10.1016/0014-5793(83)80259-2. [DOI] [PubMed] [Google Scholar]
- 3.Kohler T, Curty LK, Barja F, van Delden C, Pechere JC. Journal of bacteriology. 2000;182:5990–5996. doi: 10.1128/jb.182.21.5990-5996.2000. [DOI] [PMC free article] [PubMed] [Google Scholar]
- 4.Rashid MH, Kornberg A. Proceedings of the National Academy of Sciences of the United States of America. 2000;97:4885–4890. doi: 10.1073/pnas.060030097. [DOI] [PMC free article] [PubMed] [Google Scholar]
- 5.Deziel E, Lepine F, Milot S, Villemur R. Microbiology (Reading, England) 2003;149:2005–2013. doi: 10.1099/mic.0.26154-0. [DOI] [PubMed] [Google Scholar]
- 6.Caiazza NC, Shanks RM, O'Toole GA. Journal of bacteriology. 2005;187:7351–7361. doi: 10.1128/JB.187.21.7351-7361.2005. [DOI] [PMC free article] [PubMed] [Google Scholar]
- 7.Tremblay J, Richardson AP, Lepine F, Deziel E. Environmental microbiology. 2007;9:2622–2630. doi: 10.1111/j.1462-2920.2007.01396.x. [DOI] [PubMed] [Google Scholar]
- 8.Du H, Xu Z, Shrout JD, Alber M. Mathematical models & methods in applied sciences : M3AS. 2011;21(Suppl 1):939–954. doi: 10.1142/S0218202511005428. [DOI] [PMC free article] [PubMed] [Google Scholar]
- 9.Kamatkar NG, Sarna MJ, Shrout JD. Communicative & integrative biology. 2011;4:689–691. doi: 10.4161/cib.17109. [DOI] [PMC free article] [PubMed] [Google Scholar]
- 10.Kamatkar NG, Shrout JD. PloS one. 2011;6:e20888. doi: 10.1371/journal.pone.0020888. [DOI] [PMC free article] [PubMed] [Google Scholar]
- 11.Morris JD, Hewitt JL, Wolfe LG, Kamatkar NG, Chapman SM, Diener JM, Courtney AJ, Leevy WM, Shrout JD. Applied and environmental microbiology. 2011;77:8310–8317. doi: 10.1128/AEM.06644-11. [DOI] [PMC free article] [PubMed] [Google Scholar]
- 12.Kearns DB. Nature reviews. Microbiology. 2010;8:634–644. doi: 10.1038/nrmicro2405. [DOI] [PMC free article] [PubMed] [Google Scholar]
- 13.Kearns DB. Trends in microbiology. 2013;21:508–509. doi: 10.1016/j.tim.2013.08.003. [DOI] [PubMed] [Google Scholar]
- 14.van Ditmarsch D, Boyle KE, Sakhtah H, Oyler JE, Nadell CD, Deziel E, Dietrich LE, Xavier JB. Cell Rep. 2013;4:697–708. doi: 10.1016/j.celrep.2013.07.026. [DOI] [PMC free article] [PubMed] [Google Scholar]
- 15.Dasgupta N, Arora SK, Ramphal R. Journal of bacteriology. 2000;182:357–364. doi: 10.1128/jb.182.2.357-364.2000. [DOI] [PMC free article] [PubMed] [Google Scholar]
- 16.Turner L, Ryu WS, Berg HC. Journal of bacteriology. 2000;182:2793–2801. doi: 10.1128/jb.182.10.2793-2801.2000. [DOI] [PMC free article] [PubMed] [Google Scholar]
- 17.Wilson DR, Beveridge TJ. Canadian journal of microbiology. 1993;39:451–472. doi: 10.1139/m93-066. [DOI] [PubMed] [Google Scholar]
- 18.Qian C, Wong CC, Swarup S, Chiam K-H. Applied and environmental microbiology. 2013 doi: 10.1128/AEM.01027-13. [DOI] [PMC free article] [PubMed] [Google Scholar]
- 19.Kim W, Surette MG. Molecular microbiology. 2004;54:702–714. doi: 10.1111/j.1365-2958.2004.04295.x. [DOI] [PubMed] [Google Scholar]
- 20.Tuson HH, Copeland MF, Carey S, Sacotte R, Weibel DB. Journal of bacteriology. 2013;195:368–377. doi: 10.1128/JB.01537-12. [DOI] [PMC free article] [PubMed] [Google Scholar]
- 21.Darnton NC, Turner L, Rojevsky S, Berg HC. Biophysical journal. 2010;98:2082–2090. doi: 10.1016/j.bpj.2010.01.053. [DOI] [PMC free article] [PubMed] [Google Scholar]
- 22.Tremblay J, Deziel E. BMC genomics. 2010;11:587. doi: 10.1186/1471-2164-11-587. [DOI] [PMC free article] [PubMed] [Google Scholar]
- 23.Wu H-I, Li B-L, Springer TA, Neill WH. Ecological Modelling. 2000;132:115–124. [Google Scholar]
- 24.Cavagna A, Cimarelli A, Giardina I, Parisi G, Santagati R, Stefanini F, Viale M. Proceedings of the National Academy of Sciences of the United States of America. 2010;107:11865–11870. doi: 10.1073/pnas.1005766107. [DOI] [PMC free article] [PubMed] [Google Scholar]
- 25.Berdahl A, Torney CJ, Ioannou CC, Faria JJ, Couzin ID. Science (New York, N.Y.) 2013;339:574–576. doi: 10.1126/science.1225883. [DOI] [PubMed] [Google Scholar]
- 26.Coburn L, Cerone L, Torney C, Couzin ID, Neufeld Z. Physical biology. 2013;10 doi: 10.1088/1478-3975/10/4/046002. 046002. [DOI] [PubMed] [Google Scholar]
- 27.Deforet M, Parrini MC, Petitjean L, Biondini M, Buguin A, Camonis J, Silberzan P. Nature methods. 2012;9:1081–1083. doi: 10.1038/nmeth.2209. [DOI] [PubMed] [Google Scholar]
- 28.Chang WK, Carmona-Fontaine C, Xavier JB. Interface Focus. 2013;3 doi: 10.1098/rsfs.2013.0017. [DOI] [PMC free article] [PubMed] [Google Scholar]
- 29.Carmona-Fontaine C, Matthews HK, Kuriyama S, Moreno M, Dunn GA, Parsons M, Stern CD, Mayor R. Nature. 2008;456:957–961. doi: 10.1038/nature07441. [DOI] [PMC free article] [PubMed] [Google Scholar]
- 30.Mori H, Gjorevski N, Inman JL, Bissell MJ, Nelson CM. Proceedings of the National Academy of Sciences of the United States of America. 2009;106:14890–14895. doi: 10.1073/pnas.0901269106. [DOI] [PMC free article] [PubMed] [Google Scholar]
- 31.Nelson CM, Vanduijn MM, Inman JL, Fletcher DA, Bissell MJ. Science (New York, N.Y.) 2006;314:298–300. doi: 10.1126/science.1131000. [DOI] [PMC free article] [PubMed] [Google Scholar]
- 32.Waters CM, Bassler BL. Annual review of cell and developmental biology. 2005;21:319–346. doi: 10.1146/annurev.cellbio.21.012704.131001. [DOI] [PubMed] [Google Scholar]
- 33.Xavier JB, Kim W, Foster KR. Molecular microbiology. 2011;79:166–179. doi: 10.1111/j.1365-2958.2010.07436.x. [DOI] [PMC free article] [PubMed] [Google Scholar]
- 34.de Vargas Roditi L, Boyle KE, Xavier JB. Mol Syst Biol. 2013;9:684. doi: 10.1038/msb.2013.42. [DOI] [PMC free article] [PubMed] [Google Scholar]
- 35.Ping L, Birkenbeil J, Monajembashi S. FEMS microbiology ecology. 2013;86:36–44. doi: 10.1111/1574-6941.12076. [DOI] [PubMed] [Google Scholar]
- 36.Saragosti J, Calvez V, Bournaveas N, Perthame B, Buguin A, Silberzan P. Proceedings of the National Academy of Sciences of the United States of America. 2011;108:16235–16240. doi: 10.1073/pnas.1101996108. [DOI] [PMC free article] [PubMed] [Google Scholar]
- 37.Yeung AT, Parayno A, Hancock RE. mBio. 2012;3 doi: 10.1128/mBio.00073-12. [DOI] [PMC free article] [PubMed] [Google Scholar]
- 38.Caldara M, Friedlander RS, Kavanaugh NL, Aizenberg J, Foster KR, Ribbeck K. Current biology : CB. 2012;22:2325–2330. doi: 10.1016/j.cub.2012.10.028. [DOI] [PMC free article] [PubMed] [Google Scholar]
- 39.Dechesne A, Wang G, Gulez G, Or D, Smets BF. Proceedings of the National Academy of Sciences of the United States of America. 2010;107:14369–14372. doi: 10.1073/pnas.1008392107. [DOI] [PMC free article] [PubMed] [Google Scholar]
- 40.O'Toole GA, Kolter R. Molecular microbiology. 1998;30:295–304. doi: 10.1046/j.1365-2958.1998.01062.x. [DOI] [PubMed] [Google Scholar]
- 41.Goto T, Nakata K, Baba K, Nishimura M, Magariyama Y. Biophysical journal. 2005;89:3771–3779. doi: 10.1529/biophysj.105.067553. [DOI] [PMC free article] [PubMed] [Google Scholar]
- 42.Lecuyer S, Rusconi R, Shen Y, Forsyth A, Vlamakis H, Kolter R, Stone HA. Biophysical journal. 2011;100:341–350. doi: 10.1016/j.bpj.2010.11.078. [DOI] [PMC free article] [PubMed] [Google Scholar]
- 43.Darnton NC, Turner L, Rojevsky S, Berg HC. Journal of bacteriology. 2007;189:1756–1764. doi: 10.1128/JB.01501-06. [DOI] [PMC free article] [PubMed] [Google Scholar]
- 44.Crocker JC, Grier DG. Journal of Colloid and Interface Science. 1996;179:298–310. [Google Scholar]
Associated Data
This section collects any data citations, data availability statements, or supplementary materials included in this article.


