Abstract
Microtubules (MTs) are nanometer scale hollow cylindrical biological polyelectrolytes. They are assembled from α/β-tubulin dimers, which stack to form protofilaments (PFs) with lateral interactions between PFs resulting in the curved MT. In cells, MTs and their assemblies are critical components in a range of functions from providing tracks for the transport of cargo to forming the spindle structure during mitosis. Previous studies have shown that while cations with valence equal to or larger than 3+ tend to assemble tight 3D bundles of taxol-stabilized MTs, certain divalent cations induce relatively loose 2D bundles of different symmetry [D. J. Needleman, et al., PNAS, 2004, 101, 16099]. Similarly, divalent cations form 2D bundles of DNA adsorbed on cationic membranes [I. Koltover, et al., PNAS, 2000, 97, 14046]. The bundling behavior for these biological polyelectrolyte systems is qualitatively in agreement with current theory. Here, we present results, which show that unlike the case for DNA adsorbed on cationic membranes, bundling of taxol-stabilized MTs occurs only for certain divalent cations above a critical ion concentration (e.g. Ca2+, Sr2+, Ba2+). Instead many divalent cations preempt the bundling transition and depolymerize taxol-stabilized MTs at a lower counterion concentration. Although previous cryogenic TEM has shown that, in the absence of taxol, Ca2+ depolymerizes MTs assembling in buffers containing GTP (guanosine triphosphate), our finding is surprising given the known stabilizing effects of taxol on GDP (guanosine diphosphate)-MTs. The ion concentration required for MT depolymerization decreases with increasing atomic number for the divalents Mg2+, Mn2+, Co2+, and Zn2+. GdCl3 (3+) is found to be extremely efficient at MT depolymerization requiring about 1 mM, while oligolysine (2+), is observed not to depolymerize MTs at concentrations as high as 144 mM. The surprising MT depolymerization results are discussed in the context of divalents disrupting either lateral interactions between PFs (which are strengthened for taxol containing β-tubulin) or interfering with taxol’s ability to induce flexibility at the interface between two tubulin dimers in the same PF (which has been recently suggested as a mechanism by which taxol stabilizes MTs post-hydrolysis with the induced flexibility counteracting the kink between GDP-tubulin dimers in a PF).
1. Introduction and background
An important goal in biological physics and biomolecular materials is to understand the nature of interactions between biological molecules, which enable large-scale structures.1 For example, filamentous (F) actin may assemble with associated proteins into stress fibers, which end in focal adhesion spots enabling cell adhesion, or form dynamically active bundles inside membrane-protruding filopodia during cell crawling.2,3 One aspect of our studies is motivated by the goal of understanding the intermolecular interactions between cytoskeletal proteins of neuronal processes (axons and dendrites) leading to their distinct hierarchical structures designed for cell functions.4,5
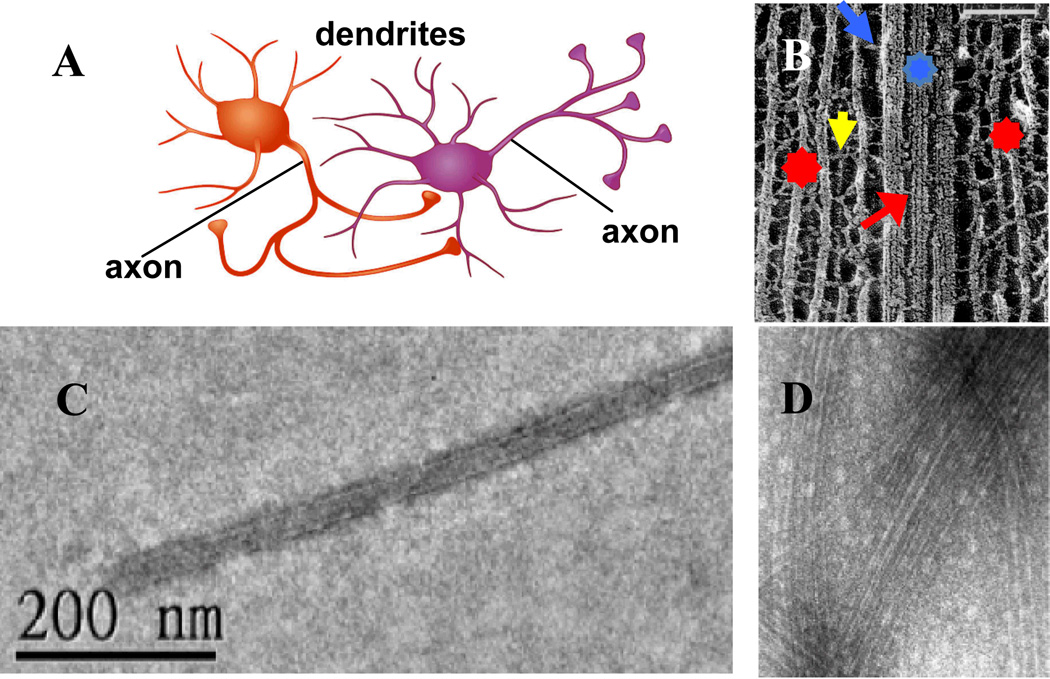
Fig. 1 (A) shows the highly polarized structure of two interacting neurons consisting of branched dendrites, the cell body, and a single long axon. Fig. 1 (B) shows an example of a cryo-electron micrograph showing a view inside the cytoskeleton of the axon of a vertebrate neuron.6 In axons, neurofilaments (NFs, the intermediate filaments of neurons) form the major cytoskeletal component and are oriented with protruding sidearms (Fig. 1 B, yellow arrow). The sidearms non-covalently cross-link the filaments, likely through electrostatic interactions,7–9 into an extended network (Fig. 1 B, red stars). Microtubules (MTs, shown schematically in Fig. 2A) are either found singly or in finite size bundles immersed within the NF-network (Fig. 1 B, blue star). The current thought is that MT bundles are stabilized by microtubule-associated-proteins (MAPs) (Fig. 1 B, red arrow), which cross-link MTs through non-specific (non-covalent) interactions dominated by electrostatics because of the polyampholyte nature of the projection domains of MAPs.3
Fig. 1.
(A) Two interacting neurons with orange neuron synapsing on the body and dendrite of purple neuron. (B) Cryo-Electron micrograph (deep-etched) of an axonal cytoskeleton in a spinal cord vertebrate neuron. In axons, neurofilaments (NFs, red stars), are the majority component and form oriented extended arrays surrounding microtubule (MT) bundles (blue star) or single MTs. Cross-bridges between NFs (NF-sidearm, yellow arrow), MTs (MAP tau, red arrow) and MT and NF-sidearms (blue arrow) are evident. In B Bar is 100 nm. (C) TEM of taxol-stabilized MT (taxol:tubulin, 1:1) coated with MAP tau (3RS isoform) showing lack of bundle formation even for a high tau/tubulin molar ratio of 0.5 (D) TEM of taxol-stabilized MT (taxol:tubulin, 1:1) coated with MAP tau (4RS isoform) showing evidence of loose bundles at a very high tau/tubulin molar ratio of 1.7. Bar in D is 100 nm. (B) Adapted from reference 6. © N. Hirokawa,1991.
Fig. 2.
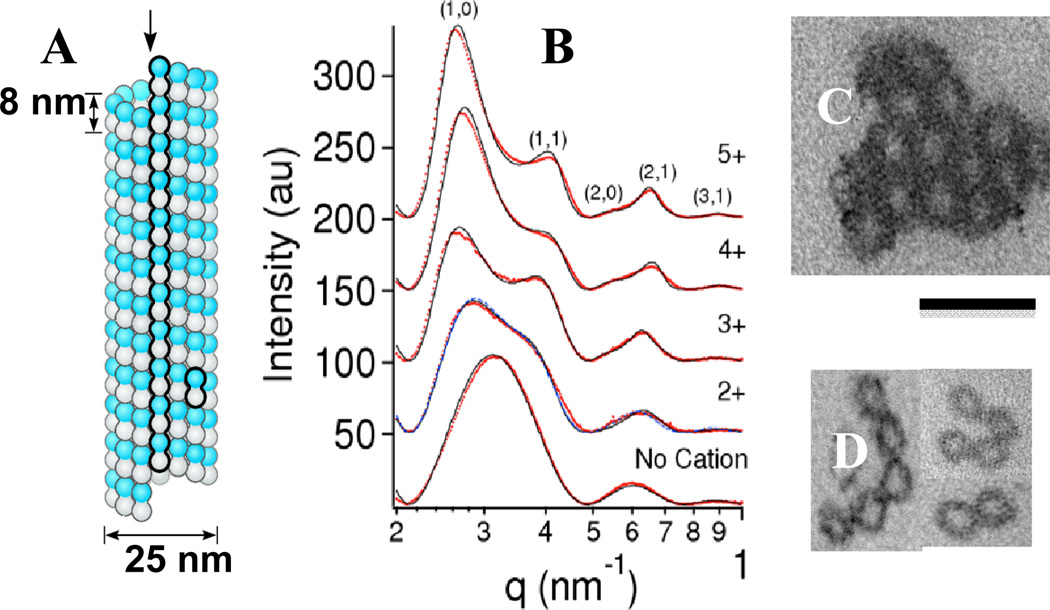
(A) schematic of a MT with a protofilament and a dimeric alpha/beta-tubulin subunit outlined (redrawn from reference 2). (B) A series of SAXS profiles for taxol-stabilized microtubules with no cation (bottom) and in the presence of 115 mM BaCl2 (2+), 15 mM spermidine (3+), 5 mM spermine (4+), and 5 mM (oligolysine)5 (5+). Without cations the profile is due to the MT form factor. The SAXS for multivalent cations equal to or larger than 3+ can be indexed on a hexagonal lattice. For divalent cations the peaks are broader indicative of shorter positional correlation lengths. Dots are data after background subtraction and solid lines are a model fit to the data (see text). (C and D) Plastic embedded TEM cross-sections of microtubule bundles. (C) 3D hexagonal microtubule bundles with 10 mM spermine 4+. (D) Microtubules with 100 mM BaCl2 show 2D bundles of MTs. Scale bar = 50 nm. B, C, and D Adapted with permission from reference 21. © 2004 National Academy of Sciences, U.S.A.
Axons are established during neuron development and maintained in mature neurons by evolving cytoskeletal structures.10 The many functions of the cytoskeleton include, the maintenance of stable MTs properly anchored within the NF network for transport of organelles (e.g. vesicles containing neurotransmitter precursors) from the cell body to the synapse for nerve cell signaling.10,11 In developing neurons, MAP tau is believed to be important in the outgrowth of axons12–16 and this outgrowth is known to involve dynamical MT bundling.10,17 In mature neurons, MT bundles are also ubiquitous; however, aside from imparting mechanical stability, their function is not understood. Thus an important question is whether MAP tau alone is able to direct bundle assembly or whether the presence of other biomolecules or the effects of cellular crowding are also needed in MT bundle formation.
Recent synchrotron small-angle-x-ray-scattering (SAXS) has shown that MAP tau does not bundle taxol-stabilized MTs for tau/tubulin ratios as large as 0.5, which is above the physiological concentrations of tau in axons.18 This is consistent with TEM images, which primarily show single MTs (with occasional occurrences of partially open curved sheets of MTs) for tau/tubulin as high as 0.5 when the MTs have been stabilized with taxol at a taxol/tubulin ratio of 1/1 (Fig. 1C). MAP tau induced bundles are indeed observed for taxol-stabilized MTs, in vitro, but only at extremely high tau/tubulin ratios of order 2 (Fig. 1D). These results are unexpected because Hirokawa’s electron microscopy (combined with immunostaining) suggests that MAP tau is involved in cross-bridging of MTs into bundles in mature axons (Fig. 1 B, red arrow).6,19 However, the cell cytoskeleton is a highly complex environment with many interacting proteins and it is important to conduct cell free experiments to understand bundling in relatively simple in vitro systems.
The observation of biological filament bundles (more than five decades ago) led Oosawa20 to his well-known model of attraction between like-charged filaments in the presence of simple counter-ions (see discussion section). Indeed, recent studies have reported on the finding that certain counter-ions modulate interactions between bare microtubules (Fig. 2).21 Experiments show that tri-, tetra-, and penta-valent cations induce the formation of hexagonal 3D bundles of MTs. Small sized divalent cations Ca2+, Ba2+ and Sr2+ were found to induce MTs to assemble into loose 2D bundles (above concentrations of 40 mM, 60 mM, and 60, mM, respectively). Fig. 2B depicts synchrotron small angle x-ray (SAXS) profiles of dilute solutions of MTs (bottom profile with no cation), and mixed in with divalent BaCl2 (Ba2+), and larger counter-ions with increasing charge, spermidine (3+), spermine (4+), and pentavalent (lysine)5 (5+), above their bundling concentrations of 60 mM, 7.5 mM, 1.5 mM, and 0.75 mM, respectively.
The SAXS data with no cation in Fig. 2B is well characterized by the form factor of a MT (solid line) consisting of a hollow cylinder with outer radius of 12.9 nm and wall thickness 4.9 nm,18,21–23 which is in agreement with measurements for MTs containing 13 protofilaments.24 In the presence of cations with valence 3+, 4+, and 5+ the SAXS data show well-defined peaks, which index perfectly onto a hexagonal bundle lattice. The data are well described by a fit to a Lorentzian-squared line-shape = a/(w2 +|q-G|2)2 for the structure factor (solid lines in Fig. 2B, 3+, 4+, and 5+ are the product of the MT form factor and the structure factor). For each sample a single width w fits all peaks simultaneously and gives an accurate estimate of the bundle linear domain size L = (23/2π1/2)/w using Warren’s approximation close to the reciprocal lattice vectors G.25 Fig. 2 (C, D) shows TEM micrographs of cross-sections of MTs bundled with spermine (4+) (Fig. 2C) and with Ba2+ (Fig. 2D) above their bundling concentrations of 1.5 mM and 60 mM respectively. The bundle cross-section in Fig. 2 (C) reveals a 3D hexagonal bundle consistent with the well-defined Bragg peaks observed in SAXS (Fig. 2B, 4+). In contrast, when MTs are bundled with divalent cations only the 2D bundle architecture is observed (Fig. 2D), which is similarly consistent with the broader peaks observed in SAXS of the corresponding system (Fig. 2B, 2+).
It is important to point out that experiments involving other biological polyelectrolytes in the presence of bundling molecules and ions also exhibit attractions and bundle formation. DNA is known to spontaneously assemble into a multilamellar complex when mixed with cationic liposomes.26 Such complexes are currently employed in gene delivery applications.27–30 These complexes are nearly ideal models of studying the behavior of DNA adsorbed onto a 2D cationic membranes and it was found that DNA undergoes a 2D bundling transition in the presence of a series of divalents in an ion specific manner where the critical concentration for bundling is observed to decrease with increasing atomic number for MgCl2, CaCl2, MnCl2, and CoCl2.31 Filamentous actin has also been shown to undergo bundling transitions both in the presence of divalent counterions32–35 and actin binding proteins.36–38
The remainder of the paper is organized as follows. The next section briefly describes the experimental procedures used in the experiments reported in this paper. The section on Results and Discussion presents original data on the effect of a broader range of counter-ions (including those of biological significance) on taxol-stabilized MTs, where in some cases, MT bundling is unexpectedly found to be preempted by the onset of MT depolymerization in an ion specific manner.
2. Experimental
2.1. Small angle x-ray scattering experiments
Small angle x-ray scattering (SAXS) was performed at the Stanford Synchrotron Radiation Laboratory (SSRL) beam-line BL 4-2. A 2D area detector (MarCCD, Mar USA) was used to collect the powder scattering patterns. Sample to detector distance was set to be 2.5 m and silver behenate was used as a standard to calibrate the wave vector q. The images were azimuthally integrated to give scattering intensity versus q. Samples were spun down at 16,000g for half an hour and loaded in 1.5 mm quartz capillaries.
2.2. Transmission electron microscopy experiments
TEM of Fig. 1D was obtained using a JEM 1230 (JEOL) electron microscope at UCSB’s imaging center with the electron beam set at 80 kV. TEM of Fig. 1C was obtained using a JEM-3011HR (JEOL) electron microscope in the National Nanofab Center (NNFC) at KAIST with the electron beam set at 300 kV. MTs (0.1 mg/ml) were loaded on formvar coated copper grid (Ted Pella), and stained with 1 wt% uranyl acetate (Electron Microscopy Sciences) in de-ionized water.
2.3. Tubulin and microtubule preparation
Tubulin was purified, as described.39 MAP-rich bovine brain MT protein was prepared by two cycles of assembly and disassembly. Tubulin was purified from other MT proteins by elution through a Whatman P-11 phosphocellulose column equilibrated in PEM50 [50 mM Pipes buffer (Pipes = 1,4-Piperazinediethanesulfonic acid, Piperazine-1,4-bis(2-ethanesulfonic acid), Piperazine-N,N′-bis(2-ethanesulfonic acid)), 1 mM MgCl2, 1 mM EGTA, 0.1 mM GTP (guanosine triphosphate)]. Purified tubulin (>99 % pure) was drop frozen in liquid nitrogen and stored at −70 °C. MTs were assembled at 35 °C for 20 min from 45 mM (5 mg/ml) tubulin in PEM50 buffer (50 mM Pipes, 1 mM EGTA, 1 mM MgCl2, pH 6.8) in the presence of 1 mM GTP and 5 wt% glycerol (with a final tubulin concentration of 39.6 mM (4.36 mg/ml)), and then stabilized by 39.6 mM taxol (2 mM taxol in DMSO was added in a stepwise manner). Tau was added to preassembled MTs at the desired tau/tubulin-dimer molar ratio. The tau-MT samples used in all experiments were prepared such that they were in buffer comprised of nearly equal volumes of PEM50 and BRB80 (80 mM Pipes pH 6.8, 1 mM EGTA, 1 mM MgSO4). A small volume of a 1M KCl in PEM50/BRB80 buffer was added to each tau-MT mixture to achieve the desired salt concentration.
2.4. Tau preparation and microtubule/tau binding assays
MAP tau was expressed and purified, as described.40 Tau was expressed in BL21 (DE3) cells (Novagen, Madison, WI). Bacteria were lysed by sonication and boiled for 10 min. Heat-stable proteins were isolated by centrifugation, bound to a phosphocellulose column and eluted with a salt gradient (0.2 – 1.0 M NaCl). Tau-containing fractions were pooled and further purified using reverse-phase HPLC (DeltaPak-C18; Millipore, Billerica, MA). HPLC fractions containing tau were pooled, lyophilized, and re-suspended in BRB80 buffer with 0.1 % β-mercaptoethanol. The concentration of each tau sample was determined by SDS-PAGE comparison with a tau mass standard, the concentration of which was established by amino acid analysis.41
Taxol stabilized MTs (prepared from 15 µM tubulin ) were mixed at varying molar ratios of tau to tubulin-dimer (Φ = Ntau/Ntubulin-dimer) layered over an 80 µL sucrose cushion (50 % sucrose in PEM50/BRB80) in 5 × 20 mm ultraclear centrifuge tubes (Beckman Instruments, Palo Alto, CA) and centrifuged in a Beckman Airfuge for 12 min at 150,000g at room temperature. Supernatants and pellets were harvested and solubilized in SDS-PAGE sample buffer. Relative amounts of tau in the supernatants and pellets were determined by SDS-PAGE and immunoblotting with the monoclonal antibody tau-1 and tubulin in the supernatants and pellets by SDS-PAGE and dye bound intensity analysis.42,43
3. Results and discussion
3.1. The onset of bundling of microtubules for certain divalent cations
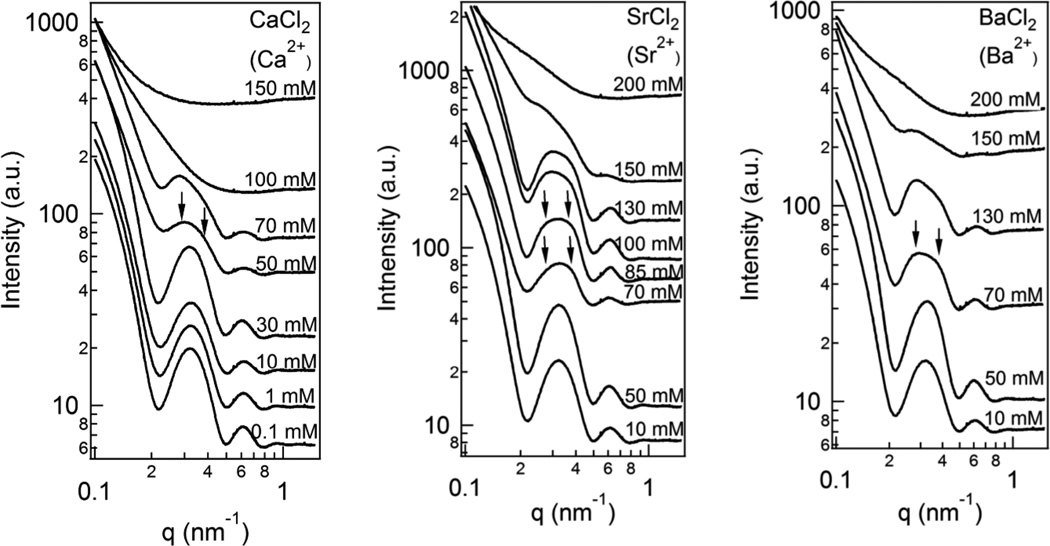
Earlier studies had shown that CaCl2, SrCl2, and BaCl2 are able to induce bundling in taxol-stabilized MTs.21 Fig. 3 shows a series of experiments with increasing concentrations of divalent cations Ca2+, Sr2+, and Ba2+ where in each system the onset of correlation peaks, indicative of MT bundling, can be clearly seen by 50 mM for CaCl2 and 70 mM for Sr2+ and Ba2+ (arrows point to the first two orders of diffraction; compare to Fig. 2B, profile for 2+). In each case the profiles with concentrations equal to or lower than 30 mM for CaCl2 and 50 mM for Sr2+ and Ba2+ only show evidence of the MT form factor where the scattering from individual MTs dominates the SAXS profiles (compare to the form factor profile in Fig. 2B labeled “no cation”).
Fig. 3.
Synchrotron SAXS profiles of taxol-stabilized microtubules (MTs) as a function of increasing divalent ion concentration for CaCl2, SrCl2, and BaCl2. The profiles are seen to transition from that due to individual MTs (i.e. the MT form factor) to one showing, above a critical concentration, clear evidence of cation induced MT bundling (arrows point to broad diffraction peaks of bundles, compare to profile for Ba2+ in Fig. 2B). (Raw data before background subtraction; Fig. 2 (B, 2+ profile for 115 mM BaCl2) shows profile after background subtraction.)
3.1.1 The role of counter-ions in modulating the interactions between MTs: Current models
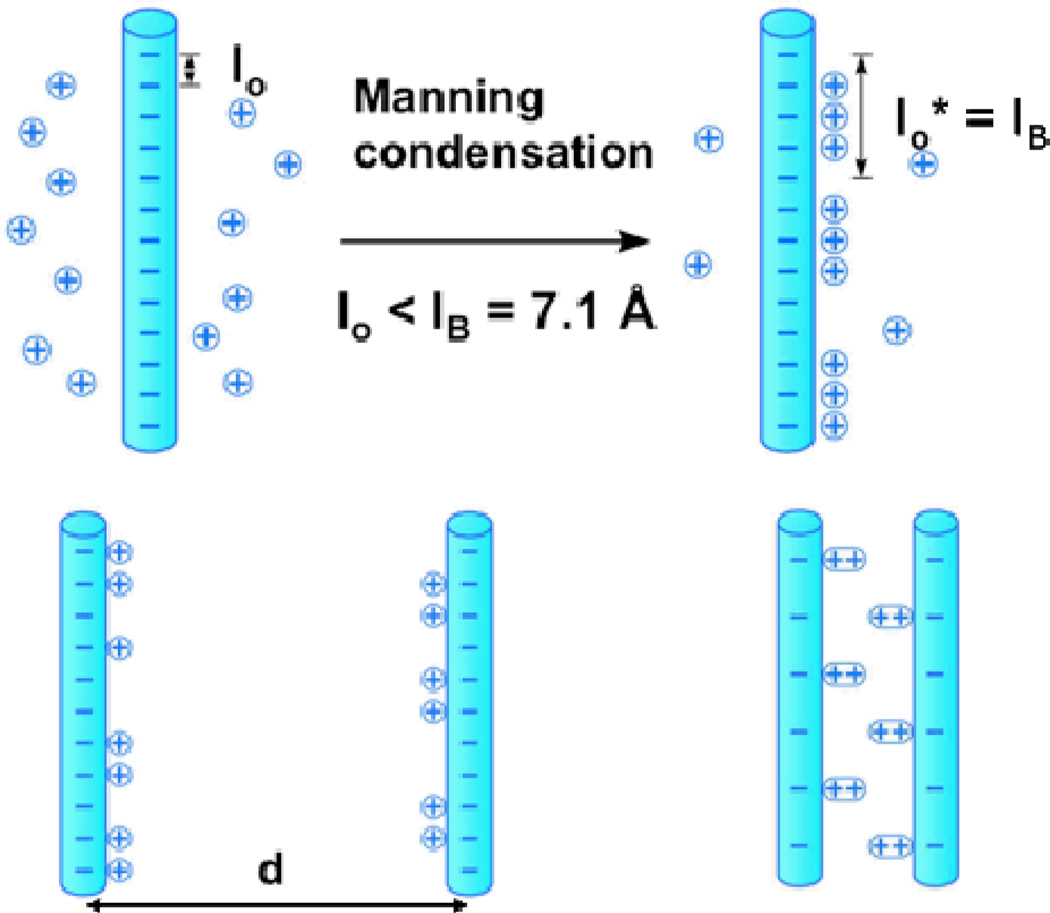
One may understand bundling of like charged polyelectrolytes in the presence of counterions as follows. Counter-ions are expected to both suppress long-range repulsions and enhance short-range attractions between similarly charged rods (such as MTs) and the magnitude of these effects is dependent on the valence of the counter-ion. To understand the effect one first considers a process known as Manning condensation, where counter-ions with valence Z become bound to the rod backbone when the Manning parameter M = ZlB/lo > 1, with lB = e2/εkBT = 7.1 Å, the Bjerrum length in water with dielectric constant ε = 80 (Fig. 4, top).44–46 For MTs, lo = 1.95 Å and M = 3.6 for Z = 1; thus, counter-ions are expected to condense on the rod. Counter-ion condensation suppresses the repulsive electrostatic interactions between the rods with increasing counter-ion valence Z by reducing the effective charge per unit length to a fraction 1/(ZM) of its bare charge per unit length.45
Fig. 4.
(Top) Cartoon of univalent counter-ion condensation on oppositely charged rods. In mixtures of univalent and multivalent counterions, the latter replace the former for a gain in entropy (i.e. one multivalent cation (with valence Z) condensing on the backbone would release Z univalent ions back in solution with about the same reduction in the electrostatic energy). (Bottom) Two models of counterion induced bundling of similarly charged polyelectrolytes. In a high temperature model (bottom, left) charge fluctuations on one rod (i.e. producing a spontaneous dipole) induce charge fluctuations in a neighboring rod (i.e. induced dipole) effectively leading to a dipole-dipole attraction. In a different low temperature model (bottom, right) the counterions form a 1D Wigner–like ordering on each rod and the correlation between rods (i.e. sliding to optimally align oppositely charged regions) leads to a very short-range attraction.
Bound counter-ions are expected to lead to short-range attractions between similarly charged polyelectrolytes if the cloud of counter-ions has a non-uniform distribution along the rod.45 Low temperature simulations and theories predict that bound counter-ions (with counter-ions forming a 1D Wigner lattice) on adjacent rods develop positional correlations, resulting in a short-range exponentially decaying attractive force, with strength increasing as Z2 and range Zb (b = size of counter-ion) (Fig. 4, bottom right).45,46 An alternative high temperature model by Oosawa shows that counterion charge fluctuations on the rods may become correlated leading to an effective dipole-dipole attraction for distances less than Z2lB leading to bundling (Fig. 4, bottom left).20
3.2 For specific divalent cations depolymerization of taxol-stabilized microtubules preempts MT bundling
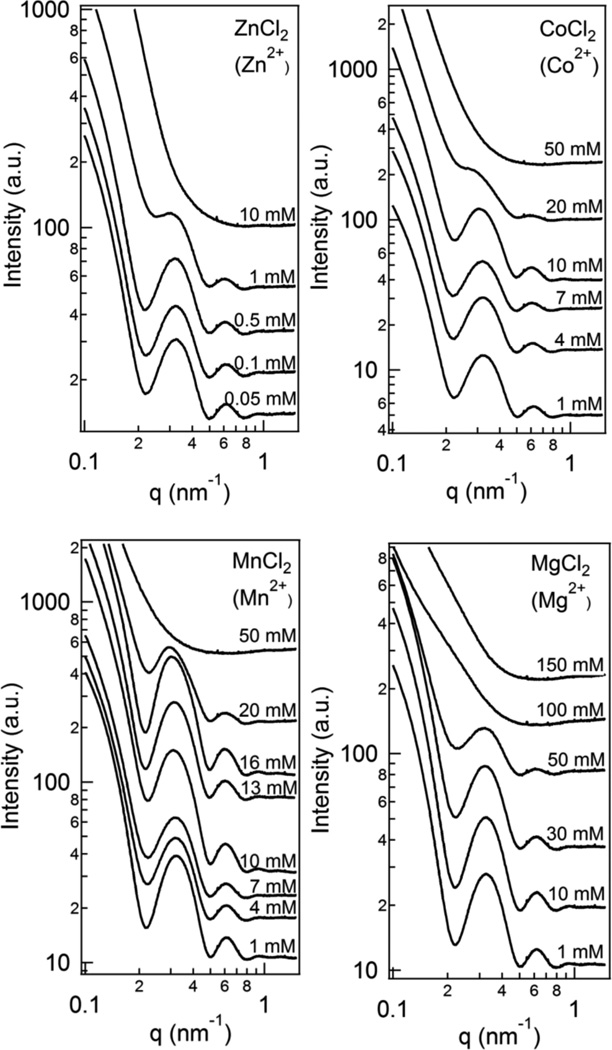
Let us now turn to the results of studies, which were designed in order to understand the interactions between MTs in the presence of a broader range of divalent ions some of which are ubiquitous in cells. Fig. 5 shows SAXS scans for taxol-stabilized MTs as a function of increasing divalent counterions for MgCl2 (2+), MnCl2 (2+), CoCl2 (2+), and ZnCl2 (2+).
Fig. 5.
Synchrotron SAXS profiles of solutions of taxol-stabilized microtubules (MTs) as a function of increasing divalent ion concentration for ZnCl2 (2+), CoCl2 (2+), MnCl2 (2+), and MgCl2 (2+). The data show a similar trend where below a certain concentration the SAXS profiles result from the form factor of microtubules indicative of stable MTs. At higher concentrations the profiles show enhanced SAXS with no hint of the form factor peaks indicative of depolymerization of taxol-stabilized MTs as discussed in the text. (Raw data before background subtraction.)
In comparison to what was found for divalents BaCl2 (2+) and SrCL2 (2+) and CaCl2 (2+) we find a complete lack of any evidence of a MT bundling correlation peak and instead the form factor scattering dominates the SAXS profiles (compare the form factor profiles in Fig. 5 to that in Fig. 2B labeled “no cation”). The data show that taxol-stabilized MTs are stable over a range of concentrations for each of the four distinct divalent ions beyond which the disappearance of the MT form factor, together with the onset of enhanced SAXS at smaller q, is a direct indication of depolymerization of taxol-stabilized MTs. (As previous cryo-TEM studies47 have shown MT depolymerization involves the inside-out curling and peeling of curved PFs (see Fig. 8, Right micrograph). These curved PFs are expected to give rise to the observed enhanced SAXS. Further TEM studies will be needed to see whether the curved protofilaments form other assembled structures in the presence of the counterions.) We further find that the concentration at which depolymerization sets in is ion specific and tends to decrease with increasing atomic number: MTs are depolymerized with 50 mM Mn2+ while stable in same concentration of Mg2+. (The behavior for Co2+and Mn2+ is similar and experiments with smaller increases in concentration steps between 20 mM and 50 mM is needed to distinguish between their respective efficiencies in MT depolymerization.) We stress that MTs are stable in NaCl up to at least 300 mM.18 Thus, the depolymerization effects reported in the current study, at much lower salt concentrations, are specific to multivalent ions.
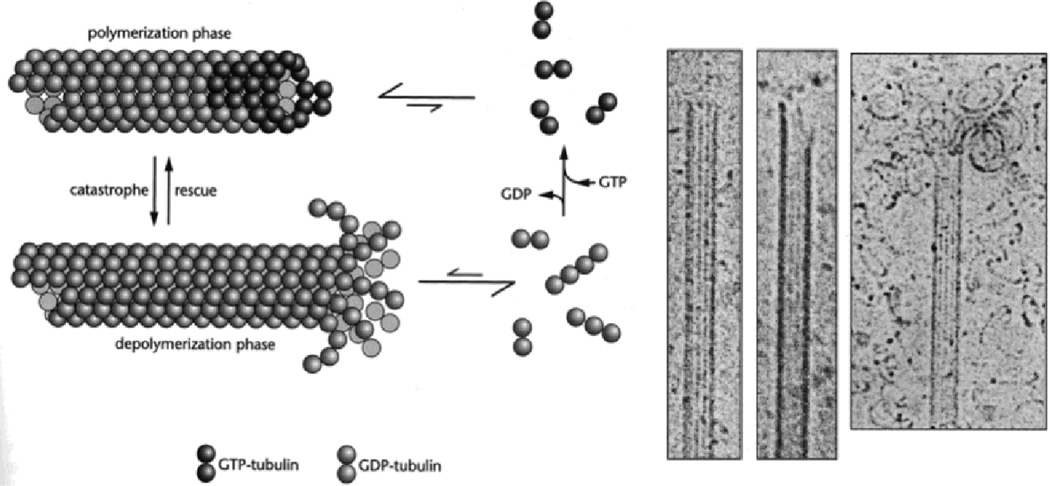
Fig. 8.
(Left) Cartoon of MT dynamic instability showing cycling of microtubule (MT) polymerization (in presence of high concentrations of GTP, with a straight GTP cap) and depolymerization (in the presence of low concentrations of GTP showing curling of PFs due to a curved conformation post hydrolysis). Cartoon adapted from reference 2. Copyright 2000 from Cell Movements: From Molecule to Motility, Second Edition by Bray. Reproduced by permission of Garland Science/Taylor & Francis LLC. (Middle) and (Right) showing examples of cryo-TEMs depicting MT polymerization (two middle images, with straight conformation of PFs within the MT wall) and depolymerization (Right, with PFs showing an inside-out curling of PFs). Middle and right images adapted with permission from reference 47. Reference 47 also shows MT depolymerization micrographs similar to the one seen in this image (in standard MT assembly assays containing GTP and no taxol) either upon dilution, cooling to 4 °C, or addition of 4 mM Ca2+. © E. M. Mandelkow et al., 1991.
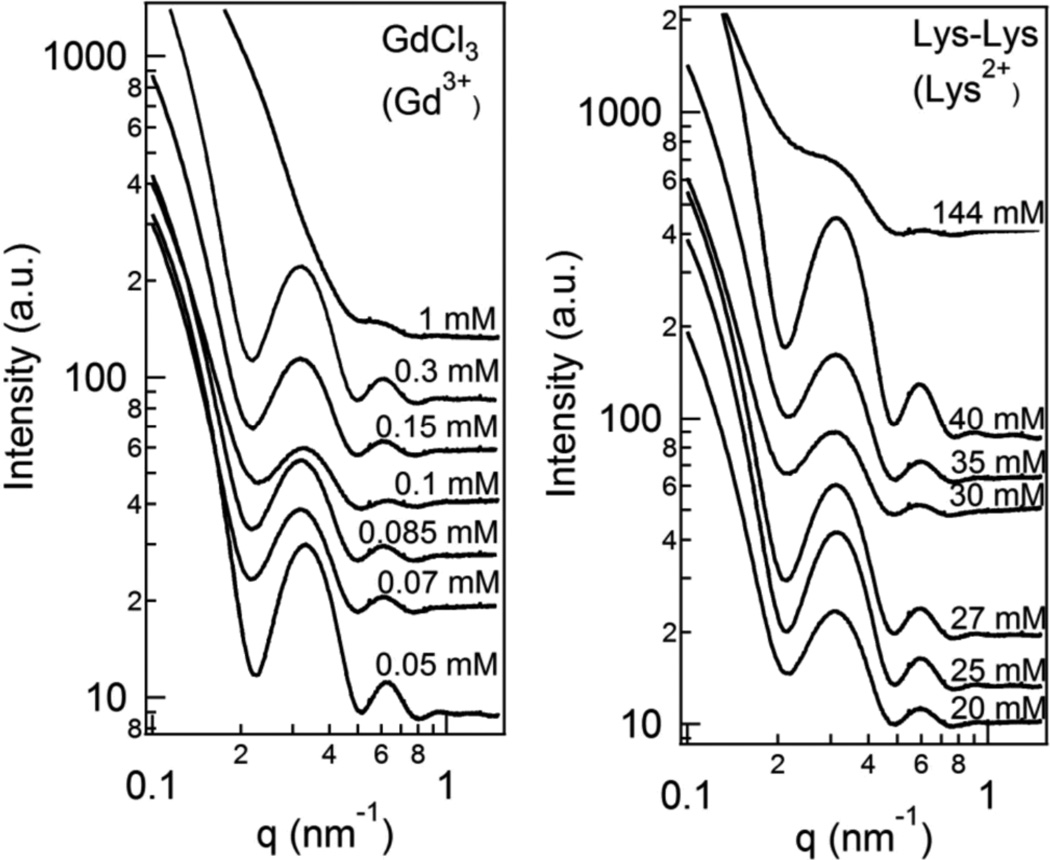
Thus, these new experiments have revealed behavior in sharp contrast and show that these earlier observations,21 where divalent ions Ca2+, Ba2+, and Sr2+ induce bundling in taxol-stabilized MTs, are not representative of the process occurring in the presence of several other divalent cations, some of which are cellular ions. Indeed, depolymerization of taxol-stabilized MTs, appears to often preempt the bundling transition at a lower counterion concentration. We note that pioneering cryogenic TEM studies, in the absence of taxol, have shown that seconds after addition of Ca2+, to a standard MT assembly assay containing GTP, MTs are found to show curling of PFs typical of MTs undergoing depolymerization (see Fig. 8, Right micrograph).47 Nevertheless, as we discuss below our findings are unexpected because the cancer chemotherapy drug taxol is known to stabilize GDP (guanosine diphosphate)-MTs and suppress MT dynamic instability; that is, cycles of MT polymerization followed by depolymerization. Figure 6 shows behavior for two other divalent cations, which show opposite behavior: Gd3+ trivalent ions are the most efficient ions in this study showing depolymerization of taxol-stabilized MTs at concentrations between 0.3 mM and 1 mM. Divalent oligolysine does not cause either MT bundling or depolymerization up to a concentration of at least 144 mM.
Fig. 6.
Synchrotron SAXS profiles of solutions of taxol-stabilized microtubules (MTs) as a function of increasing divalent ion concentration for GdCl3 (3+), and divalent oligolysine (2+). The profiles are typical of the MT form factor (except for data at 1 mM for Gd3+, which lacks the form factor scattering profile). Gd3+ is extremely efficient at depolymerizing taxol-stabilized MTs at concentrations ≈ 1 mM. On the other hand oligolysine (2+) shows profiles typical of the MT form factor indicating that it neither bundles or depolymerizes MTs up to at least 144 mM.
Figure 7 presents an overall summary for each ion studied with a plot of the radius of MTs over the ion concentrations (colored arrows) where SAXS profiles indicate stable MTs and, including, the ion concentrations (color coded lines after same color arrows) beyond which MTs have depolymerized (i.e. where the x-ray data show enhanced SAXS and no form factor scattering). We see that the depolymerization concentration decreases in an ion specific manner with increasing atomic number. The observation that the MT diameter (corresponding to 13 PFs per MT) is independent of ion species over the entire concentration range studied is notable.
Fig. 7.
Summary of ion specific effects showing the range of concentrations for different ions below which taxol-stabilized microtubules are stable (end of colored arrows correspond to the last SAXS profile showing the MT form factor), and, ion concentrations (indicated by colored lines after colored arrows), beyond which taxol stabilized MTs have depolymerized. The beginning and end of the colored lines correspond to ion concentrations at which SAXS profiles show MT form factor scattering and enhanced SAXS indicative of MT depolymerization, respectively. The observed trend is that the ion concentration at which MT depolymerization sets in decreases with increasing atomic number (although finer data points are needed to distinguish between Co2+ and Mn2+). The y-axis shows that the MT inner radius (obtained by fitting the form factor peaks in Figs. 5 and 6 to a hollow cylinder with fixed wall thickness of 4.9 nm) does not change in the presence of all ions studied consistent with MTs with 13 protofilaments.
To begin to understand the mechanism of divalent (and trivalent Gd3+) cation induced depolymerization of taxol-stabilized MTs, which preempts the bundling transition observed with Ca2+, Ba2+, and Sr2+, it is instructive to first start with a discussion of the molecular (i.e. tubulin-based) origin of MT dynamic instability, in the absence of taxol, involving repeated cycles of polymerization and depolymerization (see Fig. 8, Left).48 Tubulin is a GTPase with the β-subunit containing a nucleotide site where GTP attaches and slowly undergoes hydrolysis.2,3 The protofilaments are known to have a straight conformation when the nucleotide site is occupied by GTP (i.e. GTP-tubulin). Upon hydrolysis to GDP-tubulin the conformation undergoes a transition to a curved state. This switch in conformation, from straight to curved, upon GTP hydrolysis, forms the basis for dynamic instability where MTs stochastically switch from periods of slow growth (polymerization) to periods of rapid shrinkage (depolymerization). The current model of dynamical instability48,47 shown schematically in Fig. 8 (Left) hypothesizes that at high concentrations of GTP-tubulin, the dimer attaches to the growing end of the MT before hydrolysis occurs thus forming a stable GTP-cap with a straight conformation (Fig. 8, top left). At low concentrations of GTP-tubulin, it hydrolyses to GDP-tubulin before it attaches the growing end; this leads to a loss of the GTP-cap and a rapid depolymerization due to the inside-out curling of the PFs comprised of GDP-tubulin (Fig. 8, bottom left). The growing and shrinking (via curling PFs) has also been observed directly in cryo-TEM images (Fig. 8, middle and right panels).47
The cancer chemotherapy drug taxol attaches to the β-subunit (from the inner lumen side of the MT) and stabilizes MTs. It has been shown to promote MT assembly and to inhibit MT depolymerization both in the presence of CaCl2 up to 4 mM and at 4 °C.49 Taxol has also been shown to suppress dynamic instability (see Fig. 8, Left).50. Taxol-stabilized GDP-PFs, within the MT wall, are observed to maintain their straight conformation over long times. One model, based on cryogenic electron microscopy, hypothesizes that taxol stabilizes MTs post-hydrolysis by enhancing the lateral interactions between β-subunits in neighboring PFs. These authors point specifically to enhanced interactions between two intrinsically disordered sections of tubulin in adjacent dimers: the M-loop in front of taxol in one β-subunit with the H1-S2 loop in the neighboring β-subunit.51,52 In particular, with bound taxol, Glu53 in the M-loop and Arg282 in the adjacent H1-S2 loop form a stable ionic bond. A more recent molecular dynamics study also finds enhancements in the lateral PF-PF interactions. However, a larger effect found by these authors shows that taxol enhances the flexibility of chains near the nucleotide site of the β-subunit in the immediate vicinity of the interface between the β-subnit and the α-subunit of the next dimer in the same PF (see Fig. 2A).53 Thus, in this alternative model, the authors hypothesize that the increased flexibility counteracts the conformation change of tubulin dimers (from straight to curved) in PFs post-hydrolysis, thus, maintaining the straight conformation of taxol containing GDP-tubulin dimers in PFs.
Within the context of these two distinct models (i.e. one invoking lateral PF-PF interactions versus another involving longitudinal interactions between dimers on the same PF) our experimental findings of divalent cation (or trivalent Gd (3+)) induced depolymerization of taxol-stabilized MTs suggest the following. Because of Manning condensation (see Fig. 4, Top), multivalent cations (2+, 3+) spontaneously replace monovalent Na+ as the condensing ions (i.e. because this leads to an increase in the solution entropy with about two (or three) Na+ ions released for each condensed divalent (or trivalent)). The condensed multivalent cations may be attracted to anionic regions at the interface between the β-subunit in one dimer and the α-subunit above it thus neutralizing the flexibility effects of taxol with the PFs regaining their curved conformation leading to MT depolymerization. Alternatively, condensed multivalent cations my tend to disrupt the lateral M-loop/H1-S2-loop interactions; for example, by disruption of the aforementioned ionic bonds (i.e. effectively replacing Arg282 in its interactions with Glu53 on adjacent dimers). The weakening of the lateral M-loop/H1-S2-loop interactions would then naturally lead to MT depolymerization.
Our empirical observation is that whether the cation induces MT bundling or depolymerization appears to depend on the effective ionic radius. For example, the depolymerizing cations Zn2+, Co2+, Mn2+, and Mg 2+ all have ionic radii which fall between 0.072 nm to 0.083 nm, while the bundling ions Ca2+, Sr2+, Ba2+ have larger radii of 0.100 nm, 0.118 nm and 0.135 nm respectively.54 (Gd3+, which is the most efficient at MT depolymerization is an exception to this rule with an effective ionic radius of 0.093 nm.) Smaller ions have a larger hydration number (i.e. they are associated with more water molecules because of their larger electric fields) and are more resistant to giving up their bound water molecules compared to larger ions with smaller hydration number.55 The larger ions Ca2+, Sr2+, Ba2+ (which more readily give up their associated water molecules) appear to tend to bundle MTs by forming stronger contact ion pairs (bonds) linking anionic units on the surface of neighboring MTs. On the other hand the smaller ions with larger hydration number appear to be more efficient at disrupting the lateral M-loop/H1-S2-loop interactions or disrupting the effect of taxol in enabling flexibility at the interface between two tubulin dimers in the same PF. It is interesting to note that for all of the multivalent ions that lead to MT depolymerization (including Gd3+) there is a direct correlation between ion efficiency and atomic number (with larger atomic number ions being more efficient).
Conclusion
Earlier SAXS and TEM work had shown that multivalent cations may modulate the interactions between taxol stabilized microtubules (MTs) leading to bundling. In this paper we presented data, which shows that for a range of divalent cations (including the biologically relevant divalents Mg2+, Mn2+, and Zn2+) often an entirely different process, namely, the depolymerization of taxol-stabilized MTs, preempts the bundling transition. The effect is found to be ion specific where the efficiency of the ion to induce depolymerization increases with atomic number. The non-biological trivalent ion Gd3+is found to be the most efficient with depolymerization setting in near 1 mM. While previous cryo-TEM had discovered that Ca2+ ions my induce MT depolymerization in the absence of taxol, our findings are entirely unexpected given the known stabilizing effects of the cancer chemotherapy drug taxol against depolymerization of GDP containing MTs. Further work is required to elucidate the mechanism of ion induced MT depolymerization. In particular, more detailed analysis of the SAXS lineshape to look for changes in the MT form factor, just below the critical concentration for MT depolymerization, may yield valuable insight on the onset of MT shape changes with the peeling of protofilaments (PFs). It would also be interesting to use circular dichroism to monitor changes in secondary structures with increasing salt concentrations below and above the depolymerization transition. Finally, careful state-of-the-art cryogenic TEM is also needed to look for any distortions in MT structure prior to depolymerization. In particular, the more challenging method of high-resolution image reconstruction would most likely yield a better 3D real space picture of distortions at the junction between neighboring PFs or along PFs between tubulin dimers.
Acknowledgement
We are grateful for insightful discussions with Ram Seshadri regarding ion specific effects in general. CRS and YL acknowledge support by the U. S. DOE BES DE-FG02-06ER46314 (protein assembly characterization, plasmid preparation, and protein binding), the U. S. NSF DMR-1101900 (protein phase behavior), and the U. S. NIH grant GM-59288 (DNA condensation by cationic lipids; structure and function). SCF was supported by the U. S. NIH NS35010, and LW and HPM were supported by the U. S. NIH NS13560. DJN was supported by U.S. NIH GM104976, a Human Frontiers Program Grant number RGP0034/2010, and U. S. NSF grants DBI -0959721, PHY-0847188, and the Harvard MRSEC DMR-0820484. UR was supported by the Human Frontiers Science Program Organization (CDA 0059/2006) and the Israel Science Foundation (grant number 351/08). UR and DJN were jointly supported by the US-Israel Bi-national Science Foundation (grant number 2009-279). MAOL acknowledges support from Mexico-based science foundations CONACyt, PIFI, PROMEP, and UCMEXUS. MCC was supported by Korean Foundation Grants NRF 2011-0031931, 2011-0030923, 2012R1A1A1011023, and KAIST HRHRP N10110077. CS was supported by Korean Foundation Grant NRF 2011-355-C00037. The Stanford Synchrotron Radiation Laboratory, where the x-ray scattering work was performed, is supported by the U.S. Department of Energy. CRS acknowledges useful discussions with KAIST Faculty where he has a World Class University Visiting Professor of Physics appointment.
References
- 1.Safinya CR. In: The New Physics for the Twenty First Century. Chapter 16. Fraser G, editor. Cambridge: Cambridge University Press; 2006. [Google Scholar]
- 2.Bray D DD. Cell Movements: From Molecules to Motility. ed. 2. New York: Garland; 2001. [Google Scholar]
- 3.Pollard TD, Earnshaw WC, Lippincott-Schwartz J. Cell Biology. 2nd ed. New York: Elsevier; 2007. [Google Scholar]
- 4.Peters A, Palay SL, Def H. The Fine Structure of the Nervous System. 3rd ed. Oxford, New York: Webster; 1991. [Google Scholar]
- 5.Burgoyne RD, editor. The Neuronal Cytoskeleton. New York: Wiley & Sons; 1991. [Google Scholar]
- 6.Hirokawa N. J.Cell Biol. 1982;94:129–142. doi: 10.1083/jcb.94.1.129. [DOI] [PMC free article] [PubMed] [Google Scholar]
- 7.Jones JB, Safinya CR. Biophys. J. 2008;95:823–825. doi: 10.1529/biophysj.107.127415. [DOI] [PMC free article] [PubMed] [Google Scholar]
- 8.Beck R, Deek J, Choi MC, Ikawa T, Watanabe O, Frey E, Pincus PA, Safinya CR. Langmuir. 2010;26:18595–18599. doi: 10.1021/la103655x. [DOI] [PubMed] [Google Scholar]
- 9.Beck R, Deek J, Jones JB, Safinya CR. Nature Materials. 2010;9:40–46. doi: 10.1038/nmat2566. [DOI] [PubMed] [Google Scholar]
- 10.Kandel ER, Schwartz JH, Jessell TM. Principles of Neural Science. 4th ed. New York, Singapore: McGraw Hill; 2000. [Google Scholar]
- 11.Hirokawa N. Trends in Cell Biology. 1996;6:135–141. doi: 10.1016/0962-8924(96)10003-9. [DOI] [PubMed] [Google Scholar]
- 12.Caceres A, Kosik KS. Nature. 1990;343:461–463. doi: 10.1038/343461a0. [DOI] [PubMed] [Google Scholar]
- 13.Esmaeli-Azad B, McCarty JH, Feinstein SC. J. Cell Sci. 1994;107:869–879. doi: 10.1242/jcs.107.4.869. [DOI] [PubMed] [Google Scholar]
- 14.Dawson HN, Ferreira A, Eyster MV, Ghoshal N, Binder LI, Vitek MP. J. Cell Sci. 2001;114:1179–1189. doi: 10.1242/jcs.114.6.1179. [DOI] [PubMed] [Google Scholar]
- 15.Harada A, Teng J, Takei Y, Oguchi K, Hirokawa N. J. Cell Biol. 2002;158:541–549. doi: 10.1083/jcb.200110134. [DOI] [PMC free article] [PubMed] [Google Scholar]
- 16.Dehmelt L, Halpain S. Genome Biol. 2004;6:1–10. doi: 10.1186/gb-2004-6-1-204. [DOI] [PMC free article] [PubMed] [Google Scholar]
- 17.Heidemann SR. In: International Review of Cytology: A Survey of Cell Biology. Jeon KW, editor. New York: Academic Press; 1996. [Google Scholar]
- 18.Choi MC, Raviv U, Miller HP, Gaylord MR, Kiris E, Ventimiglia D, Needleman DJ, Kim MW, Wilson L, Feinstein SC, Safinya CR. Biophys. J. 2009;97:519–527. doi: 10.1016/j.bpj.2009.04.047. [DOI] [PMC free article] [PubMed] [Google Scholar]
- 19.Hirokawa N, Hisanaga S-I, Shiomura Y. J. Neurosci. 1988;8:2769–2779. doi: 10.1523/JNEUROSCI.08-08-02769.1988. [DOI] [PMC free article] [PubMed] [Google Scholar]
- 20.Oosawa F. Biopolymers. 1968;6:1633–1639. [Google Scholar]
- 21.Needleman DJ, Ojeda-Lopez MA, Raviv U, Miller HP, P H, Wilson L, Safinya CR. Proc. Natl. Acad. Sci. U.S.A. 2004;101:16099–16103. doi: 10.1073/pnas.0406076101. [DOI] [PMC free article] [PubMed] [Google Scholar]
- 22.Raviv U, Needleman DJ, Li Y, Miller HP, Wilson L, Safinya CR. Proc. Natl. Acad. Sci. USA. 2005;102:11167–11172. doi: 10.1073/pnas.0502183102. [DOI] [PMC free article] [PubMed] [Google Scholar]
- 23.Raviv U, Nguyen T, Ghafouri R, Needleman DJ, Li Y, Miller HP, Wilson, L L, Bruinsma RF, Safinya CR. Biophys. J. 2007;92:278–287. doi: 10.1529/biophysj.106.087478. [DOI] [PMC free article] [PubMed] [Google Scholar]
- 24.Li HL, DeRosier DJ, Nicholson WV, Nogales E, Downin KH. Structure. 2002;10:1317–1322. doi: 10.1016/s0969-2126(02)00827-4. [DOI] [PubMed] [Google Scholar]
- 25.Warren BE. Phys. Rev. 1941;59:693–699. [Google Scholar]
- 26.Raedler JO, Koltover I, Salditt T, Safinya CR. Science. 1997;275:810–813. doi: 10.1126/science.275.5301.810. [DOI] [PubMed] [Google Scholar]
- 27.Ewert KK, Zidovska A, Ahmad A, Bouxsein NF, Evans HM, McAllister CS, Samuel CE, Safinya CR. Topics Curr. Chem. 2010;296:191–226. doi: 10.1007/128_2010_70. [DOI] [PMC free article] [PubMed] [Google Scholar]
- 28.Ewert KK, Ahmad A, Evans HM, Safinya CR. Expert Opin. Biol. Ther. 2005;5:33–53. doi: 10.1517/14712598.5.1.33. [DOI] [PubMed] [Google Scholar]
- 29.Ahmad A, Evans HM, Ewert KK, George CX, Samuel CE, Safinya CR. J. Gene Med. 2005;7:739–748. doi: 10.1002/jgm.717. [DOI] [PubMed] [Google Scholar]
- 30.Lin AJ, Slack NL, Ahmad A, George CX, Samuel CE, Safinya CR. Biophys. J. 2003;84:3307–3316. doi: 10.1016/S0006-3495(03)70055-1. [DOI] [PMC free article] [PubMed] [Google Scholar]
- 31.Koltover I, Wagner, K K, Safinya, C CR. Proc. Natl. Acad. Sci. U.S.A. 2000;97:14046–14051. doi: 10.1073/pnas.97.26.14046. [DOI] [PMC free article] [PubMed] [Google Scholar]
- 32.Tang JX, Janmey PA. J. Bio. Chem. 1996;271:8556–8563. doi: 10.1074/jbc.271.15.8556. [DOI] [PubMed] [Google Scholar]
- 33.Wong GCL, Lin A, Tang JX, Li Y, Janmey PA, Safinya CR. Phys. Rev. Lett. 2003;91:018103. doi: 10.1103/PhysRevLett.91.018103. [DOI] [PubMed] [Google Scholar]
- 34.Ikawa T, Hoshino F, Watanabe O, Li Y, Pincus PA, Safinya CR. Phys. Rev. Lett. 2007;98:018101. doi: 10.1103/PhysRevLett.98.018101. [DOI] [PubMed] [Google Scholar]
- 35.Angelini TE, Liang H, Wriggers W, Wong GCL. Proc. Natl. Acad. Sci. U.S.A. 2003;100:8634–8640. doi: 10.1073/pnas.1533355100. [DOI] [PMC free article] [PubMed] [Google Scholar]
- 36.Wong GCL. Curr. Opin. Colloid Interface Sci. 2006;11:310. [Google Scholar]
- 37.Wong GCL, Pollack L. Annu. Rev. Phys. Chem. 2010;61:171. doi: 10.1146/annurev.physchem.58.032806.104436. [DOI] [PubMed] [Google Scholar]
- 38.Pelletier O, Pokidysheva E, Hirst LS, Bouxsein N, Li Y, Safinya CR. Phys. Rev. Lett. 2003;91:148102. doi: 10.1103/PhysRevLett.91.148102. [DOI] [PubMed] [Google Scholar]
- 39.Miller HP, Wilson L. Meth. Cell. Biol. 2010;95:2. doi: 10.1016/S0091-679X(10)95001-2. [DOI] [PubMed] [Google Scholar]
- 40.Bunker JM, Wilson L, Jordan MA, Feinstein SC. Mol. Biol. Cel. 2004;15:2720. doi: 10.1091/mbc.E04-01-0062. [DOI] [PMC free article] [PubMed] [Google Scholar]
- 41.Panda D, Samuel JC, Massie M, Feinstein SC, Wilson L. Proc. Natl. Acad. Sci. U.S.A. 2003;100:9548. doi: 10.1073/pnas.1633508100. [DOI] [PMC free article] [PubMed] [Google Scholar]
- 42.Binder LI, Frankfurter A, Rebhun LI. J. Cell Biol. 1985;101:1371. doi: 10.1083/jcb.101.4.1371. [DOI] [PMC free article] [PubMed] [Google Scholar]
- 43.Levy SF, LeBoeuf AD, Massie MR, Jordan MA, Wilson L, Feinstein SC, C. S. J. Biol. Chem. 2005;280:13520. doi: 10.1074/jbc.M413490200. [DOI] [PubMed] [Google Scholar]
- 44.Manning GS. J. Chem. Phys. 1969;51:924–933. [Google Scholar]
- 45.Gelbart WM, Bruinsma RF, Pincus PA, Parsegian VA. Physics Today. 2000 Sep;:38–45. [Google Scholar]
- 46.Gronbech-Jensen N, Mashl RJ, Bruinsma RF, Gelbart WM. Phys. Rev. Lett. 1997;78:2477–2480. [Google Scholar]
- 47.Mandelkow EM, Mandelkow E, Milligan RA. J. Cell Bio. 1991;114:977–991. doi: 10.1083/jcb.114.5.977. [DOI] [PMC free article] [PubMed] [Google Scholar]
- 48.Mitchison T, Kirschner M. Nature. 1984;312:237–242. doi: 10.1038/312237a0. [DOI] [PubMed] [Google Scholar]
- 49.Schiff PB, Fant J, Horwitz SB. Nature. 1979;277:665–667. doi: 10.1038/277665a0. [DOI] [PubMed] [Google Scholar]
- 50.Derry WB, Wilson L, Jordan MA. Biochemistry. 1995;34:2203–2211. doi: 10.1021/bi00007a014. [DOI] [PubMed] [Google Scholar]
- 51.Nogales E, Whittaker M, Milligan RA, Downing KH. Cell. 1999;96:79–88. doi: 10.1016/s0092-8674(00)80961-7. [DOI] [PubMed] [Google Scholar]
- 52.Nogales E, Wang HW, Niederstrasser H. Curr. Opin. Struct. Biol. 2003;13:256–261. doi: 10.1016/s0959-440x(03)00029-0. [DOI] [PubMed] [Google Scholar]
- 53.Mitra A, Sept D. Biophys. J. 2008;95:3252–3258. doi: 10.1529/biophysj.108.133884. [DOI] [PMC free article] [PubMed] [Google Scholar]
- 54.Data taken from Wikipedia on the subject of “Ionic Radius”.
- 55.Israelachvili JN. Intermolecular & Surface Forces. London: Academic Press; 1992. [Google Scholar]


