

Abstract
Concerns over the prospects of explosive demographic growth led to concerted efforts to engineer fertility reductions in the developing world, while skeptics argued that economic development was the best way to hasten fertility decline. Now that fertility declines have occurred in many countries can either side claim victory? Or was demographic pressure simply self-regulated by links between mortality and fertility changes? Using country-level data and a methodology inspired by a series of seminal articles by Preston, I assess the impact of economic change on both fertility and mortality and the independent effect of mortality on fertility between the 1960s and the 1990s. Aggregating country-level estimates into six regional population projections from 1950 to 2000, I translate these impacts on demographic variables into population size impacts. Although economic development accounted poorly for either mortality or fertility changes, the prevailing population growth was not that different from the growth predicted had economic development alone influenced demographic trends. The main reason appears to be an association between mortality and fertility levels that offset the initial effects of mortality declines outpacing economic growth. Together, the effect of economic change on both mortality and fertility declines and the effect of mortality on fertility predicted reasonably well actual population size in year 2000, suggesting only a modest influence of any additional factor.
Keywords: Economic development, Family planning programs, Fertility decline, Mortality decline, Population growth
Introduction
At the onset of this new century, fertility has declined in many of the less-developed areas of the world, and in many cases, these declines occurred sooner and faster than anticipated. While many mid-twentieth century demographers worried about the increase in population growth rates, world population grew significantly in the second half of the twentieth century but no faster than had demographic rates remained constant at their mid-century levels (Heuveline 1999). Fast fertility declines promptly followed fast mortality declines to relieve population pressure and keep population growth nearly unchanged, on average, during the past fifty years. This could suggest self-regulating demographic mechanisms but hardly any population in the contemporary developing world has been left to the operation of homeostatic mechanisms. These declines were not only accompanied by massive structural transformations, by also by concerted efforts to diffuse the ‘population bomb’ (Ehrlich 1968).
Several decades of active research on fertility transitions have tried to disentangle the separate contributions of pure demographic pressure, economic development and social engineering. Recent reviews of what demographers have learned in the process are far from heartening. Mason, in particular, identified several ‘errors in our thinking’ (1997: 445) about fertility transitions, among which studying fertility transitions in isolation from mortality transitions (also see Hirschman 1994), and focusing too narrowly on the onset of fertility decline and the factors explaining the onset at the particular time they occurred.
This paper represents an attempt to move in the opposite direction by taking stock of the past half-century of demographic changes in the developing world, re-assessed in broad strokes perhaps at the cost of oversimplification and disregard for local idiosyncrasies. The same analytical approach is used to study recent fertility declines and earlier mortality declines, namely Preston’s (1975) decomposition of mortality reductions into economic and other (residual) factors. After updating Preston’s mortality decomposition, the main factors in recent fertility transitions are similarly decomposed into three broad categories: economic development, mortality change, and other (residual) factors. To further link mortality and fertility changes, a common gauge to evaluate both transitions is developed, relating the impact of different factors on fertility, mortality, or both, to their effects on today’s population size. More specifically, counterfactual projections are formulated between 1950 and 2000 to compare the demographic impact of economic development, residual mortality decline, and residual fertility decline throughout the second half of the twentieth century. These simulations shift the emphasis from the causal relationships between different sets of factors to their cumulative contributions throughout the second half of this century to today’s world population.
The results suggest that economic development accounts for nearly half of demographic changes in the less-developed regions over the past half-century. Given the very coarse measure of structural changes that constitutes the growth of the average economic output per person and the current disregard for the demographic transition theory, these results may seem to provide unusual support for the theory’s basic tenets. Perhaps even more surprisingly, these estimates suggest that nearly a third of fertility transitions were linked to mortality declines in excess of the mortality impact of economic development (thereafter referred to as residual mortality declines). This leaves relatively little room for residual factors in fertility declines (thereafter referred to as residual fertility declines), in other words, factors that would contribute to fertility declines independently of economic and demographic factors. The analyses presented below do not deny to these factors a possibly important role in the onset of fertility transitions, but indicate that overall they did not substantially alter population growth in the developing world during the second half of the twentieth century.
Fertility transition theories
After World War II, Western demographers became more involved in international issues (Szreter 1993; Hodgson 1988, 1991), as many gradually broadened their interest from their respective domestic populations to the demographic issues in what French demographer Alfred Sauvy in 1952 christened the ‘Third World’ (Bairoch 1992). These demographers soon became aware of the magnitude of the on-going demographic changes in regions now known as LDRs (less developed regions). The scientific study of the relationships between economic development and population growth emerged as an important sub-field of demography, but most demographers had already taken it as an article of faith that fast population growth in poor countries was ominous in many ways (Hodgson & Watkins 1997). Therefore, they turned to the historical demographic fertility transitions of the West to gain a general understanding of these transitions and to shed light on the prospects for fertility transitions in the rest of the world. In the process, earlier observations and analyses (Landry 1934; Thompson 1929) were re-formulated, most notably by Notestein (1945) and Davis (1948), and they became widely known as the demographic transition theory. The founding paradigm of international demography was not very encouraging, however, as it indicated that the fertility transition would result from structural changes linked to a general ‘modernization’ process, but suggested no particular way to hasten the process.
In the following decade, many demographers’ skepticism retreated in front of the perceived urge to curb population growth in the developing world (Demeny 1988; Hodgson 1983). These concerns reached beyond the initial circle of demographers to become an eminent topic of international policies and public discourse (Wilmoth & Ball 1992) and, within another decade, the international family planning movement was in full swing. External factors are often credited for changing demographers’ views on the potential success of these programs (Szreter 1993; Hodgson 1988). But new demographic knowledge also contributed to that change. Although mid-century demographers anticipated the emerging population growth of the developing world, they largely underestimated it. When Notestein and his contemporaries worried about the imminent growth of the world population, they had in mind about four billion people in the year 2000.1 The 1958 assessment is the first round of United Nations projections to hit close to the target for the year 2000, slightly over six billion people. What had improved from the early-1950s rounds was not the methodology, nor the analysts’ foresight on future trends, but the demographic data on the worldwide conditions of the time (Keilman 1998). These data enabled demographers to fully realize the pace of mortality decline as well as that ‘spectacular reductions of death rates [were achieved] without any great change in economic conditions’, ushering in a ‘changing relationship between population growth and economic progress’ (Durand 1958: 36).2 Preston (1975) substantiates this observation and shows that probably no more than 20% of mortality declines between the 1930s and the 1960s is due to economic development during that period.
Population growth then appeared as a population problem. While the demographic transition theory suggested a transitory period of strong population growth between the time when development-related changes would reduce mortality and the time when such changes would in turn lower fertility, that growth was perceived as a symptom of development. As mortality decline appeared disconnected from economic progress, it seemed that population growth could precede economic progress and thus hinder further development, prevent the ‘adjustment’ of fertility, and perpetuate itself. From this perspective, many subsequent population policies and programs can be seen as attempts to correct the effects of the emancipation of population growth from economic trends, based on the conviction that the balance should be restored by seeking ways to also ‘dissociate’ fertility trends from economic development. In other words, demographic processes had been ‘tampered’ with – via successful attempts to improve human health – and some demographic order had to be restored through further interventions. But health intervention programs that contributed to the ‘population problem’ by improving survival chances also pointed at a solution. The success of these programs suggested that some of the personal health behavior and medical technologies of the West could be inexpensively dispatched and diffused to many areas of the world without requiring profound changes or ‘modernization’ to the societies in question. Though Caldwell (1997) argues that ‘demographic pressure intertwined with ideas, ideologies and organized assistance both in nineteenth-century Europe and the developing countries of the second half of the twentieth century’, the international family planning movement reached a higher level of institutional organization in the later period. While evaluations of the past performance of family planning programs are almost as old as these programs themselves (e.g., Berelson et al. 1966), hardly any consensus has emerged in respect to the real magnitude of their impact on fertility (Tsui et al. 1992). The direct measurement of this impact raises a number of troublesome issues that contributed to generate at times heated debate (Bogue & Tsui 1978, 1979; Demeny 1979a, 1979b) that has continued to the present (Potts 1997; Pritchett 1994; Bongaarts 1994). Meanwhile, the demographic transition theory has been ‘dramatically shattered’ by subsequent analyses of past European fertility transitions (Alter 1992: 13) and recent fertility declines in developing countries. The once ‘iconoclast’ view that these structural transformations (economic development, industrialization, urbanization) played a minor role in most fertility transitions has gradually gained acceptance (Cleland & Wilson 1987).
The evidence to be accounted for is clearly challenging as demographic changes during the past fifty years exhibit more diversity than similarities. Fertility transitions in particular have occurred under very different demographic and economic conditions (Heuveline 1999; Bongaarts & Watkins 1996). Possibly the only common trait of recent fertility declines is that in each case they have been preceded by a rapid mortality decline. Hirschman (1994: 228) thus suggests that we study fertility declines more generally in terms of how ‘demographic equilibria’ are ‘reestablished after mortality declines.’ While the demographic transition theory did not initially postulate that mortality had any immediate, independent effect on fertility, Davis (1963) underscores mortality decline as the central motivation for reducing family size in a late reformulation of the theory. Periodical re-investigations of a potential mortality-fertility link (summarized in Montgomery & Cohen 1998; Preston 1978) contributed largely to skepticism about such mechanisms and mortality decline plays no part in most recent theories of fertility decline (Mason 1997). As Galloway, Lee & Hammel (1998) point out, all demographers agree that in the long term fertility must adjust to mortality change and that in the short term they are largely independent. The important research question is what happens in the mid-term, defined by these authors as 5 to 30 years.
Data and methods
Decomposition of mortality change at the national level
The mortality decomposition followed Preston’s seminal work on the relationship between mortality and national income levels, and its change over time. In several papers, Preston (1975, 1980, and 1985) discusses the difficulties in assessing the impact of national income (or its rate of change) on the rate of change of life expectancy at birth. One of the main difficulties lies in the fact that while there is a strong relationship between national income and mortality indicators at any time, this cross-sectional relationship has itself been changing due to other factors and possibly new influences. Estimating the impact of economic development on mortality reduction in a particular country from any cross-sectional relationship between income and mortality would only be acceptable had this cross-sectional relationship remained invariant over time. On the contrary, Preston clearly documented that between the 1900s and the 1960s, the estimated regression line changed and most notably shifted upward over time. For any given income level, a country is estimated to have lower mortality (higher life expectancy) in more recent years.
Preston (1975) derived a simple technique to take stock of both the strong cross-sectional relationships between mortality and income and the dynamics of these relationships. This technique rests on the estimation of the cross-sectional relationship between national income per capita and life expectancy at birth at two different times. I re-assessed the empirical relationship between an aggregate indicator of mortality (life expectancy at birth for both sexes, denoted e0(0), data from United Nations 1999) and an indicator of national income (purchasing power parity or PPPs, denoted Y, data from Summers & Heston 1991) for the most recent thirty-year period.3 Using a logistic function, the estimated relationship is of the following form:4
| (1) |
The proportion of the increase in life expectancy attributable to increases in average national income was also assessed as in Preston (1975). Preston reasoned that the increase in life expectancy estimated from the 1960s relationship used with (a) the 1962 PPPs versus (b) the 1992 PPPs as inputs reflects the impact of economic development had other factors remained unchanged. That impact can also be estimated from the 1990s relationship using (c) the 1962 PPPs versus (d) the 1992 PPPs. Preston suggested to use the average of (b)–(a) and (d)–(c) as the estimate of the increase in life expectancy that would have occurred if only economic development had had an effect on mortality. On the contrary, the difference between estimated life expectancies using the 1962 PPPs and (a) the 1960s relationship versus (c) the 1990s relationship can be interpreted as the impact of the other factors holding economic levels constant. Again, the same interpretation can be made of the difference between the values derived from the 1992 PPPs and (b) the 1960s relationship versus (d) the 1990s relationship, and the average of (c)–(a) and (d)–(b) is taken. Preston (1980, 1985) also discuss other estimation approaches that provide similar conclusions about the relative contribution of different types of factors, and the decomposition outlined above remains the most appealing owing to its simplicity and fair robustness.
Decomposition of fertility change at the national level
While Preston’s estimates have been widely accepted and often cited as a fair approximation of the role of economic development in modern mortality transitions, no such consensual work exists in fertility research. But Bongaarts & Watkins (1996) observed that Preston’s findings about the changing relationship between national income and mortality levels is relevant to contemporary fertility transitions. While fertility levels are inversely associated with national income levels at any given time, the relationship has changed over time with lower fertility being now associated with a given income level. Thus counterfactual fertility declines – had they kept pace with economic growth – can be estimated by a strategy similar to that used for mortality, based on the estimation of the empirical relationship between economic and demographic levels at two different points in time. The only difference introduced here is to explicitly isolate mortality change from the ‘other’ (non-economic) factors in order to measure the independent impact of mortality declines on fertility declines. More precisely, the logarithm of the total fertility rate (TFR) was regressed on life expectancy at birth and PPPs:
| (2) |
Again the relationship was estimated both with early 1960s and early 1990s data. As most developed countries had already completed their fertility transition by the early 1960s, only data from the developing countries were used in this part of the analysis.
As for mortality, the fertility decline attributable to the joint mortality and national income changes can be assessed by comparing the TFR estimates obtained from the relationship estimated for the 1960s and (a) the 1960s life expectancies and PPPs or (b) the 1990s life expectancies and PPPs. Another estimate for the same quantity can be obtained by comparing TFRs (c) and (d) derived with the same input data but the relationship estimated for the 1990s. The fertility decline attributable to increases in national income alone can also be assessed separately, by accounting first for the impact of national income changes on life expectancy at birth, as estimated in Equation (1). To do so, four other TFR estimates are obtained from either the 1962 or PPPs and either the 1960s or the 1990s estimated relationships to predict life expectancy from Equation (1), then TFR from Equation (2). The TFR predicted from the 1960s relationships using (e) the 1962 PPPs versus (f) the 1992 PPPs are compared. As before, similar estimates can be obtained based on the 1990s relationships in Equations (1) and (2) and the average of the estimates based on the 1960s and the 1990s relationships is taken.
Assessment of the corresponding population impact at the regional level
The assessment of the demographic impact of various factors is based on a comparison of different population projections using either the prevailing mortality and fertility rates or some alternative assumptions. The projections follow the standard female-dominant cohort-component approach (Keyfitz 1968; Shryock & Siegel 1975), elaborated by Whelpton (1928 and 1936), though the approach could be traced back to Cannan (1895). Given the data preparation involved in each single projection, it was not possible to carry country-specific projections for each country and national population projections were only prepared for China and India. Other countries were grouped in four regions: sub-Saharan Africa, Latin America and the Caribbean, ‘Other LDR-East’ (which consists of the other developing countries in East and Southeast Asia, and the Pacific), and ‘Other LDR-West’ (which consists of the other developing countries in South- and West-Asia, and North Africa). Note that the partial unavailability of data prevented the analysis from starting before 1950, which unfortunately truncates the study of mortality decline in certain regions.
For each region, one alternative series of life expectancy at birth for each sex, and two alternative series of total fertility rates were prepared. The proportion of life expectancy increase and TFR decrease attributable to increases in national income and the proportion of TFR decrease attributable to increases in both national income and life expectancy at birth were computed for each of the six regions. The regional proportions were obtained as averages of the model predictions for each country with available data in both periods. The regional average of national life expectancy at birth uses annual numbers of births by country as weights, while for total fertility rates, the mid-period total size of the female population of each country is used as weight.5 The regional proportions were then applied to derive a new set of life expectancy at birth (M1) and TFR estimates (F1) representing demographic changes attributable to increases in national income (scenario S1). A second set of TFR estimates (F2) representing fertility declines attributable to increases in both national income and life expectancy at birth was combined with prevailing life expectancy estimates (scenario S2). Within each region, the same proportion of the actual increase in life expectancy at birth was assumed to apply in each five-year interval from 1955 to 2000. In addition, the age-pattern of mortality was assumed to remain within a family of model life-tables at different mortality levels, (e.g., United Nations Latin American pattern for Latin America and the Caribbean) throughout the projection (1950–2000). Perhaps a more satisfactory assumption would have been to assume the gradual disappearance of regional mortality idiosyncrasies with mortality declines, i.e., a convergence toward a standard set of age-pattern, such as Coale and Demeny ‘West’ family of model life-tables. Alternative projections with different age-patterns are discussed in the sensitivity analysis section below and suggest that the results are fairly robust to different specifications of the mortality age-pattern.
As for mortality, fertility assumptions F1 and F2 assume within each region, a constant relative contribution of the different factors to actual TFR decline in each five-year interval after the onset of fertility decline. To formulate the fertility assumptions corresponding to these estimated proportions, actual fertility rates were kept unchanged up to the period when the TFR peaked in each region. From the peak to the last period, 1995–2000, age-specific fertility rates were assumed to change by a fixed proportion of their actual change, with the estimated relative contributions used as the prorating factors.6 As these operations are applied separately to each age-specific fertility rates, the age-distribution of fertility differs across fertility assumptions. To test the sensitivity of the results to different assumptions about the age-pattern of fertility, an alternative set of projections was also prepared with the prorated regional TFRs and the same age-pattern across fertility assumptions.
The formulation of these counterfactual assumptions is admittedly coarse – as partly required by the global scope adopted in this part of the analysis – and there is, of course, no ultimate test of the external validity of the corresponding projections. A sensitivity analysis based on alternative estimates and projection assumptions provides, however, some sense of the reliability of the results and of the validity of the conclusions derived therefrom. The decomposition into three sets of factors is not the most sophisticated methodologically but seeks robustness rather than precision. The first set of factors is referred to as ‘economic progress’ and is measured here, perhaps restrictively, by change in national income levels. The other two sets of factors are not clearly defined by this procedure and are therefore open to interpretation. Specifically, the second set of factors are the non-economic factors that contributed to the residual mortality declines, thus lowering mortality and indirectly lowering fertility through reduced mortality. The third set of factors are those that contributed to the residual fertility declines, thus lowering fertility independently of any development or mortality effect. Public health programs, international eradication efforts, and the diffusion of health behaviors were early and widely acknowledged as the main non-economic factors of mortality declines. As discussed above, there is much less agreement to date about the residual factors of fertility declines, but the potential impact of family planning programs falls into this category.
Finally, care needs to be exerted in interpreting such short-hand terms as, for instance, ‘contribution’ and ‘accounted by’. If for example, mortality was found to decline twice as fast as predicted had mortality levels remained in a fixed relationship with economic levels, the corresponding claim would be that mortality would have declined by one half of its actual decline had the same economic development prevailed and had no other factors influenced mortality declines. But the claim is not that economic growth caused half of the mortality changes. That actual contribution should be estimated by different methods that properly take into account the timing of changes in national income and mortality levels.7 In the discussion below, terms such as ‘contribution’ might be used to avoid too many cumbersome periphrases such as ‘what it would have been had no other factors played any role’, but the more precise meaning always applies.
Sensitivity analysis
The demographic projections model used here is deterministic, not stochastic. This model applies proportion (i.e., rates) to specific age-and-sex groups, rather than probabilities to the individual members of each group, and there is no uncertainty involved in relating the model parameters to its demographic outcomes. But uncertainty certainly appears in the choice of the most likely value of any model parameters, in particular when estimating the value of mortality or fertility rates under different assumptions (counterfactual scenarios). And it is possible to study how the demographic outcomes vary under different model parameters. The probability distribution of any demographic outcome could even be estimated from the probability distributions of each parameter, the simulation of many random draws for each parameter value, and the distribution of outcomes corresponding to each set of drawn parameter values.
Notwithstanding the difficulty of defining a probability distribution for each projection parameter, the time-intensive process of preparing the projection inputs for each region and putting together the corresponding outputs severely constraints the number of simulations that can be carried on. Short of deriving confidence intervals for the projection results, it is possible to delineate the range of plausible outcomes by studying the results corresponding to extreme values of the main parameters and to alternative assumptions. Two alternative fertility assumptions to F1 and to F2 were prepared in which the proportion of fertility declines attributable to increases in national income were measured from Equations (1) and (2) estimated either for the 1960s or for the 1990s rather than from the average of the two. While in F1 and F2, each age-specific fertility rate is estimated separately with the effect of producing different age-pattern of fertility over time, a third alternative to each fertility assumption is based on the same TFRs but a constant age-pattern of fertility in each region. Similarly, two alternative mortality assumptions to M1 were prepared, corresponding to different estimates of life expectancy at birth derived from Equation (1) estimated either for the 1960s or for the 1990s, while a third alternative only modifies the age-pattern assumptions. Specifically, this third alternative uses a common, standard set of model life-tables (i.e., Coale and Demeny ‘West’ model) instead of a specific age-pattern in each region. One dimension that is not investigated here is the possible uncertainty in available data on prevailing economic and demographic levels. Using one of the three alternatives for M1, F1, and F2 at a time led to six alternative projections for scenario S1 and three alternative projections for scenario S2.
Results
Mortality decomposition
The estimated relationship for the early 1960s is:
whereas for the early 1990s it is as follows:
The difference with the 1990s estimates confirms a continued upward shift in the relationship between mortality and income levels (Figure 1).
Figure 1.
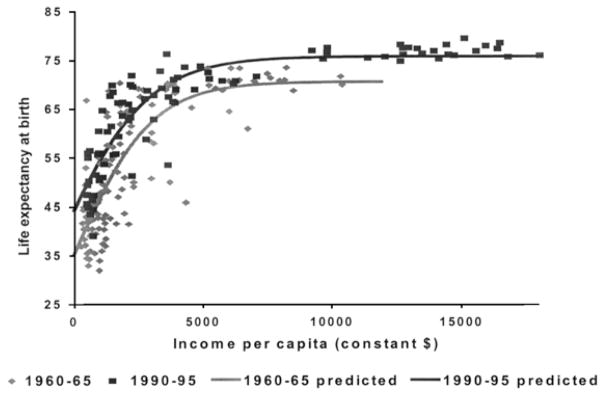
Estimated relationship between life expectancy and national income, 1960–1965 and 1990–1995. n = 91 countries in 1960–1965; n = 127 countries in 1990–1995.
Source: United Nations (1999); Penn Tables 5.6 for PPPs.
The corresponding decomposition is illustrated in Table 1, with the average across all countries with data for both periods in the less developed regions.
Table 1.
Life expectancy associated with combinations of national income change and relationships between national income and life expectancy at birth, average for the developing countries
| Relationship between national income and life expectancy as observed in | Regional income in
|
Estimated change due to increase in income | |||||
|---|---|---|---|---|---|---|---|
| 1962 | 1992 | ||||||
| 1960–1965, n = 91 | (a) | 45.29 | (b) | 53.22 | (b–a) | 7.93 | Average of (b–a) & (d–b): (B) 7.38 |
|
|
|||||||
| 1990–1995, n = 124 | (c) | 53.19 | (d) | 60.02 | (d–c) | 6.83 | Share (B)/(C) 50.1% |
|
|
|||||||
| Estimated change due to shift in relationship | (c–a) | 7.90 | (d–b) | 6.80 | Total change (A) + (B) (C) 14.73 |
||
|
| |||||||
| Average of (c)–(a) & (d–b): (A) 7.35 |
Share (A)/(C) | ||||||
| 49.9% | |||||||
n = number of countries used to estimate the relationships. Estimated life expectancy at birth by country averaged only across developing countries with data in both periods, using annual number of births in the period.
Source: United Nations (1999) for life expectancy at birth; Penn Tables 5.6 for PPPs.
The results of country-specific decompositions averaged by region are shown in Table 3, together with the mortality assumption M1 that represents a slower pace of mortality decline after 1950–1955, consistent with the proportion attributable to increase in average national income in each region. On average for the less developed regions, the pace of mortality decline is reduced by one half (50.1%, Table 1), but the relative importance of economic and other factors varies across regions. The share of actual declines consistent with economic growth is lowest in sub-Saharan Africa (25.5%) and largest in ‘Other LDR-East’ (58.7%). Regional variations are more even in absolute terms, the difference between the prevailing and alternative estimates of life expectancy at birth ranging from ten to fifteen years. While increases in national income accounted for less than half of mortality decline in most regions, the relationship between mortality and national income seems to have changed little, that is merely shifted upward over time. This is reflected in the very narrow estimation band obtained when comparing regional estimates obtained with either the 1962 or the 1992 relationship, the difference in life expectancy at birth being less than one year in 1995–2000 across regions. This finding provides support here for an analytical strategy that can in general be problematic, that is estimating the impact of economic change on mortality change from cross-sectional data.
Table 3.
Decomposition of changes in mortality and fertility, 1950–2000, by region
| Region
|
||||||
|---|---|---|---|---|---|---|
| China | Other LDR-East | India | Other LDR-West | Sub-Saharan Africa | Latin America & the Caribbean | |
| Mortality indicators | ||||||
| Actual e0(0), both sexes, 1950–1955 | 40.8 | 42.8 | 38.7 | 41.9 | 36.6 | 51.4 |
| Actual e0(0), both sexes, 1995–2000 | 69.8 | 69.1 | 62.6 | 63.9 | 51.8 | 69.2 |
| Proportion attributable to increases in PPPs | 0.579 [0.564, 0.595] | 0.587 [0.578, 0.596] | 0.392 [0.382, 0.401] | 0.423 [0.417, 0.430] | 0.255 [0.248, 0.262] | 0.379 [0.378, 0.380] |
| Corresponding e0(0), both sexes, 1995–2000 (M1) | 57.6 [57.1, 58.0] | 58.2 [58.0, 58.5] | 48.1 [47.8, 48.3] | 51.2 [51.1, 51.4] | 40.5 [40.4, 40.6] | 58.1 [58.1, 58.2] |
| Remaining difference M1-actual, 1995–2000 | 12.2 [11.8, 12.7] | 10.9 [10.6, 11.1] | 14.5 [14.3, 14.8] | 12.7 [12.5, 12.8] | 11.3 [11.2, 11.4] | 11.1 [11.0, 11.1] |
| Fertility indicators | ||||||
| Actual pre-transitional TFR (different periods) | 6.06 | 5.94 | 5.97 | 6.58 | 6.72 | 5.97 |
| Actual TFR, 1995–2000 | 1.80 | 2.54 | 3.13 | 3.80 | 5.51 | 2.70 |
| Proportion attributable to increases in PPPs | 0.609 [0.328, 0.890] | 0.516 [0.320, 0.712] | 0.374 [0.206, 0.542] | 0.338 [0.207, 0.469] | 0.321 [0.176, 0.465] | 0.237 [0.180, 0.294] |
| Corresponding TFR, 1995–2000 (F1) | 3.47 [2.27, 4.66] | 4.19 [3.52, 4.85] | 4.91 [4.43, 5.38] | 5.64 [5.28, 6.00] | 6.33 [6.16, 6.51] | 5.20 [5.01, 5.38] |
| Proportion attributable to increases in PPPs and e0(0) | 0.673 [0.369, 0.976] | 0.727 [0.408, 1*] | 0.800 [0.398, 1*] | 0.734 [0.386, 1*] | 1* [0.619, 1*] | 0.453 [0.287, 0.619] |
| Corresponding TFR, 1995–2000 (F2) | 3.19 [1.90, 4.49] | 3.47 [2.54, 4.55] | 3.70 [3.13, 4.84] | 4.54 [3.80, 5.51] | 5.51 [5.51, 5.97] | 4.49 [3.95, 5.03] |
| Difference accounted for by mortality (F1–F2) | 0.27 [0.18, 0.37] | 0.72 [0.30, 0.98] | 1.21 [0.54, 1.30] | 1.10 [0.50, 1.48] | 0.82 [0.54, 0.65] | 0.71 [0.35, 1.06] |
| Remaining difference F2 actual, 1995–2000 | 1.39 [0.10, 2.69] | 0.93 [0*, 2.01] | 0.57 [0*, 1.71] | 0.74 [0*, 1.71] | 0* [0*, 0.46] | 1.79 [1.25,2.33] |
The values in brackets correspond to the estimates obtained with either the 1962 relationship or the 1992 relationship. The value above is the intermediate one used in the projections as described in the text. Values were set to one when a estimated contribution was more than 100% (marked with *).
Fertility decomposition
The estimates for the two periods were the following:
In 1960–1965, the relationship is still weak among developing countries. As very few countries have entered a fertility transition, fertility levels show little association with income and mortality levels (if developed countries are added, however, r2 increases to 0.61). By 1990–1995, the relationship is much stronger. The shift observed by Bongaarts and Watkins is also found here with the increase in the coefficients for both income and mortality levels over time (in absolute terms). For a country with a life expectancy at birth of 60 years and a PPP of $2,000, for example, the predicted TFR would decline from 5.67 in 1960–1965 to 4.40 in 1990–1995.
The fertility decompositions are illustrated in Table 2, with the average across all countries with data for both periods in the less developed regions. The estimated share of fertility change consistent with increases in national income alone as estimated above, is also about one-half, on average for the less developed regions (52.4%, Table 2).
Table 2.
Total fertility decline associated with combinations of national income and mortality change and relationships between national income, life expectancy at birth and total fertility rates, average for the developing countries
| Relationship between national income, life expectancy, and total fertility rates as observed in | Regional income in
|
Estimated change due to increase in income and life expectancy at birth | ||||||
|---|---|---|---|---|---|---|---|---|
| 1962 | 1992 | |||||||
|
| ||||||||
| Actual life expectancy in 1960–1965 | Actual life expectancy in 1990–1995 | |||||||
| 1960–1965, n = 96 | (a) | 6.42 | (b) | 5.22 | (a)–(b) | 1.20 | Average: | 2.25 |
| 1990–1995, n = 66 | (c) | 6.57 | (d) | 3.27 | (c)–(d) | 3.30 | Share: | 71.4% |
| Estimated change due to shift in relationship | (a)–(c) | -0.15 | (b)–(d) | 1.95 | ||||
| Average: | 0.90 | Share: | 28.6% | Total change: | 3.15 | |||
| Relationships as observed in | Life expectancy predicted from 1962 income | Life expectancy predicted from 1992 income | Estimated change due to increase in income alone | |||||
|---|---|---|---|---|---|---|---|---|
| 1960–1965, n = 91 | (e) | 6.72 | (f) | 5.88 | (e)–(f) | 0.84 | Average: | 1.53 |
| 1990–1995, n = 124 | (g) | 6.02 | (h) | 3.79 | (g)–(h) | 2.23 | Share: | 52.4% |
| Estimated change due to shift in relationship | (e)–(g) | 0.70 | (f)–(h) | 2.09 | ||||
| Average: | 1.40 | Share: | 47.6% | Total change: | 2.92 | |||
n = number of countries. Estimated TFR by country averaged across developing countries with data in both periods, using total female population size at mid-period datea.
Source: United Nations (1999, TFR and life expectancy at birth); Penn Tables 5.6 for PPPs.
Predictions (e) and (h) are higher than (a) and (d) because Equation (1) under-predicts the average life expectancy at birth, leading to higher estimates of TFRs. If Equation (1) perfectly predicted life expectancy at birth, (a) would be identical to (e) and (d) would be identical to (h). As expected, (g) is lower than (c) because shifting from the actual life expectancy at birth in 1960–1965 to that predicted from its relationship with national income in 1990–1995 increases life expectancy at birth (from (a) to (c) in Table 1) and lowers the predicted TFR. Similarly, (f) is higher than (b) because the corresponding life expectancy decreases from its actual value (d) to its predicted one (b).
The results of the country-specific decompositions averaged by region are shown in Table 3, together with the fertility assumption F1 that represents a slower pace of fertility decline after 1950–1955, consistent with the proportion attributable to increase in average national income in each region. Regional diversity plays even a greater role than with respect to mortality decline, and regional estimates range from 23.7% in Latin America and the Caribbean to 60.8% in China. With actual mortality rates substituted for the counterfactual rates, fertility rates F2 represent the larger share of the actual fertility declines consistent with prevailing changes in both national income and mortality levels (71.4% on average for the six regions, Table 2). The difference between assumptions F1 and F2 illustrates the fertility decline attributable to faster mortality declines net of increases in national income. When the actual mortality declines are substituted, the contribution of other factors is reduced by about one-fifth of actual fertility declines, from 47.6% to 28.6%.
Regional estimates of the share of past fertility declines attributable to increases in both economic and mortality levels range from 45.3% in Latin America and the Caribbean to 80.0% in India and 100% in sub-Saharan Africa.9 In absolute terms, the other factors are estimated to have had most impact on total fertility rates in Latin America and the Caribbean (−1.79 child per woman). The absolute contribution of other factors in China (−1.39 child per woman) might appear surprisingly low given the strength and documented impact of national population policies. But again what is estimated by comparing prevailing and counterfactual fertility rates is not quite the fertility reduction caused by the other factors.10 The result is in fact consistent with the body of literature suggesting that while national population policies undoubtedly contributed to the exceptionally fast pace of demographic changes in China, some important changes were to be expected even in the absence of such programs (Guo 1996; Lavely & Freedman 1990; Banister 1987; Whyte & Parish 1984). The impact is more moderate in other developing regions (from 0.57 to 0.93 child per woman) and again, none was found in sub-Saharan Africa.
There is yet much more uncertainty in these fertility estimates than in the mortality estimates as revealed by the fairly wide estimation range obtained when either the 1962 or the 1992 relationship is used. This is not too surprising to the extent that in 1962 many countries had not started their fertility decline and the relationship to mortality and income levels was weak, while in 1992 stronger gradients can clearly be observed. As it is likely that this gradient has monotonically strengthened from 1962 to 1992, it is also reasonable to assume that the cumulative impact of, say, economic growth on fertility between 1962 and 1992 is within the range of the estimates obtained from either the 1962 or the 1992 relationship. Comparing the estimated 1995–2000 TFRs in assumption F1 depending on which relationship is used, the largest range is found in China (±1.20) and much more modest ones in other regions (±0.67 in ‘Other LDRs-East’, less in other regions). The estimates of the joint impact of economic and mortality change on fertility (assumption F2) are also quite different depending on the relationship being used. But the net impact of the residual mortality declines that measured by the difference in TFRs F1–F2 is more consistent whether the 1962 or the 1992 relationship is used. The largest range for the net impact of the residual mortality decline across regions is [−1.48; −0.50] in ‘Other LDRs-West’. As further discussed in the sensitivity analysis section below, these extreme values are likely outside any reasonable confidence interval for the exact value of the impact but they do illustrate the lesser precision of the fertility estimation compared to the mortality estimation above.11
Population impact
Population projections translate the counterfactual changes in demographic rates into a population size impact. Table 4 compares the different scenarios: (1) prevailing rates, scenario S0, (2) prevailing mortality and fertility changing according to national income and life expectancy at birth, assumption F2, scenario S2, and (3) rates changing according to increases in national income alone, assumptions M1 and F1, scenario S1. The difference between the two counterfactual scenarios (S2 and S1) translates the impact of the residual mortality decline net of increases in national income. The difference between prevailing demographic changes and the second alternative scenario (S0 and S2) represents the demographic impact of the residual fertility decline net of increases in national income and life expectancy at birth.
Table 4.
Population size in year 2000 by demographic scenario, and absolute and relative differences across scenarios, by region. Population and absolute differences in million, relative differences in percent
| Projection scenario | Region
|
Total developing world | |||||
|---|---|---|---|---|---|---|---|
| China | Other LDR-East | India | Other LDR-West | Sub-Saharan Africa | Latin America & the Caribbean | ||
| Population size
|
|||||||
| Actual demographic change (S0) | 1275.2 | 598.8 | 1006.0 | 839.1 | 617.9 | 527.3 | 4864.3 |
| Fertility decline following economic and mortality change, with actual mortality decline (S2) | 1534.7 | 666.0 | 1061.3 | 881.9 | 617.9 | 644.8 | 5406.7 |
| Demographic change following economic development (S1) | 1356.9 | 635.6 | 961.2 | 798.5 | 522.4 | 609.2 | 4883.9 |
| Difference attributable to faster mortality decline (−S1)
|
|||||||
| Absolute | 177.8 | 30.4 | 100.1 | 83.4 | 95.5 | 35.6 | 522.8 |
| Relative | 13.1 | 4.8 | 10.4 | 10.4 | 18.3 | 5.8 | 10.7 |
| Difference attributable to faster fertility decline (S0–S2)
|
|||||||
| Absolute | −259.5 | −67.2 | −55.3 | −42.8 | – | −117.5 | −542.4 |
| Relative | −16.9 | −10.1 | −5.2 | −4.9 | − | −18.2 | −10.0 |
The scenario S1 consists of the mortality assumption M1 and the fertility assumption F1 described in the text. The scenario S2 consists of the mortality rates that prevailed and the fertility assumption F2 also described in the text. The scenario S0 is the projection that replicates prevailing population change using actual mortality and fertility rates.
Even if residual mortality declines independently induced some fertility reductions, they are expected to have accelerated population growth. The results are consistent with this anticipation; the overall estimated impact of these residual declines is a 10.7% population increase in the less developed regions. Perhaps surprisingly, the estimated impact would be highest in sub-Saharan Africa. Although mortality levels remain high in this region, mortality decline significantly outpaced economic growth and, as a result, population size in year 2000 is 18.3% higher according to these estimates. The impact of the residual mortality decline is also higher than average in China (13.1%), where mortality decline has indeed been exceptionally fast. The decline is least consequential in Latin America and the Caribbean and in the ‘Other LDR-East’, which reflects less the magnitude of mortality reductions in these regions than the fact that substantial reductions would have been expected from economic development alone.
Overall, the mortality impact on population size appears limited given the rapid mortality gains of the less developed regions. Durand’s observation that population growth was due to mortality reductions that were achieved without much economic progress is probably more relevant to earlier periods than for the period under study here. Data were unavailable to begin this analysis at an earlier date in most of the developing world, but high population growth rates in the 1950s readily attest to earlier mortality declines. On average, the less developed regions were already growing at 2.0% per year in the 1950–1955 period. A full account of the demographic impact of the residual mortality decline should rightly include earlier periods – only a truncated effect is captured here. This truncation seems particularly important for Latin America and the Caribbean, where the 1950–1955 average growth rate was already 2.8% per year.12 Even in the second half of the century, the overall effect of accelerated mortality declines might be slightly underestimated. As health interventions with the highest cost effectiveness are typically prioritized by donor agencies, the contribution of non-economic factors can be expected to decline during the transitions, and the evidence is consistent with this expectation (Palloni 1990; Preston 1985). The use of a single ‘average’ estimate per region between the 1960s and the 1990s might be a slight underestimate of the average for 1950–2000, as both the pace of the decline and the non-economic contribution were greater in earlier periods. Even if the procedure led to some underestimation, the limited impact on population size of the mortality shift is largely due to the offsetting effect of the induced fertility reduction (associated with on average one-fifth of recent fertility declines).
The comparison between the prevailing demographic outcomes (scenario S0) and those of the scenario S2 with prevailing mortality but reduced fertility change provides an assessment of the demographic impact of residual fertility reductions. The total impact for the developing regions is about −550 million (−10.0%), a magnitude similar to that of the residual mortality decline. Sharp regional differences exist with respect to the extent that population growth was lowered by residual fertility changes. The corresponding impact of these residual factors on population size is greater in China (16.9%) and in Latin America and the Caribbean (18.2%). But the impact is quite modest (about 5%) in India and the ‘Other LDR-West’ and even estimated to be negligible in sub-Saharan Africa.
With respect to residual fertility declines, the less-developed regions seem to fall into two different groups. In India, Asia west of India, and Africa, these residual factors contributed little to curb population growth (less than 4% on average). Population trends since 1950 seem to correspond largely to what could be expected from economic growth, mortality reductions, and their relationship to fertility change. In other regions (Latin America and the Caribbean, and Asia east of India, including China), the residual factors independently contributing to fertility change were more consequential, resulting in more than 15% decrease in population size, on average, by year 2000. In the first group, a further distinction can be drawn between countries where some fertility decline has taken place within limits consistent with the pace of economic growth and mortality change (some countries in ‘Other LDR-West’)13 and countries where fertility appears quite resistant to these changes (much of sub-Saharan Africa). In the second group, countries might need to be similarly contrasted between those where the impact of other factors was swift (with China as the prototype) and others where their residual impact has been more gradual (some countries in Latin America and the Caribbean).14 Even at the level of large aggregate regions, different pathways to fertility transitions are manifest.
Sensitivity analysis
The results presented in Table 4 correspond to the average estimates of the different contributions to demographic change and to a set of projection assumptions considered most reasonable. They thus represent plausible outcomes, but how different would these results be with different estimates and under different assumptions? The results of the sensitivity analysis presented in Table 5 first suggest more sensitivity to alternative fertility assumptions than to mortality assumptions. This quite general trait of population projections is here reinforced by the larger uncertainty surrounding the estimation of the different contributions to fertility declines than to mortality declines. For the population size of the developing world, different fertility estimates affect the projection by about ±6% by year 2000 in scenario S1, and by about ±10% in scenario S2. The impact of the different mortality estimates is quite modest because the mortality estimates are quite close whether the 1962 or the 1992 relationships are used, as observed above. The age-pattern of mortality has a larger impact yet reaches 2% in sub-Saharan Africa only. In addition, this is obtained by substituting another set of model life tables throughout the entire projection period (1955–2000) while, as discussed, a more reasonable assumption would be the gradual disappearance of specific regional age-pattern of mortality during the projection period. The sensitivity to the age-pattern of fertility is also limited, between 1% and 2% on average in both scenarios.
Table 5.
Absolute change in population size in year 2000 by demographic scenario and absolute differences across scenarios with alternative demographic assumptions, by region (population in million)
| Region
|
|||||||
|---|---|---|---|---|---|---|---|
| China | Other LDR-East | India | Other LDR-West | Sub-Saharan Africa | Latin America & the Caribbean | Total developing world | |
| Projection S2 | 1534.7 | 666.0 | 1061.3 | 881.9 | 617.9 | 644.8 | 5406.7 |
| Change with | |||||||
| Fertility level, 1962 equation | +245.8 | +79.9 | +114.5 | +56.1 | +12.6 | +36.4 | +545.3 |
| Fertility level, 1992 equation | −240.8 | −67.2 | −55.3 | −42.8 | – | −36.5 | −442.6 |
| Fertility age-pattern | +34.9 | +2.4 | +5.2 | +2.0 | – | +18.0 | +62.5 |
| Difference attributed to residual fertility declines (S0–S2) | −259.5 | −67.2 | −55.3 | −42.8 | – | −117.5 | −542.4 |
| Projection S1 | 1356.9 | 635.6 | 961.2 | 798.5 | 522.4 | 609.2 | 4883.9 |
| Change with | |||||||
| Mortality level, 1962 equation | +9.0 | +1.8 | +3.5 | +1.8 | +1.1 | +0.3 | +17.6 |
| Mortality level, 1992 equation | −9.1 | −1.9 | −3.6 | −1.8 | −1.2 | – | −17.6 |
| Mortality age-pattern | −13.0 | −8.2 | +11.5 | −9.4 | +12.8 | +9.5 | +3.1 |
| Fertility level, 1962 equations | +194.6 | +44.1 | +37.5 | +17.9 | +3.8 | +11.1 | +308.9 |
| Fertility level, 1992 equations | −190.2 | −43.1 | −37.4 | −17.2 | −3.7 | −10.9 | −302.5 |
| Fertility age-pattern | +34.6 | +4.2 | +12.3 | +4.3 | −4.0 | +22.9 | +74.2 |
| Difference attributed to residual mortality declines (S2–S1) | 177.8 | 30.4 | 100.1 | 83.4 | 95.5 | 35.6 | 522.8 |
| Change with | |||||||
| Fertility level, 1962 estimate | +51.2 | +35.9 | +76.9 | +38.3 | +8.8 | +25.3 | +236.4 |
| Fertility level, 1992 estimate | −50.6 | −24.1 | −17.9 | −25.6 | +3.7 | −25.6 | −140.1 |
| Fertility age-pattern | +0.3 | −1.7 | −7.1 | −2.3 | +4.0 | −4.8 | −11.8 |
The rest of Table 5 compares these deviations to the estimated impact of residual mortality declines and residual fertility declines. The population size reduction attributed to residual fertility declines (S0–S2, total −542.4 million) appears comparable to the sensibility of the projection based on scenario S2 (from +545.3 million or −442.6 million). The estimated total impact for the less developed regions thus ranges from −100 million to −1.0 billion. Across regions, the estimated net impact of residual fertility declines largely exceeds the uncertainty range in Latin America and the Caribbean only. In relative terms, the estimated proportional change to the population size of the developing world in the year 2000 ranges from 2% to 20%. As discussed, the interval provided by these two simulations does not represent a confidence interval of the outcome but it is extremely likely that the exact value of the impact lies between these two values. The reason is the expectation that the relationship changed gradually (monotonically to be precise) between the two dates. The estimate based on, say, the 1962 value would have been correct had the relationship remained invariant and changed instantly in 1992, or had it began to change in one direction and then bounced back so that the 1962 relationship could represent the average on the 1962–1992 period.
Both descriptions appear unlikely and there emerges some confidence (although not quantifiable in the statistical sense) about the conclusion that the impact of residual fertility declines on population growth up to the year 2000 was limited. The change of the nature of the fertility relationship over time also suggests that residual factors reputed to have an impact on fertility decline may have more influence on the onset of the decline than on the cumulative decline a couple of decades later. The above results that demonstrate a modest impact of residual factors on cumulative population growth up to the year 2000 are thus not incompatible with other studies that emphasized their impact on the onset of fertility decline. Perhaps countries with strong economic and demographic changes but lacking the influence of these residual factors experience a delayed onset of fertility but then catch up with faster declines. If this is the case, this procedure (using the estimated cumulative contribution to reduce prevailing fertility change by the same ratio in each period) slightly underestimates the impact of the residual factors by ignoring their timing effects. It is not necessary to model anew the magnitude of this effect because such a timing effect amounts to assuming that in the absence of these residual effects the transition from the 1962 relationship (i.e., prior to most fertility declines) to the 1992 relationship would have been delayed. The corresponding impact is thus intermediary between the average estimate (10%) and the one obtained with the 1962 relationship throughout (20%). These considerations suggest that the upper half of the range (10–20%) is more likely than the lower half and that the most plausible impact might be slightly a few percentage points higher than computed from a single contribution from the onset to the year 2000.
As for the impact of residual mortality decline, the estimation range is substantially narrower. The estimated impact on the total population of the less developed regions by 2000 (523 million) would increase to 759 million or decrease to 383 million if solely based on the 1962 or the 1992 relationships rather than on a combination of the two. In relative terms, the corresponding interval around the 10.7% estimate is [7.9%,15.6%]. This range represents mostly the uncertainty about the compensating impact of mortality on fertility, however. As discussed above, there are reasons to also suspect that the use of a single estimate for the average contribution of economic growth to mortality declines throughout the 1950–2000 period led to slightly underestimate the impact of residual mortality decline.
Discussion
Should pieces of the ‘shattered’ demographic transition theory be saved?
Until the middle of the twentieth century, most population analysts viewed demographic regimes as dependent on structural changes and population growth as a positive symptom of economic progress. At that time, demographers noted that mortality transitions were under way in areas not experiencing any significant changes in economic conditions, however, and they promptly recognized that sustained population growth would result. For the remainder of this century, whether fertility transitions could also be induced without significant change in the economic environment would become a topic of intense debate. Meanwhile, the threat of a population explosion appeared such that population policies were designed to attempt just that. Family planning programs were aimed at dissociating fertility declines from development in a way much like public health and medicine had allowed the emancipation of mortality declines from development.
The results presented here were not designed as tests of any specific theory, but were intended to document with broad strokes the impact of the main factors behind demographic changes in the less-developed regions over the past half-century. They suggest that relying on increases in national income as the main explanation for demographic transitions accounts for about half of the evidence. This ballpark figure is likely an overestimate since for reasons discussed above, a slight underestimation of both the impacts of residual mortality and fertility declines is suspected. But given the current disregard for the demographic transition theory, even this partial agreement may seem to provide unusual support for the theory’s basic tenets, especially as the growth of the average economic output per person is only a very restrictive measure of structural changes envisioned in the theory.
The second finding is that population growth between 1950 and 2000 was not as much altered by residual mortality decline as most demographers had expected. For the developing regions together, the population increase due to residual mortality declines was estimated slightly above 10%, and the sensitivity analysis ruled out much higher proportions. This is a surprisingly low figure judging from the not-so-remote fears that as a result of these residual mortality declines population growth might far outstrip future economic progress. Again, estimates limited to the second half of the century miss the contribution to population growth of the mortality transitions in earlier periods for some areas and they underestimate somewhat the full effect. But the main reason for this surprising finding appears to be that mortality declines also contributed to fertility declines net of economic factors.
Did mortality decline independently contribute to fertility change?
Regional diversity can not be overemphasized, but on average, residual mortality declines are estimated to have so far contributed about a fifth to fertility transitions. The suggestion that mortality decline substantially contributed to fertility decline stands against most recent accounts of recent fertility changes and thus requires elaboration. It is probably worth re-emphasizing at this point that the contributions estimated in this model are not symptoms of the causal relationships whose search animates most of demographic research. I would argue with Mason (1997) that much research on fertility transitions has focussed on too narrow a time scale and too narrowly on the precise causes of the onset of fertility decline. The emphasis here is not so much what caused fertility to decline when it did, but how much of the past fertility transitions would have been expected to occur by the end of the twentieth century, regardless of their possibly different onsets and paces, based on the prevailing mortality declines.
On this reframed issue, a non-negligible contribution of mortality change to recent fertility transitions was found, on average. This association between mortality and fertility levels could be spurious if some third factor not included in the analysis contributed to both mortality and fertility declines. The argument prima facie is particularly appealing for social change – female education in particular – but also for family planning, since these services were often bundled with those of public health, coordinated programmatically and integrated logistically. If a consensus emerges at all from the wealth of past studies on mortality and fertility declines, it would be that while a direct, independent effect of mortality change on fertility change is often found to be weak, ‘child survival and family planning programs play important complementary roles’ (Cohen & Montgomery 1998: 29). With a simple, parsimonious model as the one chosen here, such possibilities can never be ruled out.
The regional results do not suggest, however, that the estimated relationships were contaminated in that way. In spite of a swift mortality decline, the contribution of mortality to total fertility decline is only estimated at 0.27 child per woman in China, where social change and family planning programs were strong, but the estimate is 1.10 in the ‘Other LDR-West’, and 0.82 even in sub-Saharan Africa, regions where plausible confounding factors were weaker (Table 3). While well aware of the diversity of past transitions and of the coarseness of an approach that might have somewhat inflated some of the regional averages, I would like cautiously to advance that there was more independent effect of mortality change on fertility than usually recognized.15 Even the minimum estimates suggest that residual mortality decline may have contributed up to 50% to fertility decline in sub-Saharan Africa, 20% in India and ‘Other LDRs-West’, while the impact is small but non-zero in the other three regions.
Were family planning programs successful?
With about half of fertility transitions attributable to increases in national income and about another 20% attributable to residual mortality declines, roughly 30% of recent fertility declines in the less developed regions remains to be accounted for. The particular impact of family planning programs has been hotly debated in the literature, but rarely translated into a population impact. Evaluating the impact in terms of population size rather than in the customary terms of program targets (e.g., increase in contraceptive use) is more relevant to the initial rationale of past population policies. Even though the policy rationale has changed considerably, at least explicitly, the initial ambition of most programs was less to provide services to deprived individuals than to reduce an alarming population growth fueled by mortality decline. A notable exception is Bongaarts, Mauldin & Philips (1990) advancing the figure of 700 million less people in year 2000 due to family planning programs. The residual assessment of 540 million derived here cannot be fully attributed to such programs as many other factors could have influenced fertility levels – female education to name only one. This assessment of the residual contribution of ‘other factors’ is based on the estimated relational shift between fertility levels and indicators of development, a shift that Bongaarts & Watkins (1996) observe even in countries with weak or non-existent family planning programs. While family planning programs do not account for all the effect attributed to residual factors in the above analyses, they could be credited for part of the effect of mortality on fertility to the extent that they also contributed to reduce mortality (the spuriousness argument above). In addition, their impact on population might be underestimated since, as discussed, only cumulative fertility changes were assessed, not the possible effects on the timing of fertility decline. Even so, the figure of 700 million for the impact of family planning programs alone seems high compared to an upper bound of 1.0 million for the impact of all residual factors suggested by the sensitivity analysis.16
Another limitation of the above procedure is to ignore potential feedback effects, namely the impact that a different population growth than the prevailing one might have had on economic growth or on population policies related to mortality and fertility change. The positive impact of slower population growth on economic development largely remains an open research issue, however, and the direction of the corresponding bias, if any, is not easily anticipated.17 A clearer implication of this assumption common to most assessments of family planning programs is that the above estimates of reduction in population growth cannot be used as any ex post demonstration of the potential economic benefits of these programs, as often incorrectly implied. Since the empirical estimations underpinning these simulations held prevailing economic growth unchanged, the results cannot be turned around to demonstrate any positive effect on development.
As long as economic growth is treated as exogenous to demographic trends, the impact of the different factors can only be discussed in purely demographic terms. To that effect, the translation of the contribution of different sets of factors on demographic change into a population size effect provides a common gauge to compare mortality and fertility decline. As argued here, one of the theoretical foundation of engineering fertility reductions in the developing world was to put its demographic growth ‘back on track’ after mortality declines had spurred a demographic growth unrelated to economic development. From that perspective, the impact of non-economic factors of fertility decline was found to reduce the population size of the less-developed regions by about 10% in year 2000, and thus, on average, to nearly balance out the impact of the residual mortality declines. By that standard, social changes that contributed to these residual fertility reductions have been on average ‘successful’. That the relative impacts of residual mortality and fertility declines seems to have almost exactly counteracted one another should perhaps not be overemphasized due to the uncertainty of the estimation procedures. Experiences across the less-developed regions are also quite different and the average conceals wide disparities. Only in about one-half of these regions did residual fertility decline have an impact comparable to, or larger than that of residual mortality decline.
Overall, in spite of the uncertainty of the estimation and the regional heterogeneity, the analyses presented here may contribute to a recently emerging interest in homeostasis among demographers discussed by Wilson & Airey (1999; also see Mason 1997; Hirschman 1994). These results suggest a different type of homeostasis, however, not one that restores the initial population size but one that contributes to bring population growth back on the growth path consistent with increases in national income.
Acknowledgments
Successive drafts of this paper benefited from discussions with and comments from Donald Bogue, Thomas DiPrete, Noreen Goldman, Joshua Goldstein, Michel Guillot, Pierre Martinot-Lagarde, Antonio McDaniel, Jane Menken, Alberto Palloni, Samuel Preston, Ross Stolzenberg, Marta Tienda, James Trussell, Etienne van de Walle, and Kazuo Yamaguchi. I would also like to thank Ira Elliott for his excellent editing.
Footnotes
The first United Nations projections did not go beyond year 1980, but Woytinsky (1958) extrapolated these projections to 2000. According to his computations, the early United Nations projections suggested that world population would reach 3.8 billion (based on the United Nations 1951 assessment) or perhaps 4.3 billion (based on the 1954 assessment) in the year 2000. The author also cites projections by Greiling (1954) of world population ‘on the assumption of population growth in different areas at a constant annual rate.’ Even those projections only reached a world population size of 4.6 billion in the year 2000, suggesting that the actual population growth in some of the ‘different areas’ was significantly underestimated at the time.
The view summarized here by Durand has been expressed since 1955 by many others. For example, see Stolnitz (1955) or Davis (1956) as quoted in Hodgson (1988: 544).
The most recent period for which life expectancy estimates are available at this writing is 1990–1995 (in most cases 1995–2000 indicators are projected from previous trends but not estimated from actual data yet). These estimates were compared to the PPPs for 1992 with updated data for 1992 (Penn World Tables, Mark 5.6) from the website of the National Bureau for Economic Research, www.nber.org/pwt56.html. As in Preston (1975), the early 1990s relationship was compared to that estimated thirty years earlier by relating the 1960–1965 life expectancies at birth and 1962 PPPs.
I used a slightly different specification from Preston’s in that he used a constant numerator value (80 years), while the numerators here are estimated from the data and the estimated value allowed to change between the 1960s and the 1990s. The rationale for fixing the numerator was that changes might be bound by some asymptotic upper value but the validity of this assumption is now questionable in view of recent further declines in mortality.
For a discussion of several approaches to average life expectancy at birth, see Lutz & Scherbov (1992). For TFRs, the number of women of reproductive age by country may appear as a more appropriate weight but the proportion of all women that are of reproductive age is fairly invariant across populations (Preston, Heuveline & Guillot 2001: 94).
This approach implicitly assumes that other factors only influences the pace of fertility decline after its onset but not the time of that onset. A more realistic analysis would also incorporate the potential impact on the timing of the onset of fertility decline as well. Bongaarts & Watkins (1996) show that the onset of fertility decline has occurred at lower economic development over time. The issue is further discussed in the sensitivity analysis section below, but also see Mason (1997) on the excessive attention paid to predicting the exact timing of the onset of fertility declines.
A further example might be in order with respect to the distinction made here. Imagine that based on economic changes between 1960 and 1990, life expectancy at birth is predicted to increase, say, from 60 years to 65 years. Other factors have quite possibly caused life expectancy to raise to 65 years before any economic growth occurred. In this case then, economic growth did not cause life expectancy gains. But we still predict that it would have raised life expectancy by five years had there not been other factors. In designing the counterfactual projections, this hypothetical contribution is what matters, not the actual cause of mortality change.
As there is no constant in the estimated three-parameter logistic function, the r2 coefficient is high but does not carry the usual meaning. The fit of the regression can nevertheless be assessed from the correlation between the predicted life expectancy and the actual values: 0.811 for the 1960s and 0.897 for the 1990s.
The actual estimates for sub-Saharan Africa were above 100%, that is the TFR predicted from national income and life expectancy at birth estimates with the 1960–1965 relationship was 5.08, lower than the actual TFR (5.51). Residual factors could arguably have contributed to increase fertility levels in the region and to resist rather than to contribute to their decline. An overestimation appeared more likely and the contribution was thus set at 100% and the corresponding TFR at 5.51.
For instance Feeney & Wang (1993) found that about 70% of the 1970–1977 fertility decline was explained by policy alone. As noted by the authors and explained above in Note 7, the fertility change attributable to policy alone declines over time and the authors estimate 50% of the 1970–1987 decline to be attributable to policy alone. Our 30-year estimate is lower still (23%), in part because of the longer timeframe. It is also possible that increases in national income contributed more to the later declines from 2.34 in 1987 to about 1.8 today.
There is one apparent anomaly in the estimation range for the contribution of residual mortality decline to fertility decline in sub-Saharan Africa, with the average estimate (−0.82) being higher than both the 1962 and the 1992 estimate (−0.54 and −0.65 respectively). This is because both the 1962–1992 average estimate and the 1992 estimate of the contribution of economic growth and mortality decline were above 100% (see Note 9), and both were set to one. Contrary to what would happen with the actual estimates, the difference with the contribution of economic growth alone then becomes larger for the average estimates than for the 1992 estimates.
Data are in fact available for some countries in Latin America and the Caribbean in the earlier part of the century and for some of them a slow, gradual mortality decline can be observed as early as 1900 (Palloni 1990).
For an example of country that seems to fit this characterization, take Iran as described by Raftery, Lewis & Aghajanian (1995).
For these particular countries, as mentioned in the text, more gradual effects might signal that those began before the period 1950–2000, in particular for mortality decline whose impact on fertility would then be underestimated while the residual effect of ‘other’ factors would then be overestimated.
While this is not the dominant view, the actual record is actually quite mixed. On today’s developing world see, for instance, Palloni (1990), on Latin America, and Kuate Defo (1998) on Africa. As for the historical data, the argument that mortality didn’t play a role rests largely on the respective timing of fertility change in France and in Great Britain. The veracity of this time-proven truth is challenged by recent evaluation of fertility declines both in France (Bonneuil 1997) and in Great Britain (Szreter & Garrett 2000). Also see the assessment in Galloway et al. (1998).
Note that the figure corresponds to an estimate that family planning programs reduced total fertility rates by 1.2 births per women in 1980–1985. In a more recent paper, Bongaarts (1995) estimates that the family planning programs have reduced total fertility rates by 0.96 births per woman in 1985–1990. Although the author does not translate the latter estimate into population impact, the corresponding figure should be more compatible with the estimates derived here (Table 3, bottom row).
A plausible positive impact of slower population growth on economic growth would lead to our overestimating the contribution of economic change on fertility levels since we used prevailing economic change in the counterfactual simulations. For example, Creenshaw, Ameen & Christenson (1997) showed that economic development was hindered by the growth of the population under age 15 and stimulated by the growth of the population above that age. Since the former is clearly related to fertility levels, however, their argument is just as vulnerable to possible reverse causation as ours. Much of the recent evidences provided about the benefits of fertility reduction on economic growth have come from Southeast Asian countries. Besides a recent crisis that casts doubts on economic development being much affected by demographic factors, the timing of economic growth and fertility decline in these countries do not fit the argument very well, except for the late 1980s–early 1990s, indeed a period of rapid growth following rapid fertility change. If fertility change is assumed to have no immediate effects but only lagged effects on economic development, the economic levels used in the above analyses might be too high only in the last one of the three decades covered there (1962–1992).
References
- Alter G. Theories of fertility decline: A non-specialist’s guide to the current debate. In: Gillis JR, Tilly LA, Levine D, editors. The European experience of declining fertility, 1850–1970: The quiet revolution. Cambridge, MA: Blackwell; 1992. pp. 13–35. [Google Scholar]
- Bairoch P. Du tiers-monde aux tiers-mondes: Convergence et clivages. Population. 1992;47(6):1485–1504. [Google Scholar]
- Banister J. China’s changing population. Stanford: Stanford University Press; 1987. [Google Scholar]
- Berelson B, Anderson R, Harkavy O, Maier J, Mauldin WP, Segal S. Family planning and population programs: A review of world development. Chicago: University of Chicago Press; 1966. [Google Scholar]
- Bogue DJ, Tsui AO. Population Bulletin. 4. Vol. 33. Washington: Population Reference Bureau; 1978. Declining world fertility: Trends, causes, implications. [PubMed] [Google Scholar]
- Bogue DJ, Tsui AO. A reply to Paul Demeny’s ‘On the end of the population explosion’. Population and Development Review. 1979;5(3):479–494. [Google Scholar]
- Bongaarts J. The impact of population policies: Comment. Population and Development Review. 1994;20(3):616–620. [Google Scholar]
- Bongaarts J. Working Papers, No. 71. New York: The Population Council; 1995. The role of family planning programs in contemporary fertility transitions. [Google Scholar]
- Bongaarts J, Mauldin WP, Philips JF. The demographic impact of family planning programs. Studies in Family Planning. 1990;21(6):299–310. [PubMed] [Google Scholar]
- Bongaarts J, Watkins SC. Social interactions and contemporary fertility transitions. Population and Development Review. 1996;22(4):639–682. [Google Scholar]
- Bonneuil N. Transformations of the French demographic landscape, 1806–1906. Oxford: Clarendon Press; 1997. [Google Scholar]
- Caldwell J. The global fertility transition: The need for a unifying theory. Population and Development Review. 1997;23(4):803–812. [Google Scholar]
- Cannan E. The probability of a cessation of the growth of population in England and Wales during the next century. The Economic Journal. 1895;5:505–515. [Google Scholar]
- Cleland J, Wilson C. Demand theories of the fertility transition: An iconoclastic view. Population Studies. 1987;41(1):5–30. [Google Scholar]
- Cohen B, Montgomery MR. In: Introduction. Montgomery MR, Cohen B, editors. 1998. pp. 1–38. (1998) [Google Scholar]
- Crenshaw EM, Ameen AZ, Christenson M. Population dynamics and economic development: Age-specific population growth rates and economic growth rates in developing countries, 1965 to 1990. American Sociological Review. 1997;62(6):974–984. [Google Scholar]
- Davis K. Human society. New York: Macmillian; 1948. [Google Scholar]
- Davis K. The amazing decline of mortality in underdeveloped areas. American Economic Review. 1956;46(2):305–318. [Google Scholar]
- Davis K. The theory of change and response in modern demographic history. Population Index. 1963;29(4):345–366. [PubMed] [Google Scholar]
- Demeny P. On the end of the population explosion. Population and Development Review. 1979a;5(1):141–162. [Google Scholar]
- Demeny P. On the end of the population explosion: A rejoinder. Population and Development Review. 1979b;5(3):495–504. [Google Scholar]
- Demeny P. Social science and population policy. Population and Development Review. 1988;18(3):451–47. doi: 10.1111/j.1728-4457.2011.00386.x. [DOI] [PubMed] [Google Scholar]
- Durand J. World population trend and prospect. In: Hauser PM, editor. Population and World Politics. The Free Press of Glencoe; 1958. pp. 27–37. [Google Scholar]
- Ehrlich P. The population bomb. New York: Ballantine Books; 1968. [Google Scholar]
- Feeney G, Feng W. Parity progression and birth intervals in China: The influence of policy in hastening fertility decline. Population and Development Review. 1993;19(1):61–101. [Google Scholar]
- Galloway PR, Lee RD, Hammel EA. In: Infant mortality and the fertility transition. Montgomery MR, Cohen B, editors. 1998. pp. 182–226. (1998) [Google Scholar]
- Greiling W. Wie werden wir Leben? Ein Buch von den Aufgaben unserer Zeit. Düsseldorf: Econ-Verlag; 1954. [Google Scholar]
- Guo S. Determinants of fertility decline in Shanghai: Development or policy? In: Goldstein A, Feng W, editors. China: The many facets of demographic change. Boulder, CO: Westview Press; 1996. pp. 81–96. [Google Scholar]
- Heuveline P. The global and regional impact of mortality and fertility transitions, 1950–2000. Population and Development Review. 1999;25(4):681–702. doi: 10.1111/j.1728-4457.1999.00681.x. [DOI] [PubMed] [Google Scholar]
- Hirschman C. Why fertility changes. Annual Review of Sociology. 1994;20:203–233. doi: 10.1146/annurev.so.20.080194.001223. [DOI] [PubMed] [Google Scholar]
- Hodgson D. Demography as social science and policy science. Population and Development Review. 1983;9(1):1–34. [Google Scholar]
- Hodgson D. Orthodoxy and revisionism in American demography. Population and Development Review. 1988;14(4):541–569. [Google Scholar]
- Hodgson D. The ideological origins of the Population Association of America. Population and Development Review. 1991;17(1):1–34. [Google Scholar]
- Hodgson D, Watkins SC. Feminists and neo-Malthusians: Past and present alliances. Population and Development Review. 1997;23(3):469–523. [Google Scholar]
- Keyfitz N. Introduction to the mathematics of population. Reading, MA: Addison-Wesley; 1968. [Google Scholar]
- Keilman N. How accurate are the United Nations world population projections? In: Lutz W, Vaupel JW, Ahlburg DA, editors. Frontiers of population forecasting, A supplement to Population and Development Review. Vol. 24. New York: Population Council; 1998. pp. 15–41. [Google Scholar]
- Kuate Defo B. In: Fertility response to infant and child mortality in Africa with special reference to Cameroun. Montgomery MR, Cohen B, editors. 1998. pp. 254–315. (1998) [Google Scholar]
- Landry A. La révolution démographique: études et essais sur les problèmes de la population. Paris: Librairie du Recueil Sirey; 1934. [Google Scholar]
- Lavely W, Freedman R. The origins of the Chinese fertility decline. Demography. 1990;27(3):357–367. [PubMed] [Google Scholar]
- Lutz W, Scherbov S. Sensitivity of aggregate period life expectancy to different averaging procedures. Population Bulletin of the United Nations. 1992;33:32–46. [PubMed] [Google Scholar]
- Mason KO. Explaining fertility transitions. Demography. 1997;34(4):443–454. [PubMed] [Google Scholar]
- Montgomery MR, Cohen B, editors. From death to birth: Mortality decline and reproductive change. Washington, DC: National Academy Press; 1998. [PubMed] [Google Scholar]
- Notestein FW. Population – the long view. In: Schultz Theodore W., editor. Food for the world. Chicago: University of Chicago Press; 1945. [Google Scholar]
- Palloni A. Fertility and mortality decline in Latin America. Annals of the American Academy of Political and Social Sciences. 1990;510:126–144. [Google Scholar]
- Potts M. Sex and the birth rate: Human biology, demographic change, and access to fertility-regulation methods. Population and Development Review. 1997;23(1):1–39. [Google Scholar]
- Preston SH. The changing relation between mortality and level of economic development. Population Studies. 1975;29(2):231–48. [PubMed] [Google Scholar]
- Preston SH, editor. The effects of infant and child mortality on fertility. New York: Academic Press; 1978. [Google Scholar]
- Preston SH. Causes and consequences of mortality declines in less developed countries during the twentieth century. In: Easterlin RA, editor. Population and economic change in developing countries. Chicago: University of Chicago Press; 1980. pp. 289–329. [Google Scholar]
- Preston SH. Mortality and development revisited. Population Bulletin of the United Nations. 1985;18:34–40. [PubMed] [Google Scholar]
- Preston SH, Heuveline P, Guillot M. Demography: measuring and modeling population processes. Oxford: Blackwell Publishers; 2001. [Google Scholar]
- Pritchett LH. Desired fertility and the impact of population policies. Population and Development Review. 1994;20(1):1–55. [Google Scholar]
- Raftery AE, Lewis SM, Aghajanian A. Demand or ideation? Evidence from the Iranian marital decline. Demography. 1995;32(2):159–182. [PubMed] [Google Scholar]
- Shryock HS, Siegel JS. The methods and materials of demography. Washington, DC: United States Government Printing Office; 1975. [Google Scholar]
- Stolnitz GJ. A century of international mortality trends: I. Population Studies. 1955;9(1):24–55. [Google Scholar]
- Summers R, Heston A. The Penn world table (Mark 5): An expanded set of international comparisons, 1950–1988. Quarterly Journal of Economics. 1991;106(2):327–368. [Google Scholar]
- Szreter S. The idea of demographic transition and the study of fertility change: A critical intellectual history. Population and Development Review. 1993;19(4):659–701. [Google Scholar]
- Szreter S, Garrett E. Reproduction, compositional demography, and economic growth: Family planning in England long before the fertility decline. Population and Development Review. 2000;26(1):45–80. [Google Scholar]
- Thompson WS. Population. American Journal of Sociology. 1929;34:959–975. [Google Scholar]
- Tsui AO, Hermalin AI, Bertrand JT, Knowles J, Stover J, Stewart KJ. Evaluation Project Working Papers WP-O-08. 1993. Evaluating family planning program impact: Needed initiatives on a persisting question. [Google Scholar]
- United Nations. Population Studies No.28. New York: United Nations; 1958. The future growth of world population. [Google Scholar]
- United Nations. World population prospects: The (1998) revision. New York: United Nations; 1999. [Google Scholar]
- Whelpton PK. Population of the United States, 1925–1975. The American Journal of Sociology. 1928;31:253–270. [Google Scholar]
- Whelpton PK. An empirical method for calculating future population. Journal of the American Statistical Association. 1936;31:457–473. [Google Scholar]
- Whyte MK, Parish WL. Urban life in contemporary China. Chicago: University of Chicago Press; 1984. [Google Scholar]
- Wilson C, Airey P. How can a homeostatic perspective enhance demographic transition theory. Population Studies. 1999;53(2):117–128. [Google Scholar]
- Wilmoth JR, Ball P. The population debate in American popular magazines, 1946–1990. Population and Development Review. 1992;18(2):631–668. [Google Scholar]
- Woytinsky WS. World resources in relation to population. In: Hauser Philip M., editor. Population and World Politics. The Free Press of Glencoe; 1958. pp. 46–75. [Google Scholar]