

Significance
The livestock sector contributes significantly to global warming through greenhouse gas (GHG) emissions. At the same time, livestock is an invaluable source of nutrition and livelihood for millions of poor people. Therefore, climate mitigation policies involving livestock must be designed with extreme care. Here we demonstrate the large mitigation potential inherent in the heterogeneity of livestock production systems. We find that even within existing systems, autonomous transitions from extensive to more productive systems would decrease GHG emissions and improve food availability. Most effective climate policies involving livestock would be those targeting emissions from land-use change. To minimize the economic and social cost, policies should target emissions at their source—on the supply side—rather than on the demand side.
Keywords: productivity, food security, marginal abatement cost, deforestation, mathematical programming
Abstract
Livestock are responsible for 12% of anthropogenic greenhouse gas emissions. Sustainable intensification of livestock production systems might become a key climate mitigation technology. However, livestock production systems vary substantially, making the implementation of climate mitigation policies a formidable challenge. Here, we provide results from an economic model using a detailed and high-resolution representation of livestock production systems. We project that by 2030 autonomous transitions toward more efficient systems would decrease emissions by 736 million metric tons of carbon dioxide equivalent per year (MtCO2e⋅y−1), mainly through avoided emissions from the conversion of 162 Mha of natural land. A moderate mitigation policy targeting emissions from both the agricultural and land-use change sectors with a carbon price of US$10 per tCO2e could lead to an abatement of 3,223 MtCO2e⋅y−1. Livestock system transitions would contribute 21% of the total abatement, intra- and interregional relocation of livestock production another 40%, and all other mechanisms would add 39%. A comparable abatement of 3,068 MtCO2e⋅y−1 could be achieved also with a policy targeting only emissions from land-use change. Stringent climate policies might lead to reductions in food availability of up to 200 kcal per capita per day globally. We find that mitigation policies targeting emissions from land-use change are 5 to 10 times more efficient—measured in “total abatement calorie cost”—than policies targeting emissions from livestock only. Thus, fostering transitions toward more productive livestock production systems in combination with climate policies targeting the land-use change appears to be the most efficient lever to deliver desirable climate and food availability outcomes.
Livestock are the source of 33% of the protein in human diets and, especially in developing countries, provide many other services such as traction, manure, risk management, and regular income (1–3). At the same time, 30% of the global land area is used for livestock rearing, and expansion of the sector is a major driver of land-use change (4). Between 1980 and 2000, 83% of agricultural land expansion in the tropics occurred at the expense of forests, and livestock were a major contributor (5). Livestock contribute also 80% of all agricultural non-CO2 emissions (6), which makes them responsible for about 12% of all anthropogenic greenhouse gas (GHG) emissions (7).
Continued population and economic growth will double total demand for calories of animal origin by 2050 (8). Satisfying future food demand using a business-as-usual production model will lead to serious environmental problems. Consumption either has to be reduced, or considerable productivity gains must be achieved, if the sustainability of the global food system is to be increased (9–11). Large-scale quantitative assessments of the effects on land use and GHG emissions of human diets with reduced meat content agree on the expected benefits from such a change in consumer preferences (11–13). Historically, though, it has been productivity improvements rather than reduced consumption that have led to equilibrium in agricultural markets (14).
Yield improvements in the crop sector over the past 50 y have reduced real commodity prices, led to 86% less cropland expansion, and avoided emissions of some 590 billion metric tons of carbon dioxide equivalent (GtCO2e), compared with the situation without productivity increases (15). The livestock sector has also seen productivity increases (16, 17). For instance, in Brazil, one of the epicenters of land-use change, 79% of beef production growth between 1950 and 2006 came from productivity gains which in turn saved 525 Mha of land (18). Some argue that feasible increases in livestock productivity could lead to land saving in the future as well (11). This could be achieved through feeding practices that include less grazing and better quality feeds (19), improved breeding, reproductive efficiency and health interventions (20), and improved grassland management (21). Such practices lead to transitions from low-input low-output systems (i.e., extensive rangeland systems) to more efficient and productive livestock systems (i.e., mixed crop-livestock and industrial livestock systems). Although the nature of these transitions differs between regions, they are generally induced by changes in relative factor prices; because of the increased population density, land values are growing faster than the economic opportunity cost of labor. These processes have been well documented in livestock systems (22, 23) and are predicted to occur also in the future (24). Transitions to more efficient livestock production systems present an attractive mitigation opportunity for reducing CH4 and N2O emissions per unit of livestock product, while at the same time increasing productivity (25, 26).
Here we investigate the role of livestock production system transitions (LPSTs) in achieving climate policy targets. Existing classification schemes of global livestock production systems recognize large diversity in management practices within each region (27, 28). Herrero et al. (29) provide the first systematic quantification of global livestock systems in terms of feed use, feed conversion efficiency, land productivity, and non-CO2 emission intensity. They distinguish eight production systems for ruminants and two production systems for monogastrics. We focus on ruminants because they represent more than 80% of total livestock-related GHG emissions (29, 30). Ruminant production systems are classified along two dimensions: (i) feed composition moving from grass-based diets in grazing systems to greater shares of concentrates in mixed crop-livestock systems and landless systems, and (ii) the agroecology gradient which goes from arid through humid to temperate/tropical highland systems (for more detail on the system classification, see Methods). In what follows, LPSTs refer to changes in the relative distribution of animals between grazing and mixed systems within the same agroecological zone.
The importance of distinguishing between grazing systems and mixed crop-livestock systems for forward-looking analysis has already been recognized (9). However, the available data did not allow the authors to consider more than two aggregate livestock production systems. Here, we use the dataset by Herrero et al. (29) in a comprehensive economic model Global Biosphere Management Model (GLOBIOM). GLOBIOM has been used in the past for global integrated assessments of crop and bioenergy production that focus on future land-use change, water requirements, and GHG emissions (31–35). This model provides a detailed description of production possibilities at a high spatial resolution, taking into account the availability of grazing areas and fodder as well as various crop feed mixes across systems and regions. Therefore, we are able to simulate livestock system transitions endogenously in response to socioeconomic drivers and climate change mitigation policies.
We designed a set of scenarios to help disentangle the complex relationships between livestock, GHG emissions, and food supply. First, we implemented a baseline scenario to 2030 (DYN) that represents a dynamic livestock sector capable of responding to economic drivers by adapting the structure of production systems to the changing environment. The demand system is calibrated to closely mimic food demand projections by the Food and Agriculture Organization (Rome) (FAO) (6). To quantify the contribution of autonomous LPSTs to climate change mitigation, a counterfactual scenario (FIX) was developed in which the relative distribution of ruminants across the different livestock production systems was kept as it was in 2000, whereas consumption levels were identical to those in the dynamic scenario. Integrated policy development covering emissions from the agricultural and land-use change sectors is being considered under the United Nations Framework Convention on Climate Change (36). Therefore, in a second step, we investigate the role of LPSTs in reducing emissions from the agricultural and land-use change sectors under explicit mitigation policies. Different levels of mitigation incentives were simulated using a range of prices for carbon. Finally, we discuss the impacts of our mitigation strategies on food availability, and demonstrate the asymmetry between food supply-side and demand-side approaches to mitigation.
Results
LPSTs Contribute to GHG Emission Reductions.
Economic growth is expected to lead to a significant rise in demand for livestock products. We project demand for monogastric meat and eggs to increase the most, by 63% between 2000 and 2030, and ruminant meat and milk demand to increase by 44% and 55%, respectively; all of these outstrip expected population growth (34%) because of dietary shifts in developing countries.
To meet this additional food demand, the ruminant herd would increase by 37% under DYN. LPSTs taking place in this scenario would lead to a larger increase in the number of ruminants reared in mixed systems compared with the reference scenario, FIX, in which the relative distribution of ruminants across the different systems remains the same in each region as in 2000 (Fig. 1). As a result, under DYN, 64% of all ruminants would be reared in mixed systems in 2030 compared with 56% of ruminants in 2000. Only 18% of ruminants would be kept in grazing systems by 2030, compared with 20% of ruminants in 2000. The remaining 18% of ruminants would be in other (OTH) and urban (URB) systems (SI Appendix, Fig. S1). The direction and speed of these autonomous LPSTs are consistent with historical observations (9).
Fig. 1.
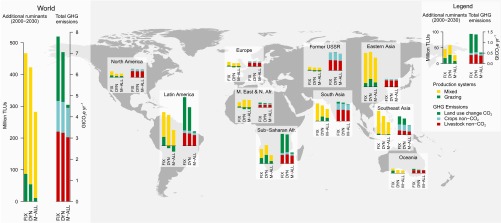
Change in ruminant numbers from 2000 to 2030 and total annual GHG emissions from agriculture and land use change over the period 2010–2030 globally and by region for the fixed system scenario (FIX), the dynamic production system scenario (DYN), and the mitigation scenario with dynamic production systems and a carbon price of US$10 per tCO2e applied to emissions from both agricultural and land-use change sectors (M-ALL). y-axis scales are the same in all graphs. TLU, tropical livestock unit (i.e., an adult animal of 250 kg weight).
These LPSTs will lead to substantial GHG emission reductions. Total agricultural and land-use change emissions under DYN average at 7.1 GtCO2e⋅y−1 over the period 2010–2030 (Fig. 1). Non-CO2 emissions from livestock production represent 46% of the total emissions, with methane emissions from enteric fermentation being the most important source with 2.0 GtCO2e⋅y−1. Carbon dioxide emissions from land-use change represent 33% of total emissions (see SI Appendix, Table S1 for detailed results by region and category). Total emissions in DYN are 9% lower than in FIX, saving 736 million metric tons of carbon dioxide equivalent per year (MtCO2e⋅y−1). The emission reductions occur mainly through land sparing; CO2 emissions from land-use change are reduced by 23% compared with the FIX scenario, whereas the reduction in direct non-CO2 (methane and N oxide) emissions is modest (<5%).
Land Sparing Is an Important Outcome of the Production System Transitions.
The feed-use efficiency of mixed systems is in general, for the same agroecological zone, higher than that of grazing systems (SI Appendix, Fig. S2). LPSTs can therefore improve the output-to-feed ratio for meat and milk (Fig. 2, x axis). The global effect of these transitions—DYN compared with FIX—is modest (3% feed productivity increase for ruminant meat and less than 1% productivity increase for milk by 2030), but it is substantial in some regions. For example, for ruminant meat, +19% in sub-Saharan Africa and +11% in Latin America; or for milk, +19% in Southeast Asia and +11% in the Middle East and North Africa.
Fig. 2.

Projected feed and land productivity changes in (A) ruminant meat and (B) milk production. Productivity was normalized to year 2000 values. The origin of the arrows represents productivity in 2030 under the FIX scenario and the location of the arrowhead points to productivity levels in the DYN scenario. Feed productivity is defined as the relative change in tons of protein produced per dry matter ton of feed. Land productivity is defined as the relative change in tons of protein produced per hectare of grassland and feed cropland. The arrows do not start from the y axis because of the composition effects across the 30 GLOBIOM regions, species (bovines–small ruminants), and production types (dairy–other).
A gain in feed productivity is one of the two components of land productivity increases. The other component is increased forage productivity. Increased forage productivity can occur through intensification or through relocation of fodder production to higher yielding land. Between FIX and DYN, land productivity increased by 4% for ruminant meat and by 9% for milk globally by 2030 (Fig. 2, y axis). The increase was particularly strong in Latin America, and in regions of Africa and Asia, which experienced productivity improvements in the range of 15% to 30%. In most regions, changes in feed and land productivity were positively correlated. In Eastern Asia, land productivity increased through allocation of a small share of ruminants to high-yielding grasslands although feed productivity decreased.
LPSTs resulted in a global decrease in grass consumption of 3% but an increase in feed grain consumption by 3% (SI Appendix, Fig. S3). These modest changes in feed requirements have substantial impacts on land-use change (SI Appendix, Fig. S4). Under DYN, croplands expanded globally by 105 Mha over the period 2000–2030, which was 14 Mha more than under the counterfactual FIX scenario. However, over the same period 176 Mha of pastures were spared under DYN compared with FIX. Consequently, conversion of 56 Mha of forest and 106 Mha of other natural land would be avoided. The higher land productivity would also improve food availability through reduced milk and meat prices (−23% globally under DYN compared with FIX in 2030; SI Appendix, Fig. S5).
Targeting Emissions from Land-Use Change Improves Effectiveness and Efficiency of Mitigation Policies.
Autonomous mitigation through LPSTs allows for substantial GHG savings. However, larger mitigation efforts would require economic incentives or regulations to generate further abatement. Fig. 1 shows the effect of a global mitigation policy applied to both agricultural and land-use change emissions (M-ALL) in the form of a carbon price of US$10 per tCO2e in 2030 (a detailed description of the mitigation policies is provided in Methods and SI Appendix). This corresponds to the price necessary to stabilize the radiative forcing at 4.5 W⋅m−2 by 2100 (37) which would limit the global temperature increase to 2.4 °C (37, 38). Under this policy, annual emissions from agriculture and land-use change are reduced by 3,223 MtCO2e from the reference level (FIX) over the period 2010–2030. Reduction of emissions due to avoided deforestation and other land-use change constitutes 90% of the total. Reduction of direct emissions from the agricultural sector represents 10% of the total abatement (Fig. 3A). Fifty percent of the total abatement takes place in Latin America, 27% in sub-Saharan Africa, and 13% in Southeast Asia (SI Appendix, Fig. S6). Livestock system transitions actively contribute to mitigation, with a larger share of animals in the mixed systems, particularly the more intensive systems in the temperate zones and tropical highlands (SI Appendix, Fig. S1).
Fig. 3.

GHG emission abatement decomposed by (A) emission source and (B) mitigation mechanism for different carbon price scenarios applied in the dynamic livestock sector scenario, DYN. The values are calculated as the difference in annual average emissions under the mitigation scenario and the reference scenario, FIX, over the period 2010–2030. “NONE” corresponds to the autonomous mitigation without a climate policy. Two levels of carbon price are displayed: US$10 and US$100 per tCO2e. Mitigation policies are implemented alternatively to livestock non-CO2 emissions (M-LVS), to total agricultural non-CO2 emissions (M-AGR), to land-use change CO2 emissions (M-LUC), and to all agricultural and land-use change emissions (M-ALL).
At a carbon price of US$10 per tCO2e, mitigation policies that target the non-CO2 emissions only from the livestock sector (M-LVS) or the non-CO2 emissions from the entire agricultural sector (M-AGR) would lead to a total reduction of annual emissions by 1,049 and 1,152 MtCO2e, respectively (Fig. 3A). Under both policies, the reduction of non-CO2 emissions from the agricultural sector would represent about 15%, whereas land-use change would represent 85% of the total emissions abated. In contrast, at the same carbon price, mitigation policies targeting only the CO2 emissions from land-use change (M-LUC) would lead to a reduction of annual emissions by 3,068 MtCO2e, or 95% of the emissions abated compared with policies targeting both agricultural and land-use change sectors (M-ALL). Marginal abatement cost (MAC) curves provide further insight into economic abatement potential globally and at the regional level (SI Appendix, Fig. S7).
The Role of Livestock System Transitions in Emission Reductions Depends on the Level of the Carbon Price and Which Emissions Sector Is Targeted by the Policies.
Transitions in livestock systems are one of many complex and interlinked adjustments that occur in the global food system and help to achieve reductions in GHG emissions. Using a decomposition method described in SI Appendix, we calculated that under the mitigation scenario (M-ALL), LPSTs would contribute 21% of the total abatement of 3,223 MtCO2e⋅y−1 (Fig. 3B), intra- and interregional relocation of livestock production another 40%, and all other mechanisms would add only 39%. The relative importance of LPSTs as a mitigation mechanism is highest when carbon prices are low and when emissions from land-use change are not subject to mitigation policies. When land-use change emissions are targeted by GHG abatement policies (M-LUC and M-ALL), it is more economical to relocate livestock production from regions with high rates of deforestation to other regions rather than to rely on local LPSTs. Where policies focus only on the non-CO2 emissions from the agricultural sector (M-LVS and M-AGR), the contribution of LPSTs also declines with increasing carbon price, but as all regions are affected, international trade only has a minor contribution to the mitigation. The majority of the mitigation would come from demand-side adjustments in these cases. In the M-AGR scenario, changes in diets contribute 2,002 MtCO2e⋅y−1 at a price of US$100 per tCO2e, raising the question of what the impacts of such policies would be on food availability.
Supply-Side Policies Have Lower Calorie Cost than Demand-Side Policies.
Changes in diets are considered to be an effective GHG mitigation option in developed countries (39, 40). In contrast, mitigation options that would induce reduction in consumption could lead to further malnutrition or undernutrition in the developing world. For this reason, the calorie cost of mitigation, defined as the difference in food availability with and without a mitigation policy, should be considered in tandem with the economic cost when evaluating climate mitigation policies that affect food production. Fig. 4 presents what we term the “total abatement calorie cost” (TACC) curve, where the level of consumption change induced by a particular policy is plotted on the y axis against the level of GHG abatement on the x axis. Our results show that a mitigation policy targeting the agricultural and land-use change sectors with a carbon price of US$10 per tCO2e would lead to a total food availability loss of 40 kcal per capita per day, of which animal calories would account for 10 kcal. At a price of US$100 per tCO2e, the global calorie cost reaches around 200 kcal per capita per day. At that carbon price level, the impact on consumption is still small in developed regions (a reduction of 2–3% only in Europe and North America), where food demand is less sensitive to price changes. In contrast, developing countries would face significant reductions in food availability: 13% in Southeast Asia (because of high demand and its sensitivity to the price of rice); 8% in Eastern Asia; and 7% in South Asia, sub-Saharan Africa, and Latin America. Regional TACC curves (SI Appendix, Fig. S8) illustrate that there is not a direct relationship between the amount of abatement and the loss in calorie availability at the regional level. Even in regions where almost no abatement takes place, calorie consumption decreases because of the impact of the carbon price on agricultural prices (SI Appendix, Fig. S5).
Fig. 4.

TACC curves for mitigation policies targeting different sectors on the supply-side through carbon price (thick lines) or targeting the demand-side through consumption reduction (thin dotted line). Plain thick lines indicate the loss of total food calories and dashed thick lines the loss of animal calories only. GHG abatement is calculated as the difference between emissions under scenario DYN with a climate policy and emissions from the reference scenario FIX without climate policy. Data points correspond to carbon prices of US$0, US$5, US$10, US$20, US$50, and US$100 per tCO2e. The demand-side curve represents the abatement resulting from restricting consumption to levels calculated under the ALL mitigation policy, M-ALL, but without a carbon price.
When targeting only specific emission sources, a climate mitigation policy that targets the land-use change (M-LUC) is the most efficient, not only from the economic cost perspective as discussed above but also from a calorie cost perspective. For an abatement level of about 2.5 GtCO2e⋅y−1, targeting the non-CO2 emissions from the livestock sector (M-LVS) instead of land-use change would increase the calorie cost by more than 50%. Still, targeting the livestock sector appears less inefficient from the food availability perspective than targeting agriculture as a whole. This is because of the low share of animal calories in human diets (less than 20% on average). Targeting the livestock sector also allows for compensation of the reduction in animal calories through an increase in consumption of vegetal calories which become cheaper than under DYN (SI Appendix, Fig. S5).
We can compare the impact of these mitigation policies with the effect of an equivalent reduction in food consumption as considered in other studies (7, 12, 13). Fig. 4 shows that, for instance, under the mitigation scenario M-ALL with US$10 per tCO2e we predict a reduction of annual emissions from agriculture and land-use change of 3,223 MtCO2e⋅y−1 at a calorie cost of 40 kcal per capita per day, i.e., an average unit calorie cost of 12 kcal per capita per day per GtCO2e⋅y−1. Under an exogenously prescribed consumption reduction scenario of 40 kcal per capita per day without carbon prices, the emission reduction is predicted to be only 1,948 MtCO2e⋅y−1, and the resulting unit calorie cost would increase to 21 kcal per capita per day per GtCO2e⋅y−1. The emission reductions achieved under such a demand-side policy are, depending on the level of calorie availability decrease, 30–80% less effective in reducing emissions than its supply-side policy equivalent. This means that demand-side policies would require substantially higher calorie reductions to achieve the same mitigation levels than policies directly targeting emissions from agriculture and land-use change on the producer side.
Discussion
Transitions to More Efficient and Less Land-Demanding Livestock Systems Provide Significant Emission Savings.
Even without mitigation policies, LPSTs could save 736 MtCO2e⋅y−1 by 2030. With mitigation policies in place, they would be the mechanism behind up to 70% of total abatement depending on the sector targeted and the level of the carbon price. Changes in relative factor prices are recognized as the most important driver of livestock system transitions (22, 23). Also in our model, the relative land price is the major driver of the projected developments. In reality, however, many barriers exist to the adoption of modified systems; education and market access are recognized as fundamental enabling conditions (23). Hence, transitions projected under our dynamic scenario will occur only in a favorable policy environment that promotes considerable investment in market infrastructure for livestock products, inputs, and service provision (1, 41). On the other hand, there are considerable challenges associated with the intensification of livestock production, such as sanitary issues and animal well-being concerns, as well as social impacts related to the role of smallholders in livestock production and to the various cobenefits of livestock in rural areas, such as draft power and subsistence income (1, 39). Safeguards need to be in place to limit the potential negative social or environmental effects of future developments in the livestock sector.
International Cooperation Is Necessary to Achieve Ambitious Mitigation Targets.
Along with LPSTs, regional and international livestock production reallocations appear to be an important pathway for reducing GHG emissions from the livestock sector. Together with system transitions, reallocations could lead to around 60% of the abatement of emissions from agriculture and land-use change. Regional reallocation contributes mainly through improved land management, which provides more productive land to animals and reduces the carbon footprint from grassland and feed cropland expansion (42). International trade adds the benefit of using more productive livestock systems in other parts of the world. Here we have considered only the option of system shifts within the systems currently available in each region. This choice was motivated by the fact that each region has its own specificities, which may prevent systems in one region being completely suited to another. Nevertheless, there are many technology and management options that could be transferred to developing regions and lower the mitigation cost as well as reduce the impact on food availability. Mitigation policies have been previously shown to accelerate innovation also in other sectors (43).
Climate Change Mitigation Impacts on Food Availability Will Largely Depend on the Concrete Policy Design.
LPSTs can reduce emissions significantly and contribute to lowering food prices. At the same time, simple climate policies are projected to reduce food consumption in some developing regions. Economically efficient solutions that maximize the amount of GHG abatement at a certain carbon price, such as those presented here, may have important social costs in terms of decreased food availability. Mitigation policies for the agricultural sector need to be designed with particular care and creativity, and may need to be accompanied by systematic evaluation of their social effects in order not to adversely affect the poor.
For the same level of abatement, supply-side policies that directly target the different sources of emissions at their source lead to substantially lower food availability losses than the demand-side policies considered by some authors (12, 13). This is mainly because of the cobenefits arising from reductions in land-use change emissions under supply-side policies which the demand-side policies are unable to capture. On the other hand, each calorie is not the same, and demand-side policies would certainly focus on those developed regions characterized by overconsumption. Such demand-side policies would then have no negative effect on the poor, and could even have a positive one if they lowered food prices. Nevertheless, the outcome of such policies in terms of GHG emission reductions remains uncertain.
Reducing Emissions from Land-Use Change Is a Promising Way Forward.
Our analysis suggests that mitigation policies are most effective when they target land-use change. This is true in terms of both cost efficiency and minimization of negative effects on consumption. Targeting land-use change will achieve 95% of the maximum abatement resulting from a comprehensive mitigation policy, which includes all land-related emission sources and sinks. Few national policy processes recognize the key role of livestock in reducing pressure on land expansion and direct emissions; this includes those designed to reduce emissions from deforestation and forest degradation, such as Brazil’s low-carbon agriculture program (44). Livestock sector policies need to be coordinated—providing appropriate financial incentives, facilitating institutional change for rural development, and implementing novel technology diffusion mechanisms, for instance—if desirable food security and social and environmental outcomes are to be achieved in concert.
Methods
Modeling Approach.
The analysis is carried out using the GLOBIOM (31), a global partial equilibrium model integrating the agricultural and forestry sectors in a bottom-up setting based on detailed gridcell information. GLOBIOM is run recursively in 10-y time steps starting in 2000 to analyze global issues related to land-use competition between major land-based production sectors up to 2030. Demand and international trade are represented at the level of 30 economic regions (SI Appendix, Table S2). Economic concepts are based on a spatial equilibrium modeling approach (45, 46). The model determines optimal land and resource allocation by maximizing the sum of consumer and producer surplus, and provides associated prices. Below we present briefly the most important features of the modeling approach but all of them are developed in greater detail in SI Appendix.
Land Use, Crops, Grasslands, and Forest.
The supply side of the model is based on a detailed disaggregation of land into simulation units—clusters of 5 arc-minute pixels belonging to the same country, altitude, slope, and soil class and to the same 30 arc-minute pixel (47). The productivity of crops, grasslands, forests, and short-rotation tree plantations is estimated together with the related environmental parameters (GHG budgets, nitrogen leaching), at the level of simulation units. For crops, yields under different management systems are estimated using a biophysical model, the Environmental Policy Integrated Climate (EPIC) model (48). For forest, we use downscaled information from a well-established dynamic forest management model, the Global Forest Model (49). Grassland productivity is obtained by combining results of two different models, EPIC and CENTURY (50), depending on the regional species distribution and management practices.
Livestock Production Systems.
The way in which the livestock sector is represented constitutes a particular feature of GLOBIOM: the model fully incorporates the updated International Livestock Research Institute/FAO production systems classification (27–29). For ruminants, we represent the 11 production systems from this nomenclature with 8 aggregates: grazing systems (LG) are included as in the classification, whereas mixed rainfed systems (MR) and mixed irrigated systems (MI) are merged into a single mixed systems class (MX). The second dimension is the agroecological zone (A, arid and semiarid; H, humid and semihumid; T, tropical highlands and temperate). OTH and URB systems are also preserved in the model but, as these are very heterogeneous groups as compared with the well defined grazing and mixed systems, their livestock numbers are kept constant. Livestock production system parameterization relies on the dataset by Herrero et al. (29).
GHG Emissions.
GHG stocks and flows (CO2, CH4, N2O) are detailed for enteric fermentation, manure management, manure on pasture, manure applied to soils, synthetic fertilizers, rice cultivation, deforestation, and other land-use change.
Baseline Assumptions.
The model is run for the 2000–2030 period under an exogenous population scenario based on “shared socioeconomic pathway” scenario no. 2 (or “middle of the road”) (51). World population is assumed to reach 8.2 billion in 2030 and average income per capita to almost double over the same period. Food demand per capita increases by 7% to 2030 following dietary patterns proposed by the FAO (8). Consumption in GLOBIOM also responds endogenously to price variations in the baseline.
Scenarios.
Two alternative scenarios are set up which differ in the dynamics of the livestock sector. In the DYN scenario, expansion of each livestock system can take place freely within each country, based on relative cost efficiency with respect to sources of feed, and future demand. Intensification or extensification can therefore occur through shifts in the system mix of the region, with corresponding changes in productivity and GHG emission intensity. A counterfactual scenario, FIX, is in the model implemented through a constraint that fixes at the regional and local level the relative distribution of ruminants across the production systems at values observed for 2000. Production growth in FIX can thus occur only through interregional relocation and pure expansion. To improve comparability of the two cases, food demand in FIX was kept at the level calculated under the DYN scenario.
Four mitigation scenarios were developed and simulated through a carbon price penalizing GHG emissions equally in all regions: (i) M-LVS applies the carbon price to non-CO2 emissions from livestock production only, (ii) M-AGR targets non-CO2 emissions from both livestock and crop production, (iii) M-LUC penalizes the CO2 emissions from deforestation and other land-use changes only, and (iv) M-ALL applies the carbon price to emissions from both the agricultural and land-use change sectors. These mitigation scenarios are simulated using a carbon price in the range of US$5 to US$100 per tCO2e, the usual range considered for mitigation policies at horizon 2030 (37).
Supplementary Material
Acknowledgments
The work presented in this article has been supported by the European Union-funded projects Impact Quantification of Global Changes (GLOBAL-IQ) (Grant 266992) and An integration of mitigation and adaptation options for sustainable livestock production under climate change (ANIMALCHANGE) (Grant 266018), and by the Consultative Group on International Agricultural Research Program on Climate Change, Agriculture and Food Security.
Footnotes
The authors declare no conflict of interest.
This article is a PNAS Direct Submission.
This article contains supporting information online at www.pnas.org/lookup/suppl/doi:10.1073/pnas.1308044111/-/DCSupplemental.
References
- 1.Herrero M, et al. Smart investments in sustainable food production: Revisiting mixed crop-livestock systems. Science. 2010;327(5967):822–825. doi: 10.1126/science.1183725. [DOI] [PubMed] [Google Scholar]
- 2.Moll HAJ. Costs and benefits of livestock systems and the role of market and nonmarket relationships. Agric Econ. 2005;32(2):181–193. [Google Scholar]
- 3.Vandamme M, D’Haese M, Speelman S, D’Haese L. In: The Role of Livestock in Developing Communities: Enhancing Multifunctionality. Swanepoel F, Stroebel A, Moyo S, editors. Wageningen, The Netherlands: Technical Centre for Agricultural and Rural Cooperation; 2010. pp. 107–121. [Google Scholar]
- 4.Geist HJ, Lambin EF. Proximate causes and underlying driving forces of tropical deforestation. Bioscience. 2002;52(2):143–150. [Google Scholar]
- 5.Gibbs HK, et al. Tropical forests were the primary sources of new agricultural land in the 1980s and 1990s. Proc Natl Acad Sci USA. 2010;107(38):16732–16737. doi: 10.1073/pnas.0910275107. [DOI] [PMC free article] [PubMed] [Google Scholar]
- 6.Tubiello FN, et al. The FAOSTAT database of greenhouse gas emissions from agriculture. Environ Res Lett. 2013;8(1):015009. [Google Scholar]
- 7.Westhoek H, et al. The Protein Puzzle. The Hague: PBL Netherlands Environmental Assessment Agency; 2011. [Google Scholar]
- 8.Alexandratos N, Bruinsma J. World Agriculture Towards 2030/2050: The 2012 revision. Rome: Food Agriculture Organization; 2012. [Google Scholar]
- 9.Bouwman AF, der Hoek KWV, Eickhout B, Soenario I. Exploring changes in world ruminant production systems. Agric Syst. 2005;84(2):121–153. [Google Scholar]
- 10.IAASTD . International Assessment of Agricultural Knowledge, Science and Technology for Development. Island Press, Washington, DC: International Assessment of Agricultural Knowledge, Science, and Technology for Development; 2009. [Google Scholar]
- 11.Wirsenius S, Azar C, Berndes G. How much land is needed for global food production under scenarios of dietary changes and livestock productivity increases in 2030? Agric Syst. 2010;103(9):621–638. [Google Scholar]
- 12.Stehfest E, et al. Climate benefits of changing diet. Clim Change. 2009;95(1-2):83–102. [Google Scholar]
- 13.Popp A, Lotze-Campen H, Bodirsky B. Food consumption, diet shifts and associated non-CO2 greenhouse gases from agricultural production. Glob Environ Change. 2010;20(3):451–462. [Google Scholar]
- 14.Evenson RE, Rosegrant MW. In: Crop Variety Improvement and Its Effect on Productivity: The Impact of International Agricultural Research. Evenson RE, Gollin D, editors. Wallington, UK: CABI; 2003. pp. 473–497. [Google Scholar]
- 15.Burney JA, Davis SJ, Lobell DB. Greenhouse gas mitigation by agricultural intensification. Proc Natl Acad Sci USA. 2010;107(26):12052–12057. doi: 10.1073/pnas.0914216107. [DOI] [PMC free article] [PubMed] [Google Scholar]
- 16.Steinfeld H, Gerber P. Livestock production and the global environment: Consume less or produce better? Proc Natl Acad Sci USA. 2010;107(43):18237–18238. doi: 10.1073/pnas.1012541107. [DOI] [PMC free article] [PubMed] [Google Scholar]
- 17.Thornton PK. Livestock production: Recent trends, future prospects. Philos Trans R Soc Lond B Biol Sci. 2010;365(1554):2853–2867. doi: 10.1098/rstb.2010.0134. [DOI] [PMC free article] [PubMed] [Google Scholar]
- 18.Martha GB, Jr, Alves E, Contini E. Land-saving approaches and beef production growth in Brazil. Agric Syst. 2012;110(0):173–177. [Google Scholar]
- 19.Johnson KA, Johnson DE. Methane emissions from cattle. J Anim Sci. 1995;73(8):2483–2492. doi: 10.2527/1995.7382483x. [DOI] [PubMed] [Google Scholar]
- 20.Gill M, Smith P, Wilkinson JM. Mitigating climate change: The role of domestic livestock. Animal. 2010;4(3):323–333. doi: 10.1017/S1751731109004662. [DOI] [PubMed] [Google Scholar]
- 21.Thornton PK, Herrero M. Potential for reduced methane and carbon dioxide emissions from livestock and pasture management in the tropics. Proc Natl Acad Sci USA. 2010;107(46):19667–19672. doi: 10.1073/pnas.0912890107. [DOI] [PMC free article] [PubMed] [Google Scholar]
- 22.McIntire J, Bourzat D, Pingali P. Crop Livestock Interaction in Sub-Saharan Africa. Washington: World Bank; 1992. [Google Scholar]
- 23.Baltenweck I, et al. Crop-Livestock Intensification and Interaction Across Three Continents. Addis Ababa, Ethiopia: International Livestock Research Institute; 2003. [Google Scholar]
- 24.Devendra C, Swanepoel FJC, Stroebel A, van Rooyen CJ. In: The Role of Livestock in Developing Communities: Enhancing Multifunctionality. Swanepoel FJC, Stroebel A, Moyo S, editors. Wageningen, The Netherlands: Technical Centre for Agricultural and Rural Cooperation; 2010. [Google Scholar]
- 25.Smith P, et al. Greenhouse gas mitigation in agriculture. Philos Trans R Soc Lond B Biol Sci. 2008;363(1492):789–813. doi: 10.1098/rstb.2007.2184. [DOI] [PMC free article] [PubMed] [Google Scholar]
- 26.Jones CA, Sands RD. Impact of agricultural productivity gains on greenhouse gas emissions: A global analysis. Am J Agric Econ. 2013;95(5):1309–1316. [Google Scholar]
- 27.Seré C, Steinfeld H. World Livestock Production Systems: Current Status, Issues and Trends. Rome: Food Agriculture Organization; 1996. [Google Scholar]
- 28.Robinson TP, et al. Global Livestock Production Systems. Rome: Food Agriculture Organization; International Livestock Research Institute; 2011. [Google Scholar]
- 29.Herrero M, et al. Biomass use, production, feed efficiencies, and greenhouse gas emissions from global livestock systems. Proc Natl Acad Sci USA. 2013;110(52):20888–20893. doi: 10.1073/pnas.1308149110. [DOI] [PMC free article] [PubMed] [Google Scholar]
- 30.Hristov AN, et al. Mitigation of Greenhouse Gas Emissions in Livestock Production—A review of Technical Options for Non-CO2 Emissions. Rome: Food Agriculture Organization; 2013. [Google Scholar]
- 31.Havlík P, et al. Global land-use implications of first and second generation biofuel targets. Energy Policy. 2011;39(10):5690–5702. [Google Scholar]
- 32.Schneider UA, et al. Impacts of population growth, economic development, and technical change on global food production and consumption. Agric Syst. 2011;104(2):204–215. [Google Scholar]
- 33.Smith P, et al. Competition for land. Philos Trans R Soc Lond B Biol Sci. 2010;365(1554):2941–2957. doi: 10.1098/rstb.2010.0127. [DOI] [PMC free article] [PubMed] [Google Scholar]
- 34.Kraxner F, et al. Global bioenergy scenarios—Future forest development, land-use implications, and trade-offs. Biomass Bioenergy. 2013;57:86–96. [Google Scholar]
- 35.Valin H, et al. Agricultural productivity and greenhouse gas emissions: Trade-offs or synergies between mitigation and food security? Environ Res Lett. 2013;8(3):035019. [Google Scholar]
- 36.Beddington JR, et al. Agriculture. What next for agriculture after Durban? Science. 2012;335(6066):289–290. doi: 10.1126/science.1217941. [DOI] [PubMed] [Google Scholar]
- 37.Fisher BS, et al. 2007. Issues related to mitigation in the long term context (Chapter 3). Climate Change 2007: Mitigation. Contribution of Working Group III to the Fourth Assessment Report of the Intergovernmental Panel on Climate Change, eds Metz B, Davidson OR, Bosch PR, Dave R, Meyer LA (Cambridge Univ Press, Cambridge, UK)
- 38.Rogelj J, Meinshausen M, Knutti R. Global warming under old and new scenarios using IPCC climate sensitivity range estimates. Nature Climate Change. 2012;2(4):248–253. [Google Scholar]
- 39.Garnett T. Livestock-related greenhouse gas emissions: Impacts and options for policy makers. Environ Sci Policy. 2009;12(4):491–503. [Google Scholar]
- 40.Smith P, et al. How much land-based greenhouse gas mitigation can be achieved without compromising food security and environmental goals? Glob Change Biol. 2013;19(8):2285–2302. doi: 10.1111/gcb.12160. [DOI] [PubMed] [Google Scholar]
- 41.McDermott JJ, Staal SJ, Freeman HA, Herrero M, de Steeg JAV. Sustaining intensification of smallholder livestock systems in the tropics. Livest Sci. 2010;130(1–3):95–109. [Google Scholar]
- 42.West PC, et al. Trading carbon for food: Global comparison of carbon stocks vs. crop yields on agricultural land. Proc Natl Acad Sci USA. 2010;107(46):19645–19648. doi: 10.1073/pnas.1011078107. [DOI] [PMC free article] [PubMed] [Google Scholar]
- 43.Hascic I, Watson F, Johnstone N, Kaminker C. 2012. Recent trends in innovation in climate change mitigation technologies. Energy and Climate Policy: Bending the Technological Trajectory, ed Organisation for Economic Co-operation and Development (OECD Publishing, Paris, France)
- 44. Angelo C (August 2, 2012) Brazil’s fund for low-carbon agriculture lies fallow. Nature, 10.1038/nature.2012.11111.
- 45.Takayama T, Judge GG. Spatial and Temporal Price and Allocation Models. Amsterdam: North-Holland; 1971. [Google Scholar]
- 46.Schneider UA, McCarl BA, Schmid E. Agricultural sector analysis on greenhouse gas mitigation in US agriculture and forestry. Agric Syst. 2007;94(2):128–140. [Google Scholar]
- 47.Skalsky R, et al. 2008. GEO-BENE global database for bio-physical modeling. Concepts, methodologies, and data. Technical Report (International Institute for Applied Systems Analysis, Laxenburg, Austria), Version 1.0.
- 48.Williams JR. 1995. The EPIC model. Computer Models of Watershed Hydrology, ed Singh VP (Water Resources Publications, Highlands Ranch, CO) Chap 25, pp 909–1000.
- 49.Kindermann G, et al. Global cost estimates of reducing carbon emissions through avoided deforestation. Proc Natl Acad Sci USA. 2008;105(30):10302–10307. doi: 10.1073/pnas.0710616105. [DOI] [PMC free article] [PubMed] [Google Scholar]
- 50.Parton WJ, et al. Observations and modeling of biomass and soil organic-matter dynamics for the grassland biome worldwide. Global Biogeochemical Cycles. 1993;7:785–809. [Google Scholar]
- 51.O'Neill BC, et al. 2012. Meeting Report of the Workshop on the Nature and Use of New Socioeconomic Pathways for Climate Change Research. (National Center for Atmospheric Research, Boulder, CO)
Associated Data
This section collects any data citations, data availability statements, or supplementary materials included in this article.