Significance
The transmembrane helices of single-span membrane proteins are commonly engaged in oligomeric interactions that are essential for structure and function. These interactions often occur in the form of recurrent structural motifs. Here we present an analysis of one of the most important motifs (GASright), showing that its geometry is optimized to form carbon hydrogen bonds at the helix−helix interface. The analysis reveals the structural basis for its characteristic GxxxG sequence signature. We built upon the analysis, creating a method that predicts known GASright structures at near-atomic precision. The work has implications for understanding membrane protein association, and for the prediction of unknown interacting GASright dimers among the thousands of single-span proteins in the proteomes of humans and higher organisms.
Keywords: interaction motifs, protein prediction
Abstract
Carbon hydrogen bonds between Cα–H donors and carbonyl acceptors are frequently observed between transmembrane helices (Cα–H···O=C). Networks of these interactions occur often at helix−helix interfaces mediated by GxxxG and similar patterns. Cα–H hydrogen bonds have been hypothesized to be important in membrane protein folding and association, but evidence that they are major determinants of helix association is still lacking. Here we present a comprehensive geometric analysis of homodimeric helices that demonstrates the existence of a single region in conformational space with high propensity for Cα–H···O=C hydrogen bond formation. This region corresponds to the most frequent motif for parallel dimers, GASright, whose best-known example is glycophorin A. The finding suggests a causal link between the high frequency of occurrence of GASright and its propensity for carbon hydrogen bond formation. Investigation of the sequence dependency of the motif determined that Gly residues are required at specific positions where only Gly can act as a donor with its “side chain” Hα. Gly also reduces the steric barrier for non-Gly amino acids at other positions to act as Cα donors, promoting the formation of cooperative hydrogen bonding networks. These findings offer a structural rationale for the occurrence of GxxxG patterns at the GASright interface. The analysis identified the conformational space and the sequence requirement of Cα–H···O=C mediated motifs; we took advantage of these results to develop a structural prediction method. The resulting program, CATM, predicts ab initio the known high-resolution structures of homodimeric GASright motifs at near-atomic level.
The transmembrane (TM) domains of membrane proteins that span the bilayer with a single helix are commonly engaged in oligomeric interactions that are essential for the structure and function of these proteins (1). The interaction between these TM helices are often mediated by recurrent structural motifs, which are characterized by specific geometries and display sequence signatures in the form of specific amino acid patterns (2). In this work, we present a geometric analysis of one of the most important structural motifs, and implement a method for its structural prediction. The primary feature of this motif is the presence of interhelical carbon hydrogen bonds that occur across the helix−helix interface between Cα–H donors and backbone carbonyl oxygen acceptors (Cα–H···O=C bonds) (3). The sequence “signature” is the occurrence of glycine and other small amino acids (Ala, Ser) at the helix−helix interaction interface, generally spaced at i, i+4 to form patterns such as GxxxG, AxxxG, GxxxA, etc. (4). These small amino acids are important to reduce the steric barrier for bringing the backbones of the opposing helices in close proximity, allowing the Cα and carbonyl oxygen (two backbone atoms) to come in contact and form hydrogen bonds (3).
Although Cα–H···O=C hydrogen bonds can be observed in right- and left-handed TM helical pairs and in both parallel and antiparallel orientations, they are most frequently associated with parallel right-handed pairs with a crossing angle around −40° (3). This structural motif has been named GASright by Walters and DeGrado, from its sequence signature (Gly, Ala, Ser) and its crossing angle (2). GASright—the fold of the glycophorin A TM dimer—is the most frequent motif for pairs of parallel helices, and it appears to be extremely frequent in twofold symmetrical homodimers of single-pass proteins. Indeed, out of approximately a dozen high-resolution TM homodimers solved to date, as many as five are representatives of the GASright motif (5). However, whether Cα–H hydrogen bonds indeed represent a major stabilizing force in GASright motifs has yet to be demonstrated.
Carbon hydrogen bonds are commonly observed in proteins and nucleic acids, where they can contribute to protein structure, recognition, or catalysis (6). Although carbons are generally weak donors, the Cα atom of all amino acids is activated by the electron withdrawing amide groups on both sides, and quantum calculations suggest that the energy of Cα–H hydrogen bonds may be as much as one-third to half of that of canonical donors in vacuum (7, 8). Carbon hydrogen bonds have been proposed to be particularly important in membrane proteins, the membrane being a low-dielectric environment that, in principle, should enhance their strength (3). However, obtaining an experimental measurement of their contribution remains difficult. To date, two groups have addressed this question experimentally, with differing results. Arbely and Arkin calculated a favorable contribution of −0.88 kcal/mol for the carbon hydrogen bond formed by Gly-79 in glycophorin A, using isotope-edited IR spectroscopy (9). Conversely, Bowie and coworkers found that a Cα–H···O bond to the side chain hydroxyl group of Thr-24 was only marginally stabilizing or even slightly destabilizing in a folding study of bacteriorhodopsin variants (10). Mottamal and Lazaridis were able to reconcile this discrepancy by analyzing the different hydrogen bonding geometries of the two systems (11). Further quantum calculations performed on geometries from protein crystal structures also suggested that indeed the orientation of the groups can determine whether an interaction may be strongly favorable or unfavorable (12).
More studies are certainly needed to fully understand the energetic contribution of Cα–H hydrogen bonds in membrane protein folding and interaction. However, their common occurrence as structural elements in membrane proteins postulates that they play an important role (3, 13). To further investigate this issue, we present an analysis of the propensity for Cα–H hydrogen bond formation as a function of helical geometry in symmetric homodimers. Remarkably, the analysis reveals the existence of a single high-propensity conformation that corresponds to the common GASright motif. By defining a suitable frame of reference for the geometries, we were able to investigate the specific sequence requirements of each position at the helix−helix interface. The results rationalize the occurrence of GxxxG patterns in GASright, and provide a physical explanation for the typical right-handed geometry of the motif based on steric interactions and optimization of hydrogen bonding. Overall, the analysis suggests a strong causal link between the high frequency of occurrence of GASright and its propensity for Cα–H hydrogen bond formation.
The analysis defines a map of the conformational space that allows the formation of networks of carbon hydrogen bonds between helical dimers. It also identified strict sequence dependencies at specific positions of each individual geometry. Based on this information, we have also created a rapid structural prediction method for the identification of Cα–H···O=C mediated homodimers, which we call CATM (Cα TransMembrane). We show that CATM can predict the known high-resolution structures of homodimeric GASright motifs at near-atomic level. Interestingly and perhaps surprisingly, we found that a minimalistic set of energy functions composed of a hydrogen bonding and a van der Waals function is sufficient for achieving a highly accurate level of prediction.
Results and Discussion
Geometric Definition Based on the Unit Cell of the Helical Lattice.
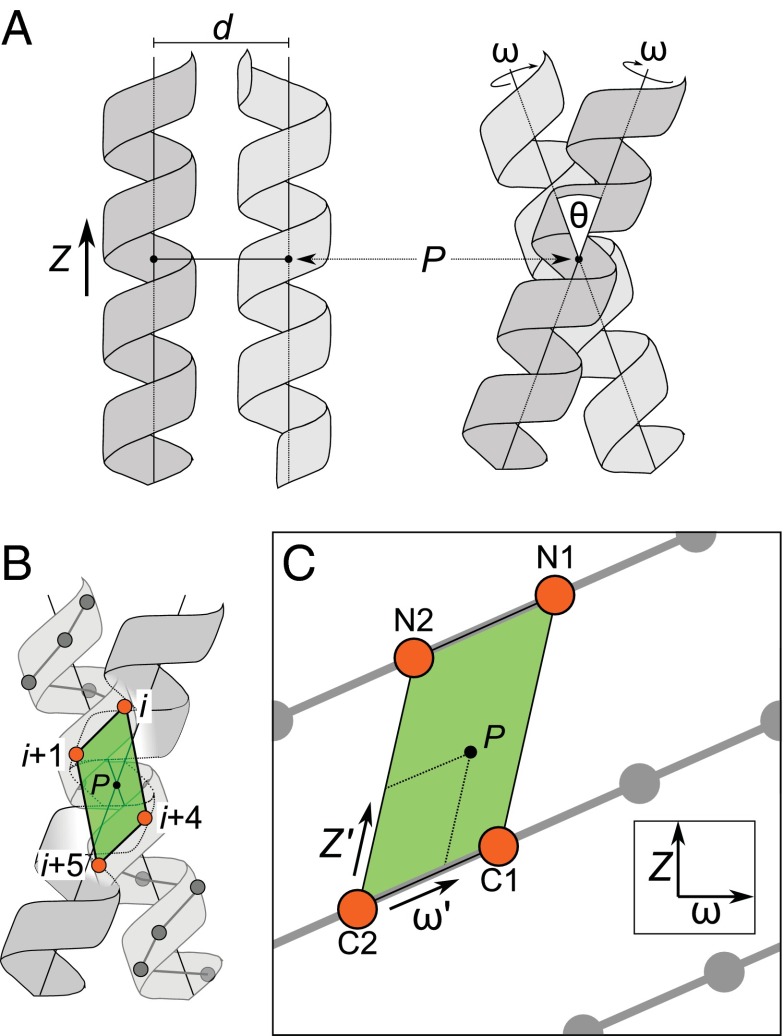
The first step for our geometric analysis was to identify a practical frame of reference to express the relative orientation of the helices, as illustrated in Fig. 1A. Two parameters are straightforward: the interhelical distance, d, and the crossing angle, θ. The other two parameters, the axial rotation, ω, and the position of the crossing point along the helical axis, Z, require a reference, such as a specific Cα. We found that it is most intuitive to define the geometry relative to a reference unit cell in the helical lattice (the parallelogram connecting four Cα atoms on the helical face illustrated in Fig. 1B, and, as a planar projection, in Fig. 1C). For completeness, we explored conformational space so that the position of the point of closest approach P (i.e., the crossing point) samples the entirety of the unit cell. This is done by expressing Z and ω relative to the helical screw, producing two transformed unit vectors, Z′ and ω′, that run parallel to the principal components of the unit cell (Fig. 1C and Fig. S1). For convenience, we defined a naming convention for the positions that is relative to the reference unit cell. The positions at the four corners were designated as N1, N2, C1, and C2, where “N” and “C” indicate the N- and C-terminal sides of the parallelogram. These four atoms are relatively spaced at i, i+1, i+4, and i+5. The above reference frame and convention greatly help the analysis and the discussion of the results.
Fig. 1.
Carbon hydrogen bond formation has preferential regions in interhelical space. (A) Definition of four parameters that define the geometry of a symmetrical dimer: the interhelical distance d; the crossing angle θ; the rotation of the helix around its axis ω; and the vertical position Z of the point of closest approach between the two helical axes (the crossing point P). (B) The coordinates can be redefined by expressing them as a function of the unit cell (green) on the helical lattice that contains the point of closest approach P. (C) The same unit cell in a planar helical lattice. The four interfacial positions that surround the point of closest approach are designated as N1 (relative position i), N2 (i+1), C1(i+4), and C2 (i+5). The principal axes are the rotation along the helical screw (ω') and the vector between C2 and N2 (Z'). The mathematical relationship between (ω, Z) and (ω', Z') is provided in Fig. S1.
Carbon Hydrogen Bond Analysis Reveals a Bias for Right-Handed Structures.
To investigate the precise geometric requirements for the formation of interhelical carbon hydrogen bonds, we performed a systematic evaluation of all homodimer geometries beginning with poly-Gly. Gly is the only amino acid that doubles the opportunity for hydrogen bond formation by the virtue of having two alpha hydrogens oriented approximately perpendicular to each other (109°) as well as being the residue that permits the two helices to come into the closest proximity. Therefore, poly-Gly is the best-case sequence for forming carbon hydrogen bond networks, from a geometric standpoint.
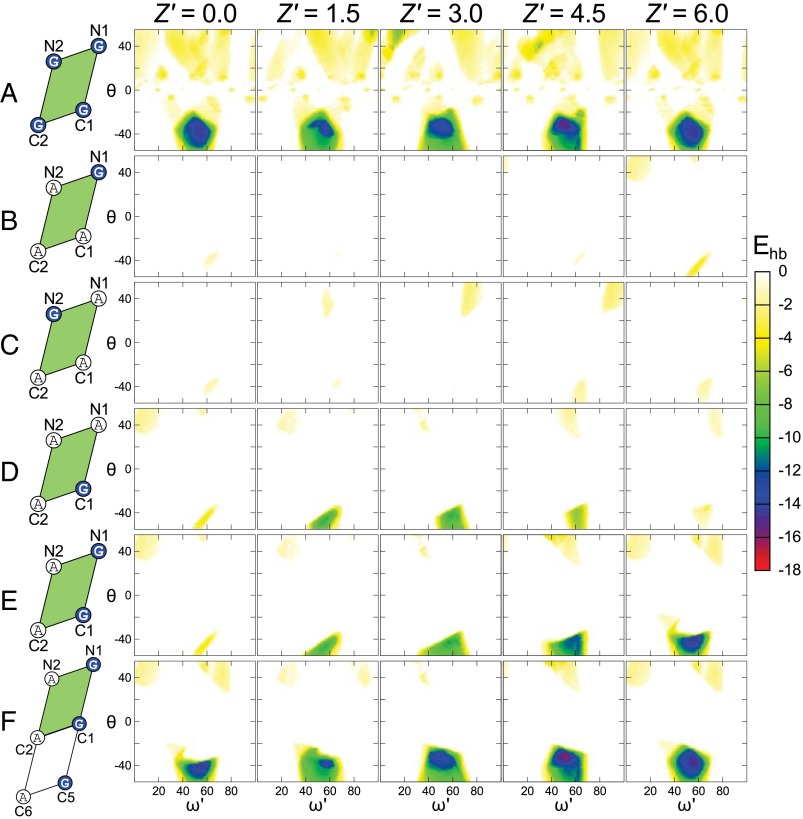
The hydrogen bonding propensity for each individual geometry was estimated with the hydrogen bonding function of the program SCWRL 4 (14) and reparameterized to include Cα donors (see Methods and Supporting Information). The results are presented as color-coded heat maps in Fig. 2A. Each graph shows total hydrogen bond energy as a function of axial rotation (ω′, on the x axis) and crossing angle (θ, y axis) for a different slice in Z′. For simplicity, the interhelical distance d is not explicitly graphed; instead, for each [ω′, θ, Z′] point, we plot only the hydrogen bond energy (Ehb) at the optimal distance (dmin). A larger number of Z′ stacks, as well as the corresponding dmin values for each point, are plotted in Fig. S2.
Fig. 2.
Position C1 must be a Gly for carbon hydrogen bond formation. A map of the carbon hydrogen bonding energy (Ehb, color bar) as a function of interhelical geometry (ω': x axis, θ: y axis; Z': panels). The amino acids at the interfacial positions (white circle A, Ala; blue circle G, Gly), are indicated in the unit cell schemes on the left. (A) Analysis of poly-Gly: A single broad minimum is observed centered around a region with a right-handed crossing angle θ of approximately −30° to −50°. The minimum persists with variation along the entire Z' stack. (B−D) Poly-Ala sequences with a single Gly at specific positions as indicated on the left-hand side of the figure. The propensity to form hydrogen bonds is almost completely removed compared with poly-Gly unless the amino acid at position C1 is a Gly (D). (E) Introduction of a GxxxG motif at the positions N1 and C1 restores some of the low-energy regions for higher Z' values. (F) When a third Gly is added at C5, the propensity becomes very similar to poly-Gly. In each panel, the hydrogen bond energy (Ehb) is plotted at the interhelical distance (dmin) in which the overall energy (vdw + hbond) is minimized.
A single major high-propensity region is observed in the lower half of the plot, for right-handed crossing angles in the −30° to −50° range. This minimum is situated midway between the Cα carbon atoms (C2 and C1) in the ω′ dimension, between 40° to 60°. The region persists, with some variation, across the entire range of Z′. Interestingly, the minimum corresponds to the important GASright structural motif (2), a right-handed dimer characterized by presence of GxxxG-like patterns at the helix−helix interface (4). Structural examples of GASright homodimers are glycophorin A (15) and BNIP3 (16), and the motif is also common within the fold of polytopic membrane proteins (2, 3).
GASright Homodimeric Motifs Require a Gly at Position C1.
To investigate the sequence requirements for carbon hydrogen bonding and to understand the role of GxxxG-like patterns in GASright motifs, we expanded the geometric analysis to poly-Ala helices in which one or more Gly were inserted in the sequence at specific positions. The poly-Ala sequence has minimal propensity to form hydrogen bonds (Fig. S3A), but when a single Gly is placed at C1, a significant restoration of the energies is observed for Z′ values between 1.5 and 4.5 Å, that is, for dimers that have the point of closest approach in the middle section of the parallelogram (Fig. 2D and in more detail in Fig. S4). Above and below these Z′ values, the backbones are separated by the Cβ methyl groups of either positions N1 or C5 (the amino acid at i ± 4 with respect to C1). These steric effects can be appreciated in a series of movies (Movies S1−S11), which simultaneously display the structures, helical parameters, and hydrogen bond propensity, as a function of Z′.
When a single Gly is placed at any position other than C1 (N1, N2, or C2), the hydrogen bonding energy landscapes present only very shallow minima (Fig. 2 B and C, and in further detail in Fig. S3 A–C). This is because the Cβ of C1-Ala invariably comes in contact with the opposing helix, preventing the two helices from being in sufficient proximity. Therefore, we conclude that C1 is the position with the most stringent requirement for Gly.
GxxxG Motifs Are Important on the Right-Hand Side of the Unit Cell.
If a second Gly is added at i-4 (N1) or i+4 (C5) with respect to C1 to form a GxxxG motif on the right-hand side of the unit cell, the hydrogen bonding propensity increases very significantly. If two Gly are placed at N1 and C1, significant restoration of the propensities is present for Z′ values that bring the crossing point closest to N1 (see Fig. 2E and Fig. S5A). If two Gly are placed at C1 and C5, the increase is observed for low Z′ values that have a crossing point closest to C1 (Fig. S5B). Finally, when N1, C1, and C5 are all Gly to form a Gly zipper motif GxxxGxxxG (17), the energy landscape looks very similar to the poly-Gly results (see Fig. 2F and Fig. S5C). Again, addition of Gly residues on any of the left side positions (N2, C2, or C6, while keeping C1 as Gly) has a negligible effect on the hydrogen bonding energies (Fig. S6).
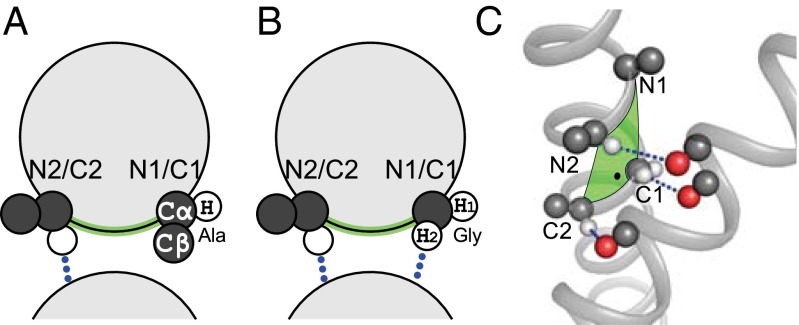
The marked distinction between the positions on the right side of the unit cell (N1, C1, C5) and those on the left side (N2, C2, C6) arises from the different orientation of the Cβ and Hα atoms with respect to the interface. This is schematically illustrated in Fig. 3A. The Cβ atom of C2 points away from the interface, whereas the Cβ of C1 is oriented directly toward the opposing helix. For this reason, larger amino acids can be accommodated at C2, but Gly is required in C1 to allow the two backbones to come into close proximity. A similar argument applies to N1/N2 and C5/C6 as well.
Fig. 3.
Structural distinction between interfacial positions. (A) The amino acids on the left side of the unit cell (N2 and C2) orient their α-hydrogen toward the interface while their Cβ points laterally, and thus these positions can accommodate larger amino acid types. The situation is reversed for positions N1 and C1: The α-hydrogen is oriented laterally, and the side chain points directly toward the opposing helix. Larger amino acids in this position may not be accommodated. (B) Gly is the only amino acid type that can form a hydrogen bond using the “side chain” hydrogen when present at positions N1 or C1. (C) Structural example: In this case the crossing point is close to C1, and there is sufficient space to allow Ala at N1.
GASright Motifs Are Optimized for Cα–H Hydrogen Bond Network Formation.
Gly performs a second important function as a donor when present at the right-hand side positions. As illustrated in Fig. 3A, any amino acid can donate at C2 because the Hα atom is pointed toward the interface. However, that same hydrogen is oriented laterally and away from the interface at C1. As schematically illustrated in Fig. 3B, only Gly can donate from the right side positions (C1, N1, C5) because its “side chain” hydrogen is in the correct orientation. The same point is illustrated in structural terms in Fig. 3C.
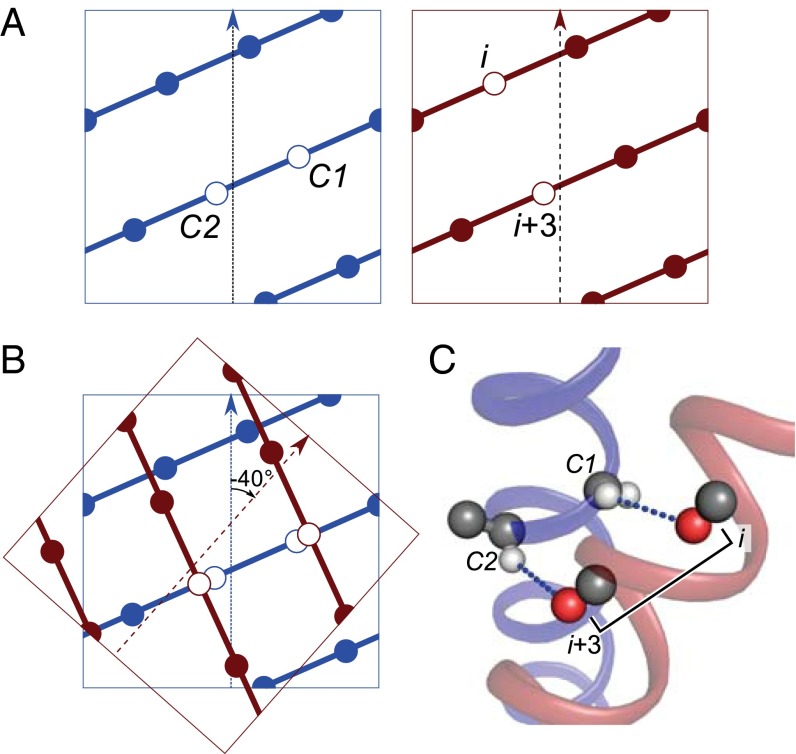
It follows that both amino acids at C1 and C2 can simultaneously donate to the opposing helix only if C1 is a Gly. However, this requires a correct alignment with acceptors on the opposing helix. As illustrated in Fig. 4 using a superimposition of helical lattice projections, the crossing angle of GASright motifs is optimal for this purpose. A −40° crossing angle aligns the two donors at C1 and C2 with two carbonyl oxygen atoms spaced at i and i+3 on the opposing helix. This is also shown in structural terms in Fig. 4C.
Fig. 4.
In a GASright motif, the C1 and C2 donors are aligned with carbonyl acceptors at i, i+3 on the opposing helix. (A) Helical lattices highlighting the (Left) C1 and C2 donor positions (blue) and (Right) carbonyl acceptors at i, i+3 on the opposing helix (dark red). (B) A superimposition of the two lattices followed by a −40° rotation aligns the donors and acceptors. (C) Structural representation of the same alignment.
Overall, the analysis presents a compelling picture: The GASright coincides with the major hot spot for carbon hydrogen bonding. From a steric standpoint, the geometry appears ideal to allow backbone contacts as long as C1 and either N1 or C5 (or both) are Gly residues. The Gly residues at these same positions are also able to cooperatively extend the hydrogen bonding network by virtue of having their second hydrogen oriented toward the interface. Finally, the −40° crossing angle is ideal for the simultaneous involvement of C1 and C2 (and, similarly, N1/N2 or C5/C6) in hydrogen bonding interactions. In our opinion, this finding suggests a strong causal link between the high frequency of the GASright motif in the structural database and its propensity to form networks of carbon hydrogen bonds, supporting the hypothesis that these interactions are important contributors to helix−helix association.
A High-Throughput Structural Prediction Method for GASright Motif.
The analysis presented above shows that only a small fraction of homodimer conformational space allows for the formation of Cα–H···O=C hydrogen bond networks. It also indicates that positions at the interface may have stringent sequence requirements for Gly or a limited set of amino acids. On these premises, we hypothesized that it would be possible to create a rapid method to recognize sequence signatures compatible with the formation of GASright motifs.
To develop and implement the method, which we named CATM, we systematically subdivided the homodimer conformational space that allows formation of Cα–H···O=C bonds into a comprehensive “grid” of representative dimer conformations. We then established the specific sequence requirements of each conformation (sequence rules). In this implementation, we did not limit the space to the right-handed region, but allowed any dimer that displayed formation of at least two pairs of symmetrical hydrogen bonds.
When the primary sequence of a TM domain of interest is provided to CATM, the sequence is built in full atoms over each representative dimer that is compatible with the sequence rules. The two helices are placed at the interhelical distance in which the two backbones still form a network of carbon hydrogen bonds (dout, which is precalculated for each dimer). The helices are then moved closer followed by optimization of the side chains, until the energy reaches a minimum. At that point, the geometry of the dimer is locally optimized with a brief Monte Carlo procedure consisting of cycles in which all four interhelical parameters change randomly (d, Z, ω, θ).
At the end of each docking, the energy of the dimer is subtracted from the energy of the helices separated at a distance to obtain an interaction energy. Only the solutions with a negative interaction energy are preserved. Finally, all closely related solutions are clustered by similarity (RMSD < 2 Å), and the lowest-energy structure is reported as a representative model of its cluster. CATM is explained in full detail in Methods, and is freely available for download with MSL (18), a C++ open source macromolecular modeling software library (19).
A Minimalistic Set of Energy Functions Predicts Known Structures with Near-Atomic Accuracy.
We tested CATM against five known homodimeric GASright structures: glycophorin A (15), BNIP3 (16, 20), and three members of the Tyrosine Receptor Kinase family, EphA1 (21), ErbB1 (EGFR) (22), and ErbB4 (23). We began testing using a simple combination of hydrogen bonding (Ehb) and van der Waals (Evdw) to score the structural models. Perhaps surprisingly, we found that this minimalistic set of energy functions predicts the structures at near-atomic precision, and in all but one case, the native structure corresponds to the lowest-energy model. The finding validates our hypothesis that Cα–H hydrogen bonds can be an important guiding element for structure recognition, because they offer multiple anchor points between backbones, and because they are strongly dependent on good packing, given that the interactions can be easily disallowed by steric clashes (24). All predicted models discussed below can be downloaded from http://seneslab.org/CATM/structures.
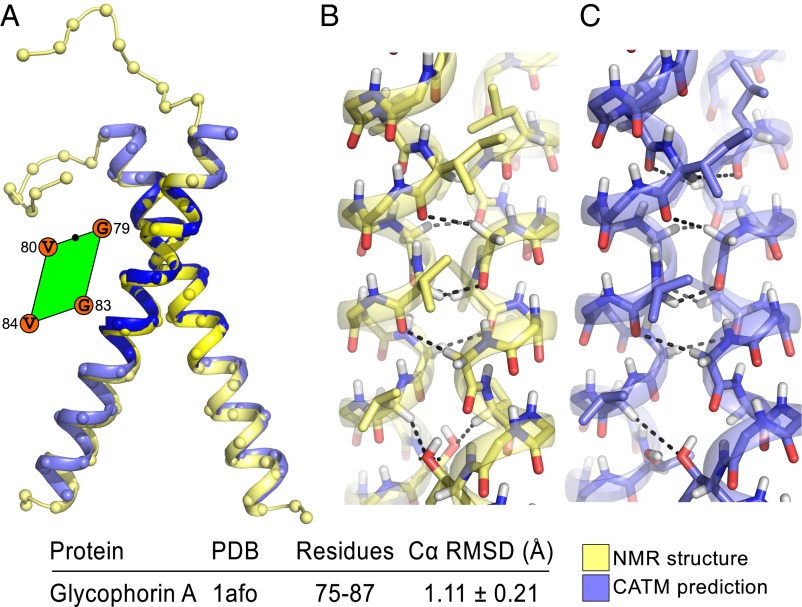
CATM returned 63 solutions for Glycophorin A, a major biophysical model system for membrane protein association (25). The 63 solutions were clustered into five distinct models. The relationship between RMSD and energy for all 63 structures is plotted in Fig. S7. The lowest-energy model predicted by CATM (model 1) is a very close match of the NMR structure (Fig. 5). Measured over the entire TM helix (residues 73–95), the Cα RMSD is 1.31 ± 0.24 Å (average and SD measured against the 20 NMR models). Measured over the segment that encompasses the interaction interface, discarding the contribution of the divergent ends, the RMSD reduces to 1.1 ± 0.21 Å (residues 75–87, marked in darker blue in Fig. 5A). A side-by-side comparison of the predicted model and the experimental structure shows the matching hydrogen bonding network and the conformation of the interfacial side chains (Fig. 5 B and C). A difference between the two structures is the conformation of Thr-87, which accepts a Cα hydrogen from Val-84 on the opposing helix in the NMR structure, whereas in the lowest-energy CATM model, the hydroxyl group of Thr-87 is involved in an interhelical canonical hydrogen bond, which is consistent with a solid state NMR structure of the dimer (26). Fig. 5 also shows the position of the point of closest approach in the unit cell at the interface of the dimer. It should be noted that glycophorin A complies with the “Gly at C1” rule identified in our analysis, as all other structures analyzed in the following paragraphs. In fact, C1 is the only position that is invariably Gly across all of the examples.
Fig. 5.
CATM prediction of the TM domain of Glycophorin A. (A) Backbone superimposition of the NMR structure (yellow) and the predicted model (blue). The Cα RMSD in the region that encompasses the interface is indicated and highlighted in darker blue and yellow in the ribbon. The amino acids at the interface (G, Gly, V, Val) and the position of the point of closest approach (black dot) are highlighted in the parallelogram. B and C show the full-atom comparison between the experimental structure and the prediction. The CATM model is close to atomic precision, with a similar network of carbon hydrogen bonds. The NMR structure and CATM model differ in the orientation of Thr-87, which hydrogen bonds to its own backbone, whereas CATM predicts the formation of an interhelical canonical hydrogen bond.
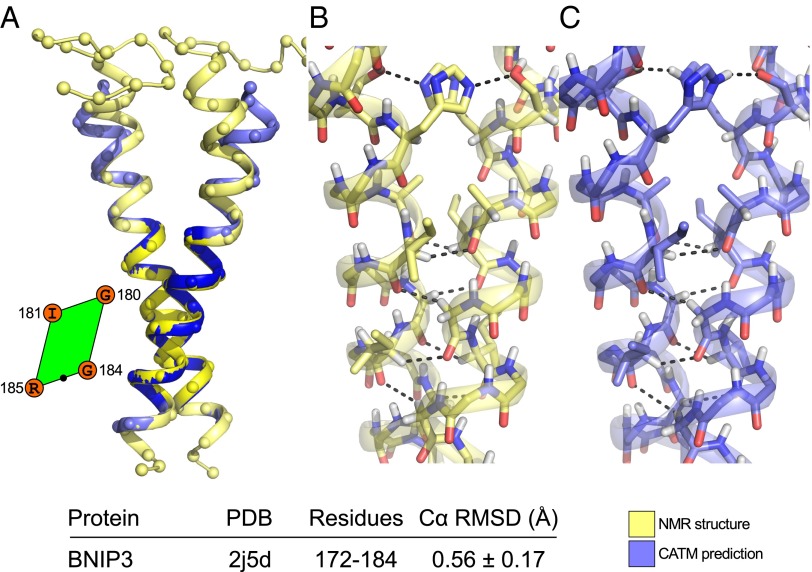
The second structural prediction is BNIP3, a very stable TM dimer (27) characterized by a very short interhelical distance (6.5 Å). The interface consists of a glycine zipper motif (A176xxxG180xxxG184). As shown in Fig. 6A, the model is extremely similar to the NMR structure (16, 20). The RMSD of the helical region of the entire TM domain is 1.10 ± 0.36 Å and only 0.56 ± 0.17 Å when it is computed only for the region that participates in the helix−helix interaction. The model replicates the network of carbon hydrogen bonds observed in BNIP3, and all interfacial side chains are predicted in the correct rotamer, as evident in the side-by-side comparison of Fig. 6 B and C. In addition, CATM accurately captures the interhelical hydrogen bond between the side chain of His-173 (donor) and Ser-172 (acceptor), an important feature that contributes to the dimer's stability (28).
Fig. 6.
Structural prediction of BNIP3. CATM produces a single model for BNIP3 that is extremely similar to the NMR structure. (A) The Cα RMSD of the helical region of the entire TM domain is 1.10 ± 0.36 Å, which falls to 0.56 ± 0.17 Å when only the region in contact (darker blue and yellow) is considered. The amino acids at the interface and the position of the point of closest approach (black dot) are highlighted in the parallelogram. The side-by-side prediction (B and C) shows close similarity in the network of carbon hydrogen bonds and correct prediction of the orientation of all interfacial side chains. The model also accurately captures the canonical hydrogen bond between Ser-172 and His-173.
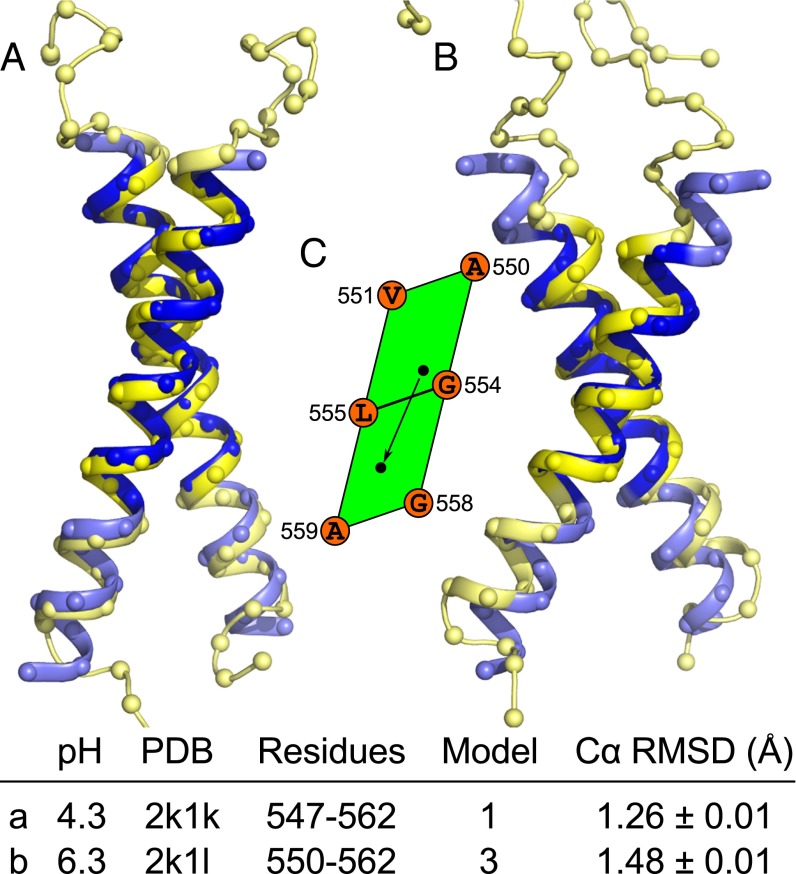
The third comparison is EphA1, which was solved by solution NMR in bicelles at two different pH conditions (21). The dimer displays a conformational change induced by a change in the protonation state of a membrane embedded Glu residue (E547). CATM captures both conformations with good accuracy (Fig. 7). The low-pH structure is predicted by model 1 with a Cα RMSD of 1.26 Å. The higher-pH structure is predicted by model 4 with an RMSD of 1.48 Å. The structures are related by a shift of the crossing point of about 3 Å toward the C terminus that brings the crossing point from the top half to the bottom half of the glycine zipper motif (A550xxxG554xxxG558), as schematically shown in the parallelogram representation of the interface in Fig. 7. Interestingly, the authors also report the presence of a minor component of some cross peaks in the higher pH conditions, suggesting a second species (about 10%) was present in the sample (21). Although a structural model could not be calculated and was not reported for this minor species, the authors suggest that this competing state associates through the C-terminal GxxxG-like motif (A560xxxG564), and identify the amino acids involved at the interface as Leu-557, Ala-560, Gly-564, and Val-567. This description is consistent with the interface of model 2 produced by CATM.
Fig. 7.
CATM predicts multiple states of the EphA1 Tyrosine Receptor Kinase. (A) The structure of the TM domain EphA1 determined at a low pH is well predicted by CATM model 1. (B) The structure obtained at higher pH is matched by model 4. (C) The conformational shift between low and high pH is highlighted schematically in the unit cell representation. The interface remains centered on the Gly-zipper motif (AxxxGxxxG), but the crossing point shifts (arrow) toward the C terminus in the adjacent unit cell. There is also an increase of the crossing angle. EphA1 has multiple GxxxG-like motifs and produces four models. Model 2 interacts through a C-terminal AxxxG motif. Model 3 is closely related to model 1.
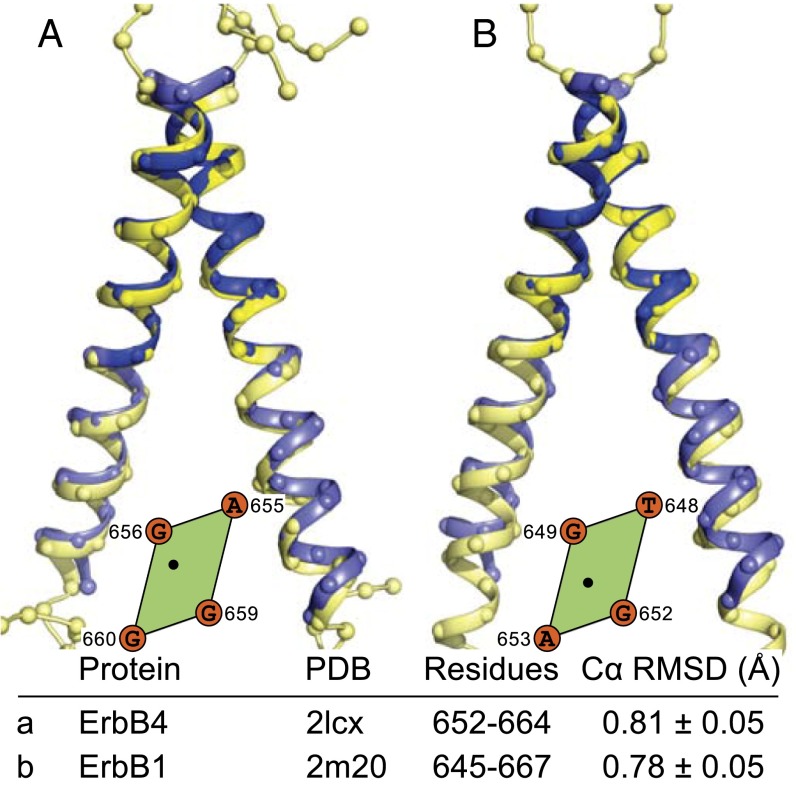
The final two test cases are both members of the epidermal growth factor receptor family (29). As shown in Fig. 8A, the NMR structure of ErbB4 (23) is predicted well by CATM, with an RMSD of 0.81 Å across the interacting region. However, our prediction of ErbB1 (EGFR) is not in agreement with the experimental structure, the only case among the five structures tested. The experimental structure interacts through the N-terminal TxxxG motif (22), and this structure is predicted by CATM's model 3 with a Cα RMSD of 0.77 Å (Fig. 8B). Instead, model 1 is a well-packed dimer that interacts through C-terminal side AxxxG motif of the TM helix and is a likely candidate for a postulated inactive state of the receptor (22, 30). As in the case of EphA1, this finding highlights the potential of offering alternative structural models that may reflect distinct functional states of the TM dimers.
Fig. 8.
Prediction of ErbB4 and ErbB1. (A) ErbB4 is predicted by the top CATM model, and (B) ErbB1 (EGFR) is predicted by the third model. Among the five structures tested, ErbB1 is the only structure that is not predicted by the lowest-energy model.
The TM region of another member of the same family, ErbB2, has also been solved by NMR in dimeric form (31). The NMR model has a crossing angle of −41° and an interhelical distance of 7.6 Å; however, this structure is not mediated by Cα–H hydrogen bonds. Analysis of its geometry reveals that the ω' angle (12°) is incompatible with Cα–H hydrogen bond formation (Fig. S8). For this reason, the structure is outside the scope of conformational space explored by CATM, and thus it cannot be predicted precisely by the program. CATM produced two GASright models for ErbB2, one mediated by the C-terminal GxxxG motif, the other mediated by the N-terminal SxxxG motif. This second model is related to the NMR structure by an RMSD of 2.43 ± 0.09 Å. Similarly to the previous cases, we note that it is possible that the two CATM models may correspond to alternative physiological states of the dimer. The ErbB2 predictions are also available at http://seneslab.org/CATM/structures/.
Conclusions
We have presented an analysis of carbon hydrogen bonding as a function of helix orientation in TM homodimers. The analysis demonstrates that there is a single region of conformational space for homodimers with a high propensity for formation of hydrogen bond networks. Remarkably, this area corresponds to the GASright motif—the frequently occurring fold of glycophorin A—lending strong support to the hypothesis that optimization of carbon hydrogen bonding is a major driving factor in its assembly. The analysis also provides a rational structural interpretation of the occurrence of GxxxG motifs in GASright homodimers, indicating that the Gly residues are essential on a specific side of the helix interface for steric reasons and to act as hydrogen bonding donors.
Based on the analysis, we have created a rapid method for the structural prediction of GASright homodimers. We have shown that with a surprisingly simple set of energy functions (Ehb+Evdw), CATM predicts the known structures of GASright homodimers with near-atomic precision. Future work is necessary to refine, verify, and expand the scoring functions. For example, a membrane model, such as a depth-dependent potential (32) or an implicit solvent (33), is likely to improve the predictions and any correlation between the computational score and the thermodynamic stability. Nevertheless, CATM appears to capture the essence of GASright motifs already in the current form, and therefore the method is already applicable to the rapid prediction of unknown structures.
Methods
Software.
All calculations were implemented and performed using the MSL molecular modeling libraries v. 1.1 (18), an open source C++ library that is freely available (19).
Creation of Interhelical Geometries.
Two helices, 31 residues in length, were created in idealized conformation, oriented with their axes aligned with the z axis and the Cα atom at position 16 placed on the x axis. Position 16 is the position designated as C2 in Fig. 1C. To create a dimer, the following transformations were performed in order: a rotation around the z axis (determining the axial rotation ω), a translation along the z axis (determining the position of the crossing point Z in the z dimension), a rotation around the x axis (determining the crossing angle θ), and a translation along the x axis (determining the interhelical distance d). One of the two helices was finally rotated around the z axis by 180° to produce twofold symmetry.
The geometric analysis was performed so that the point of closest approach P would explore the entire unit cell defined by N1, N2, C1, and C2 as in Fig. 1C. The transformations were performed using a redefined set of geometric parameters [d, θ, ω', Z'], where ω', Z' are unit vectors that go in the direction of the principal components of the unit cell of the helical lattice using the mathematical relationships defined in Fig. S1. The conformational space was explored at discrete intervals with the following step sizes: d: 0.1 Å; ω': 1°; Z': 0.15 Å; θ: 1°. The crossing angle θ was constrained to be in the −55° to +55° range.
Energy Functions and Definitions.
Energies were determined using the CHARMM 22 van der Waals function (34) and the hydrogen bonding function of SCWRL 4 (14), as implemented in MSL C++ libraries (18). Cα–H hydrogen bonds have been included as part of the energy functions of Rosetta Membrane (35). We derived a similar adaptation for the SCWRL 4 function by adding the following parameters for Cα donors: B = 60.278; D0 = 2.3 Å; σd = 1.202 Å; αmax = 74.0°; and βmax = 98.0°. These parameters reduce the hydrogen bonding energy to approximately half that of canonical bonds, and adjust the optimal distance and the angular dependencies as explained in SI Text and Table S1.
The energy of a model is computed as the difference between the dimer energy and the energy of the separated monomers (referred to as interaction energy), with the side chains optimized independently in the two states. All side chain optimization procedures were performed using the Energy-Based Conformer Library applied at the 95% level (36) with a greedy trials algorithm (37) as implemented in MSL.
Determination of Cα–H···O=C Energy Landscapes.
The energy landscapes were determined for all [θ, ω', Z'] coordinates. Two helices were initially placed at d = 10 Å. The energies were evaluated and the helices were moved closer to each other in 0.1 Å steps until a lowest-energy (vdw + hbond) conformation was identified at a distance dmin. Fig. 2 plots the hydrogen bonding energy (Ehb) at each respective dmin as a function of [θ, ω', Z']. A plot of the corresponding dmin values is provided for poly-Gly in Fig. S2.
Development of CATM.
CATM is a structure prediction program that performs a systematic search in the subset of homodimer conformational space that allows formation of interhelical Cα–H···O=C hydrogen bonds. The creation of CATM consisted of the definition of the search space and the derivation of a set of sequence exclusion rules. The execution phase of CATM (the actual structure prediction for a given sequence) is schematically illustrated in Fig. S9.
Definition of the Search Space.
The definition of the search space was based on the geometric analysis of poly-Gly. We selected all conformations in [θ, ω', Z'] space that display at least four interhelical Cα–H···O=C hydrogen bonds (two symmetrical pairs). This search yielded a set of ∼90,000 structures, which were then filtered by similarity using a 2.0 Å RMSD criterion to create a representative set of 463 geometries. For each representative geometry, we recorded the maximum interhelical distance in which four hydrogen bonds still exist (dout).
Definition of the Sequence Rules.
Each representative geometry G was constructed as poly-Gly and was set at dout. Every amino acid X type was built at every position j in every G, and its conformation was optimized. If the interaction energy was unfavorable by more than 10 kcal/mol, a sequence rule was recorded stating that the X is not allowed at j in G. These rules allow for the exclusion of nonproductive sequences from the expensive all-atom modeling rphase.
The CATM Program.
The input sequence is threaded into a set of different registers at each of the 463 representative geometries (Fig. S9). For each register, CATM checks if the sequence rules are met. If the rules are met, the sequence is built on the backbone in all atoms, and the helices are placed at dout. The interhelical distance is reduced in steps of 0.1 Å, and at each step, the side chains are optimized and the interaction energy is evaluated until a minimum energy is found. To further optimize the dimer, the geometry is then subjected to 10 Monte Carlo backbone perturbation cycles in which all interhelical parameters (d, θ, ω, Z) are locally varied. If the final interaction energy is negative, the solution is accepted. The solutions are then clustered using an RMSD criterion (2 Å) to produce a series of distinct models, with all individual solutions provided as an NMR-style Protein Data Bank file.
Supplementary Material
Acknowledgments
We are grateful to Dr. Kevin MacKenzie for insightful discussion, and to the anonymous reviewers for their comments and suggestions, which have significantly contributed to improving this article. The work was supported with startup funds from the University of Wisconsin–Madison and funds from the Wisconsin Alumni Research Foundation. We also thank the Center for High-Throughput Computing of the University of Wisconsin–Madison (http://chtc.cs.wisc.edu) for central processing unit time. B.K.M. acknowledges the support of the National Library of Medicine Grant 5T15LM007359 to the Computation and Informatics in Biology and Medicine Training Program.
Footnotes
The authors declare no conflict of interest.
*This Direct Submission article had a prearranged editor.
This article contains supporting information online at www.pnas.org/lookup/suppl/doi:10.1073/pnas.1319944111/-/DCSupplemental.
References
- 1.Moore DT, Berger BW, DeGrado WF. Protein-protein interactions in the membrane: Sequence, structural, and biological motifs. Structure. 2008;16(7):991–1001. doi: 10.1016/j.str.2008.05.007. [DOI] [PMC free article] [PubMed] [Google Scholar]
- 2.Walters RFS, DeGrado WF. Helix-packing motifs in membrane proteins. Proc Natl Acad Sci USA. 2006;103(37):13658–13663. doi: 10.1073/pnas.0605878103. [DOI] [PMC free article] [PubMed] [Google Scholar]
- 3.Senes A, Ubarretxena-Belandia I, Engelman DM. The Calpha ---H...O hydrogen bond: A determinant of stability and specificity in transmembrane helix interactions. Proc Natl Acad Sci USA. 2001;98(16):9056–9061. doi: 10.1073/pnas.161280798. [DOI] [PMC free article] [PubMed] [Google Scholar]
- 4.Senes A, Gerstein M, Engelman DM. Statistical analysis of amino acid patterns in transmembrane helices: The GxxxG motif occurs frequently and in association with beta-branched residues at neighboring positions. J Mol Biol. 2000;296(3):921–936. doi: 10.1006/jmbi.1999.3488. [DOI] [PubMed] [Google Scholar]
- 5.Lomize MA, Lomize AL, Pogozheva ID, Mosberg HI. OPM: Orientations of Proteins in Membranes database. Bioinformatics. 2006;22(5):623–625. doi: 10.1093/bioinformatics/btk023. [DOI] [PubMed] [Google Scholar]
- 6.Horowitz S, Trievel RC. Carbon-oxygen hydrogen bonding in biological structure and function. J Biol Chem. 2012;287(50):41576–41582. doi: 10.1074/jbc.R112.418574. [DOI] [PMC free article] [PubMed] [Google Scholar]
- 7.Vargas R, Garza J, Dixon DA, Hay BP. How strong is the Cα−H···OC hydrogen bond? J Am Chem Soc. 2000;122:4750–4755. [Google Scholar]
- 8.Scheiner S, Kar T, Gu Y. Strength of the Calpha H..O hydrogen bond of amino acid residues. J Biol Chem. 2001;276(13):9832–9837. doi: 10.1074/jbc.M010770200. [DOI] [PubMed] [Google Scholar]
- 9.Arbely E, Arkin IT. Experimental measurement of the strength of a C alpha-H...O bond in a lipid bilayer. J Am Chem Soc. 2004;126(17):5362–5363. doi: 10.1021/ja049826h. [DOI] [PubMed] [Google Scholar]
- 10.Yohannan S, et al. A C alpha-H...O hydrogen bond in a membrane protein is not stabilizing. J Am Chem Soc. 2004;126(8):2284–2285. doi: 10.1021/ja0317574. [DOI] [PubMed] [Google Scholar]
- 11.Mottamal M, Lazaridis T. The contribution of C alpha-H...O hydrogen bonds to membrane protein stability depends on the position of the amide. Biochemistry. 2005;44(5):1607–1613. doi: 10.1021/bi048065s. [DOI] [PubMed] [Google Scholar]
- 12.Park H, Yoon J, Seok C. Strength of Calpha-H...O=C hydrogen bonds in transmembrane proteins. J Phys Chem B. 2008;112(3):1041–1048. doi: 10.1021/jp077285n. [DOI] [PubMed] [Google Scholar]
- 13.Senes A, Engel DE, DeGrado WF. Folding of helical membrane proteins: The role of polar, GxxxG-like and proline motifs. Curr Opin Struct Biol. 2004;14(4):465–479. doi: 10.1016/j.sbi.2004.07.007. [DOI] [PubMed] [Google Scholar]
- 14.Krivov GG, Shapovalov MV, Dunbrack RL., Jr Improved prediction of protein side-chain conformations with SCWRL4. Proteins. 2009;77(4):778–795. doi: 10.1002/prot.22488. [DOI] [PMC free article] [PubMed] [Google Scholar]
- 15.MacKenzie KR, Prestegard JH, Engelman DM. A transmembrane helix dimer: Structure and implications. Science. 1997;276(5309):131–133. doi: 10.1126/science.276.5309.131. [DOI] [PubMed] [Google Scholar]
- 16.Sulistijo ES, Mackenzie KR. Structural basis for dimerization of the BNIP3 transmembrane domain. Biochemistry. 2009;48(23):5106–5120. doi: 10.1021/bi802245u. [DOI] [PubMed] [Google Scholar]
- 17.Kim S, et al. Transmembrane glycine zippers: Physiological and pathological roles in membrane proteins. Proc Natl Acad Sci USA. 2005;102(40):14278–14283. doi: 10.1073/pnas.0501234102. [DOI] [PMC free article] [PubMed] [Google Scholar]
- 18.Kulp DW, et al. Structural informatics, modeling, and design with an open-source Molecular Software Library (MSL) J Comput Chem. 2012;33(20):1645–1661. doi: 10.1002/jcc.22968. [DOI] [PMC free article] [PubMed] [Google Scholar]
- 19. University of Wisconsin–Madison, Senes Lab (2013) MSL: An open source C++ library for analysis, manipulation, modeling and design of macromolecules (University of Wisconsin, Madison, WI). Available at http://msl-libraries.org. Accessed October 27, 2013.
- 20.Bocharov EV, et al. Unique dimeric structure of BNip3 transmembrane domain suggests membrane permeabilization as a cell death trigger. J Biol Chem. 2007;282(22):16256–16266. doi: 10.1074/jbc.M701745200. [DOI] [PubMed] [Google Scholar]
- 21.Bocharov EV, et al. Spatial structure and pH-dependent conformational diversity of dimeric transmembrane domain of the receptor tyrosine kinase EphA1. J Biol Chem. 2008;283(43):29385–29395. doi: 10.1074/jbc.M803089200. [DOI] [PMC free article] [PubMed] [Google Scholar]
- 22.Endres NF, et al. Conformational coupling across the plasma membrane in activation of the EGF receptor. Cell. 2013;152(3):543–556. doi: 10.1016/j.cell.2012.12.032. [DOI] [PMC free article] [PubMed] [Google Scholar]
- 23.Bocharov EV, Mineev KS, Goncharuk MV, Arseniev AS. Structural and thermodynamic insight into the process of “weak” dimerization of the ErbB4 transmembrane domain by solution NMR. Biochim Biophys Acta. 2012;1818(9):2158–2170. doi: 10.1016/j.bbamem.2012.05.001. [DOI] [PubMed] [Google Scholar]
- 24.Senes A. Computational design of membrane proteins. Curr Opin Struct Biol. 2011;21(4):460–466. doi: 10.1016/j.sbi.2011.06.004. [DOI] [PubMed] [Google Scholar]
- 25.MacKenzie KR, Fleming KG. Association energetics of membrane spanning alpha-helices. Curr Opin Struct Biol. 2008;18(4):412–419. doi: 10.1016/j.sbi.2008.04.007. [DOI] [PMC free article] [PubMed] [Google Scholar]
- 26.Smith SO, Jonas R, Braiman M, Bormann BJ. Structure and orientation of the transmembrane domain of glycophorin A in lipid bilayers. Biochemistry. 1994;33(20):6334–6341. doi: 10.1021/bi00186a037. [DOI] [PubMed] [Google Scholar]
- 27.Sulistijo ES, MacKenzie KR. Sequence dependence of BNIP3 transmembrane domain dimerization implicates side-chain hydrogen bonding and a tandem GxxxG motif in specific helix-helix interactions. J Mol Biol. 2006;364(5):974–990. doi: 10.1016/j.jmb.2006.09.065. [DOI] [PubMed] [Google Scholar]
- 28.Lawrie CM, Sulistijo ES, MacKenzie KR. Intermonomer hydrogen bonds enhance GxxxG-driven dimerization of the BNIP3 transmembrane domain: Roles for sequence context in helix-helix association in membranes. J Mol Biol. 2010;396(4):924–936. doi: 10.1016/j.jmb.2009.12.023. [DOI] [PMC free article] [PubMed] [Google Scholar]
- 29.Schlessinger J. Cell signaling by receptor tyrosine kinases. Cell. 2000;103(2):211–225. doi: 10.1016/s0092-8674(00)00114-8. [DOI] [PubMed] [Google Scholar]
- 30.Fleishman SJ, Schlessinger J, Ben-Tal N. A putative molecular-activation switch in the transmembrane domain of erbB2. Proc Natl Acad Sci USA. 2002;99(25):15937–15940. doi: 10.1073/pnas.252640799. [DOI] [PMC free article] [PubMed] [Google Scholar]
- 31.Bocharov EV, et al. Spatial structure of the dimeric transmembrane domain of the growth factor receptor ErbB2 presumably corresponding to the receptor active state. J Biol Chem. 2008;283(11):6950–6956. doi: 10.1074/jbc.M709202200. [DOI] [PubMed] [Google Scholar]
- 32.Senes A, et al. E(z), a depth-dependent potential for assessing the energies of insertion of amino acid side-chains into membranes: Derivation and applications to determining the orientation of transmembrane and interfacial helices. J Mol Biol. 2007;366(2):436–448. doi: 10.1016/j.jmb.2006.09.020. [DOI] [PubMed] [Google Scholar]
- 33.Lazaridis T. Effective energy function for proteins in lipid membranes. Proteins. 2003;52(2):176–192. doi: 10.1002/prot.10410. [DOI] [PubMed] [Google Scholar]
- 34.MacKerell AD, et al. All-atom empirical potential for molecular modeling and dynamics studies of proteins. J Phys Chem B. 1998;102:3586–3616. doi: 10.1021/jp973084f. [DOI] [PubMed] [Google Scholar]
- 35.Barth P, Schonbrun J, Baker D. Toward high-resolution prediction and design of transmembrane helical protein structures. Proc Natl Acad Sci USA. 2007;104(40):15682–15687. doi: 10.1073/pnas.0702515104. [DOI] [PMC free article] [PubMed] [Google Scholar]
- 36.Subramaniam S, Senes A. An energy-based conformer library for side chain optimization: Improved prediction and adjustable sampling. Proteins. 2012;80(9):2218–2234. doi: 10.1002/prot.24111. [DOI] [PubMed] [Google Scholar]
- 37.Xiang Z, Honig B. Extending the accuracy limits of prediction for side-chain conformations. J Mol Biol. 2001;311(2):421–430. doi: 10.1006/jmbi.2001.4865. [DOI] [PubMed] [Google Scholar]
Associated Data
This section collects any data citations, data availability statements, or supplementary materials included in this article.


