Abstract
Background
Glioma development is a multistep process associated with progressive genetic alterations but also regulated by cellular and noncellular components in a tumor-associated niche.
Methods
Using 2 rat C6 glioma cell clones with different tumorigenesis, named C6-1 and C6-2, this study characterized genes associated with enhanced tumorigenic features of glioma cells by comparative cDNA microarray analysis combined with Q-PCR. Neurospehere formation and clonogenicity were examined to determine the growth of tumorigenic C6 glioma cells. The lentivirus-mediated gene knockdown approach was conducted to determine the role of interleukin-33 (IL-33) in glioma cell proliferation and migration. Transwell cell invasion assay was used to examine microglia migration induced by tumorigenic C6 cells.
Results
The functional analysis of gene ontology (GO) biological processes shows that the upregulated genes found in tumorigenic C6 (C6-1) cells are closely related to cell proliferation. Tumorigenic C6 cells expressed cytokines and chemokines abundantly. Among these genes, IL-33 was profoundly induced in tumorigenic C6 cells with the expression of IL-33 receptor ST2. Furthermore, the growth rate and colony formation of tumorigenic C6 cells were attenuated by the inhibition of IL-33 and ST2 gene expression. Moreover, IL-33 was involved in tumorigenic glioma cell migration and regulation of the expression of several glioma-associated growth factors and chemokines in tumorigenic C6 cells.
Conclusion
Accordingly, we concluded that glioma cells with abundant production of IL-33 grow rapidly; moreover, the interactions of multiple cytokines/chemokines induced by glioma cells may develop a microenvironment that facilitates microglia/macrophage infiltration and fosters glioma growth in the brain.
Keywords: chemokine (C-C motif) ligand 7, glioma, interleukin-33, microglia, ST2
Malignant gliomas are the most commonprimary brain tumors, representing 1% of adult cancers worldwide, and are ranked as the third leading cause of cancer death in the young age group (less than 35 years).1–3 Astrocytoma WHO grade IV or glioblastoma multiforme (GBM) is the most common and aggressive form of CNS brain tumors, accounting for ∼50% of brain tumors.1–4 The conventional treatment for glioma combines surgery with radiation and chemotherapy. Although this treatment includes the use of anti-angiogenic agents to inhibit cancer cell division/invasion or to induce cancer cell death,5,6 the survival time for most patients is short because the efficacy of this approach to high-grade glioma is limited.
DNA microarray-based analysis has been widely used to study global transcriptional signatures in the different pathologic subtypes of glioma.7–10 The findings of these earlier works have demonstrated that genes involved in cellular proliferation, RNA processing, signal transduction, and proteosomal functioning are enriched in astrocytoma grades II and III, and primary GBM.7 In addition, the molecular features of primary GBM have been shown to be distinct from those of lower-grade glioma-derived secondary GBM.7 Examination of the transcriptional profiling for GBM-associated vascularization, using microarray analysis, has identified several potential genes including secreted protein acidic and rich in cysteine, insulin-like growth factor-binding protein 7, vascular endothelial growth factor A, and TGFβ2.11–13 These studies indicate that the vascular niche has an impact on the development of glioma.
Since C6 glioma cells form solid tumors when implanted into the brains of rodents, they are widely used to generate experimental animal models of GBM.14,15 In this study, 2 C6 glioma cell clones (named C6-1 and C6-2), with different growth rates and tumorigenesis, were characterized. Compared with the C6-2 cells, the C6-1 cells had greater cell proliferation and colony formation in vitro and formed progressive tumors in rat cortex. Comparative DNA microarray analysis was performed to identify the genes that enhanced cell growth and tumor formation with C6-1 cells. In addition to tumor-associated genes, COX2 and CXCL12, interleukin-33 (IL-33) was expressed abundantly in C6-1 cells and was involved in the promotion of C6-1 cell proliferation. Our findings indicated that IL-33, associated with the functions of cell proliferation and cytokine/chemokine expression, was not only highly upregulated in tumorigenic C6 glioma cells but might also have mediated glioma-associated microglia/macrophage infiltration in the brain.
Materials and Methods
Cell Culture
The rat glioma C6 cell line was provided by Dr. Henrich Cheng (Taipei Veterans General Hospital) and was originally purchased from the National Health Research Institute Cell Bank (Zhunan). In the current work, this C6 cell line is referred to as C6-1. Another rat glioma C6 cell line, obtained from the American Type Culture Collection (ATCC), is referred to as C6-2 in this study. C6-1 and C6-2 cells were grown in culture flasks in Dulbecco's modified Eagle's medium (DMEM)/F12 containing 10% heat-inactivated fetal bovine serum (FBS) (HyClone). The human malignant glioma cell line, so-called U87 MG, was obtained from ATCC and maintained in DMEM containing 10% FBS. DMEM/F12 culture medium and antibiotics were purchased from Invitrogen .
Primary microglia were isolated from cerebral cortices of neonatal Sprague-Dawley rat brain (P1-2) and cultured, as previously described.16 Dissociated cells were suspended in DMEM/F-12 medium with 10% FBS and then plated in 75 cm2 flasks precoated with poly-D-lysine (PDL; Sigma). After 7–8 days, microglia were collected using the shake-off method and seeded onto PDL-coated Transwell inserts for microglia invasion assay.
MTT Cell Growth Assay
Cell growth was determined using the MTT colorimetric assay. Cells were seeded at a density of 5 × 10³ per well for all cell lines in 24-well plates using DMEM/F12 medium containing 10% FBS. After harvest, MTT solution (5 mg/mL; Sigma) was added to every well for 4 hours, followed by incubation with 10% sodium dodecyl sulfate (SDS) in 0.01N HCl overnight at 37°C. Absorbance was measured at 595 nm using an ELISA-plated reader.
Primary Sphere Formation Assay
Culture media and serum supplement B27 were purchased from Invitrogen. Gliospheres, formed by the C6-1 and C6-2 cells, were seeded at a density of 1 × 10⁵ cells in 100 mm ultralow attachment culture dishes (Corning). Spheres were generated in neurobasal medium containing B27 serum supplement, 20 ng/mL of epidermal growth factor (EGF), and 20 ng/mL of basic fibroblast growth factor (bFGF) (Prospec). The cultures were harvested after 7 days and photographed under a phase-contrast microscope. Random fields (3.41 mm2) in each culture were photographed, and the cell spheres in each field were counted. The cell sphere size was also measured using Imaging J analysis software (NIH). Data were expressed as the number of cell spheres per field.
Colony Formation Assay
C6-1 and C6-2 cells were suspended at a density of 1 × 10⁴ cells per well with a top layer of 0.3% low melting point agarose on a base of 0.5% agar in a 6-well plate. After 14 days, the cultures were stained with 1% crystal violet. Alternatively, U87 MG cells were seeded at a density of 200 cells per well in a 6-well culture plate. The cultures were maintained in DMEM containing 10% FBS for 14 days and then fixed with 4% paraformaldehyde for 10 minutes, followed by staining using 0.05% crystal violet for 15 minutes. The number of colonies formed by C6 cells or U87 MG cells in each well were counted using Imaging J analysis software.
C6 Glioma Implantation
Adult female Sprague–Dawley rats (250 ± 50 g; n = 34) were kept according to the Institutional Animal Care and Use Committee (IACUC) guidelines of National Cheng Kung University. The experimental animals were anesthetized with pentobarbital (50 mg/kg) and placed in a stereotaxic frame (Stoelting). After the head was shaved and disinfected, a midline incision was made using a scalpel blade, and the underlying tissue was removed using blunt dissection. Using a dentist drill fitted with a 0.9 mm diameter carbide dental burr (ELA), we drilled a hole in the exposed skull (stereotactic coordinates: 2 mm posterior to bregma and 2 mm to the right of sagittal suture). A Hamilton syringe with a 25-gauge needle was positioned on top of the hole, inserted into the brain, and advanced to the depth of 3 mm. C6 cells were detached from a culture flask using 0.0025% trypsin/EDTA. After centrifugation, the cell pellet was resuspended in sterilized phosphate-buffered saline (PBS) to a final dilution of 2 × 10⁵ cells/μL. The fluid (5 μL) containing 1 × 10⁶ C6-1, C6-2, or genetically modified C6-1 cells was slowly injected into the cortical area just above the corpus callosum of the rats. After injection, the needle was maintained in the brain for an additional 2 minutes to reduce the possibility of the injected fluid leaking from the site. After 7, 14, and 30 days post C6 glioma cell implantation (dpi), the rats were euthanized by perfusion of normal saline and 4% paraformaldehyde. After postfixation in 4% paraformaldehyde for 3 days, the fixed brain tissues were cryoprotected in 30% (w/v) sucrose in PBS for 3 days. The brains were embedded in Tissue Tek OCT (Electron Microscopy Sciences) and then sectioned at 20 μm thickness.
Quantification of Glioma Tumor Volume
Tumor volume was measured by the method previously described.17 In brief, 20 hematoxylin and eosin (H&E)-stained coronal sections (20 μm thick) of each brain with a C6-implanted tumor were captured by a scanner, and the tumor areas were determined using UTHSCSA Image tool for Windows (University of Texas Health Science Center at San Antonio). The volume (mm3) of the tumor was derived from the tumor area (mm2) × number of slices x thickness of slices (20 μm).
Immunohistochemistry
Brain sections were permeabilized using 0.1% (v/v) Triton X-100 in PBS for 30 minutes and incubated with 5% horse serum for blocking purposes, followed by overnight incubation with anti-Iba1 (1:200; Wako Pure Chemical) or anti-Ki67 (1:200; ABcam) antibodies. On the next day, brain sections were incubated with the biotin-conjugated secondary antibody. The immunostaining for Iba1 or Ki67 was visualized using Vectastain ABC kit (Vector Laboratories) and chromogen, 3,3′diaminobenzidine tetrahydrochloride (DAB) (Sigma). Subsequently, tissue sections were counterstained with hematoxylin and dehydrated in ETOH solution (60%, 70%, 95% and 100%) and xylene.
RNA Purification, Microarray Assay and Data Processing
Total RNA was isolated from C6-1 and C6-2 cells using the RNeasy kit (Qiagen GmbH) according to the manufacturer's instructions. Biotin-labeled complementary cRNA was synthesized, purified, fragmented, and hybridized to the Affymetrix Rat Genome 230 2.0 array for analysis of more than 30 000 transcripts according to the manufacturer's instructions and using an Affymetrix GeneChip system. Microarray hybridization and raw data processing were performed in the Microarray Core Laboratory of the Core Instrument Center at the National Health Research Institutes. The images were scanned using a GeneChip Scanner 3000, while the CEL files were preprocessed using GeneSpringGX11 (Agilent Technologies). The expression patterns for C6-1 cells were then compared with those for C6-2 cells. The fold change cutoff was made at 2 with a P value <.05.
Quantitative Real-time Polymerase Chain Reaction
The quantitative-PCR (Q-PCR) LightCycler FastStart DNA Master SYBR Green I was purchased from Roche Diagnostics. Total RNA isolation and Q-PCR were performed as described in a previous work.18 PCR amplification of the genes analyzed in this study was performed for 10 minutes at 95°C, followed by 40 cycles at 95°C for 10 seconds, annealed at 60°C for 10 seconds, and extended at 72°C for 20 seconds. The results were normalized to those of the GAPDH control. PCR reactants were also analyzed on 1% agarose gels to confirm primer specificity by observing the purity of single PCR products during amplification. The specific primer sequences for the genes analyzed in the study were designed using the LightCycler Probe Design Software 2.0 from Roche Applied Science, and the oligonucleotides were purchased from MWG Biotech AG. The primer sequences are shown as Supplementary Table 1.
Lentivirus-mediated shRNA Targeting Rat CXCL12, Rat IL-33, Rat ST2, and Human IL-33
The shRNA-mediated knockdown of CXCL12/SDF-1, IL-33, and ST2 was performed using shRNA lentiviral particles (Biosettia Inc.), which were designed to suppress the production of CXCL12, IL-33, and ST2 in C6-1 cells or human IL33 (hIL33) in human glioma cells U87 MG. The cultures that were transfected with shRNA lentiviral particles with noneffective scrambled shRNA sequences were used as the control group (sh-ctrl). The lentivirus vector constructs used in this study included the following: pLV-mU6-[sh-scramble]EF1a-puromycin (lenti-sh-ctrl), pLV-mU6-[sh-rnoIL33]EF1a-puromycin (lenti-shIL33_301 and lenti-shIL33_795), pLV-mU6-[sh-scramble]EF1a-GFP-puromycin (lenti-sh-ctrl), pLV-mU6-[sh-CXCL12/SDF-1]EF1a-GFP-puromycin (lenti-sh-SDF1_247 and lenti-sh-SDF1_293), pLV-mU6-[sh-ST2]EF1a-puromycin (lenti-sh-ST2_529 and lenti-sh-ST2_771), and pLV-mU6-[sh-hIL33]EF1a-puromycin (lenti-sh-hIL33_487, and lenti-sh-hIL33_598). C6-1 cells or U87 MG cells at a density of 3 × 10⁵ cells per dish were seeded onto 35 mm dishes. After 1 day of seeding, 200 μL of lentiviral particles in 2 mL DMEM/F12 medium containing 10% FBS were added to the cultures, which were then incubated for 24 hours in 5% CO2 at 37°C. The cells that were successfully infected by lentiviral particles (lenti-sh-ctrl, lenti-sh-rnoIL33, lenti-shCXCL12/SDF-1, lenti-sh-ST2, or lenti-sh-hIL33) were selected using 3 μg/mL puromycin in the presence of 10% FBS for 48 hours. The cells (mock, IL33KD, CXCL12KD1, CXCL12KD2, ST2-KD1, ST2-KD2, hIL33-KD1, or hIL33-KD2) were then harvested and subjected to Q-PCR and Western blot analysis to determine the efficiency of used lentiviral particles for suppressing IL-33 or CXCL12/SDF-1 gene expression.
Lentivirus-mediated Gene Delivery of Rat IL-33
Recombinant lentivirus particles (lenti-CMV-MCS-EF1a-puromycin and lenti-CMV-rnoIL33-EF1a-puromycin) were provided by Biosettia. Lentivirus-mediated gene transduction was performed by the procedure previously described. Briefly, C6-2 cells were infected with the indicated lentivirus particles (800 μL virus particles versus 1 × 10⁶ cells) in DMEM/F-12 medium containing 10% FBS. Twenty-four hours after transduction, the transduced cells were grown in fresh 10% FBS-containing medium for another 48 hours. C6-2 cells transduced by mock or rnoIL33 were selected in 10% FBS-containing medium plus 3 μg/mL puromycin (Sigma) for 48 hours.
Western Blot Analysis
Samples were homogenized on ice in PBS containing 0.1% SDS, 1 mM PMSF, 1 mM EDTA, 1 mM sodium orthovanadate, and proteinase inhibitor cocktail. After being centrifuged at 10 000 × g for 10 minutes, the protein concentration of the supernatant was determined with a Bio-Rad DC protein assay kit (Bio-Rad Laboratories). Samples containing 100 μg of protein and SDS-PAGE loading buffer with 4% β-mercaptoethanol were heated in the boiling water for 5 minutes and then loaded on a 10% polyacrylamide gel. Electrophoretic transfer to nitrocellulose membranes was followed by immunoblotting with anti-IL33 (Santa Cruz Biotechnology) and anti-ST2 antibodies (Santa Cruz Biotechnology) or GAPDH (Millipore). This was followed by hybridization with a secondary antibody conjugated with peroxidase. The signal was detected by chemiluminescence using the ECL-Plus detection system (PerkinElmer Life Sciences).
Microglia Invasion Assay
The migration of microglia in vitro was determined by using 24-well format 8.0-μm pore size Transwell inserts (Millipore and Falcon). C6-1 and C6-2 cells were plated at a density of 5 × 10⁴ cells per well in the 24-well plates. Twenty-four hours later, rat primary microglia were seeded onto PDL-coated Transwell inserts at the density of 1 × 10⁴ cells/well and then co-cultured with C6-1, C6-2, genetically modified C6-1, or genetically modified C6-2 cells for 8 hours. To study the role of chemokine (C-C motif) ligand 7 (CCL7) in microglia invasion, microglia and genetically modified C6-1 cells were co-cultured in the presence of IgG isotype control (1:200; BD Pharmingen) or anti-CCL7 antibodies (1:200; Abcam) for 8 hours. The inserts were then removed and fixed in 4% paraformaldehyde for 10 minutes, followed by staining with 0.05% crystal violet in PBS for 10 minutes. The upper surfaces of the Transwell inserts were carefully cleansed with cotton swabs. Microglia migration was quantified by counting the number of cells that migrated through the membrane to the other side. Microglia invasion was determined by counting cells on another side of the Transwell inserts from 5 randomly selected fields under microscope. The results are represented as the percentage of migrated cells over the total seeded microglia per culture.
Statistical Analysis
All experiments were repeated at least 3 times, and data were analyzed for statistical significance by the 2-tailed unpaired Student' t test using SigmaPlot 10 (Systat Software Inc.). The data are expressed as means ± SEM. In all comparisons, differences are considered statistically significant at P < .05.
Results
Proliferation and Tumorigenicity of C6-1 and C6-2 Glioma Cells
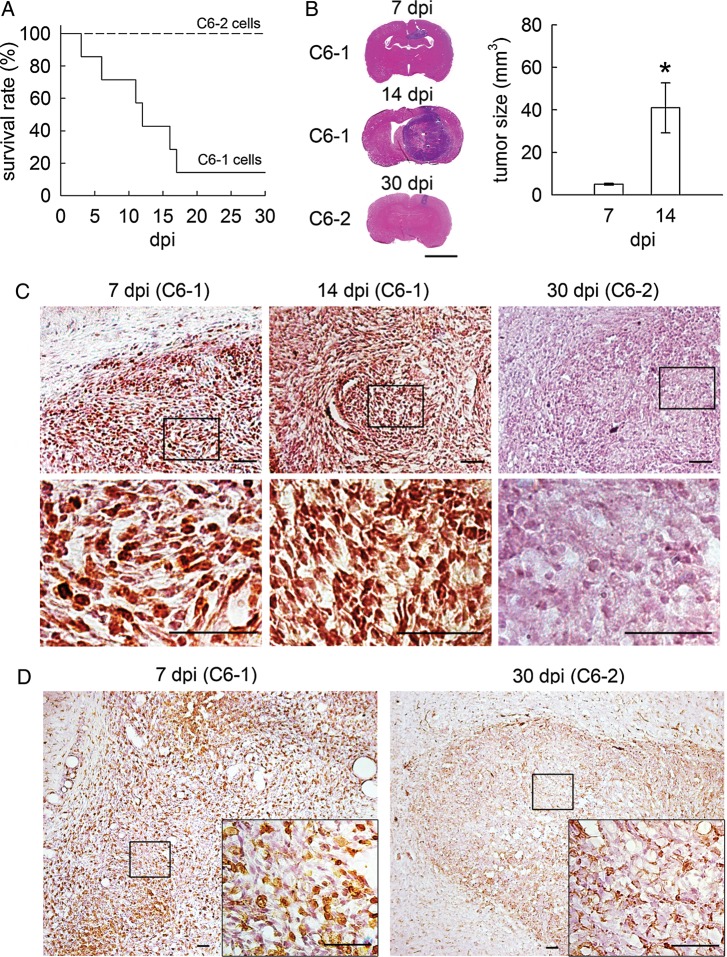
C6-1 cell clones have been used in our laboratory and other laboratories to form aggressive glioma in rat brains.17,19,20 In this study, the transplantation of 1 × 10⁶ cells of the 2 C6 clones into rat cerebral cortex was carried out to compare the tumorigenicity of C6-1 with C6-2. The median survival of C6-1 tumor-bearing rats was 12 days after implantation (dpi) (Fig. 1A), whereas rats with C6-2 cell implantation survived to the end of the experimental period. Moreover, C6-1 cells were able to develop tumors in implanted brains at 7 dpi (Fig. 1B). The tumor volume formed by C6-1 cells at 7 dpi and 14 dpi was quantified as 5.1 ± 0.40 mm3 and 41 ± 11.71 mm3, respectively (Fig. 1B), indicating that the C6-1 formed tumors displayed time-dependent growth in vivo. Through Ki-67 staining, we found that Ki-67+ cells accumulated at high levels in the C6-1 formed tumor at 7 dpi and 14 dpi (Fig. 1C). However, relatively small tumors were found in brains receiving C6-2 cell transplantation at 30 dpi (Fig. 1B), and Ki-67+-cells were not observed in the C6-2 transplanted sites at 30 dpi (Fig. 1C). Moreover, extensive amounts of Iba1+-microglia and macrophages were observed in tumor formed by C6-1 cells, whereas infiltrating microglia/macrophages in tumor formed by C6-2 were few (Fig. 1D).
Fig. 1.
Progressive tumor formation induced by C6-1 cells in the rat cortex. (A). The survival of rats receiving C6-1 cells (n = 7 rats) and C6-2 cells (n = 10 rats) was examined over 30 days using Kaplan–Meier survival plot analysis. (B). The brain tissue sections were prepared from C6-1 tumor-bearing rats at 7 days and 14 days postimplantation (dpi). The brain tissues were collected from rats at 30 days after implantation of C6-2 cells. The tissues were subjected to H&E histological staining. The tumor volume in C6-1 tumor-bearing rats at 7 dpi and 14 dpi was measured (n = 3 rats per time point). Note that the tumor volume of rats with C6-2 cell implantation was 0.12 ± 0.09 mm3 at 30 dpi (n = 3 rats). (C). The brain sections from the 3 indicated animal groups, as above, were subjected to Ki67 immunostaining. Note that Ki67+-cells were rarely observed in the C6-2 formed tumor at 30 dpi. The images with a higher magnification (bottom panel) were derived from the indicated areas in the upper panels. (D). The brain sections collected from C6-1 or C6-2 bearing rats were subjected to Iba1 immunostaining for the identification of infiltrating microglia/macrophages. Iba1+-microglia/macrophages (brown) were accumulated in the tumor formed by C6-1 cells. The insets in D show 40x magnification images of areas indicated by boxes (10x magnification). Results are expressed as means ± SEM of triplicates. *P < .05 versus the group at 7 dpi. Scale bar in B, 5 mm; in C and D, 50 μm.
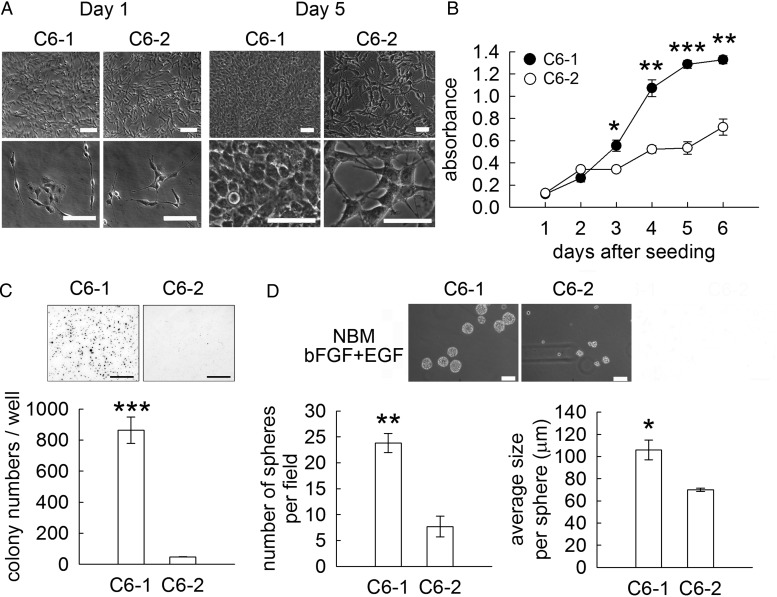
To examine the distinct proliferative potentials of the 2 C6 cell clones, a series of in vitro experiments was conducted. As shown in Fig. 2A, no difference in the morphology of the 2 C6 cell clones in serum-containing culture media was observed at day 1 after replating, whereas the cell density of the C6-1 cells cultured in serum-containing medium increased at day 5 after replating. The results of the MTT cell proliferation assay showed that the growth rate of C6-1 cells cultured in serum-containing medium was higher than that of C6-2 cells (Fig. 2B). The colony formation assay also indicated that there was an increase in the number of C6-1-formed colonies and their size when compared with those observed in C6-2 cultures (Fig. 2C). Furthermore, we observed that the self-renewal ability of C6-1 cells was greater than that of C6-2 cells (Fig. 2D). Altogether, our observations revealed that C6-1 cells proliferate aggressively and have a strong tumorigenic characteristic.
Fig. 2.
Enhanced cell growth of C6-1 cells compared with C6-2 cells. (A). No significant morphological differences were observed between C6-1 and C6-2 cells at 1 day and 5 day-cultures under a phase-contrast microscope. (B). The growth curves of C6-1 and C6-2 cells were obtained using an MTT assay when the 2 cell lines were cultured in serum-containing medium at the indicated days after seeding. (C).The 2 C6 cell lines were seeded onto the soft agar for colony formation analysis. After 14 days, the cultures were subjected to crystal violet staining. The crystal violet stained colonies were then quantified. (D). A neurosphere assay was performed by culturing the 2 cell lines in neurobasal medium containing 20 ng/mL of bFGF and EGF for 7 days. The number of cell spheres and the sphere size were measured. Data are means ± SEM of at least 3 independent experiments. *P < .05, **P < .01, ***P < .001 versus C6-2. Scale bar in A, 50 μm; in C, 5 mm; in D, 100 μm.
Increased Expression of Cytokines and Chemokines in Tumorigenic C6 Glioma Cells
To identify the genes involved in the enhanced growth of C6-1 cells compared with C6-2 cells, we performed genome-wide cDNA expression profiling on C6-1 and C6-2 cells. The functional analysis of gene ontology (GO) biological processes shows that the upregulated genes found in C6-1 cells are closely related to cell proliferation (Supplementary Tables 2 and 3). We found that 20 genes were involved in cancer-related pathways (Table 1). Additionally, several cytokines, chemokines, and chemokine receptors were differentially expressed in C6-1 and C6-2 cells. As shown in Table 2, the enriched expression of interleukin-1 (IL-1) superfamily members, interleukin-33 (IL-33) and interleukin-18 (IL-18), chemokine (C-X-C motif) ligand 12/stromal cell-derived factor1(CXCL12/SDF1), chemokine (C-X-C motif) ligand 1(CXCL1), CCL7/monocyte chemotactic protein-3 (MCP-3), and chemokine (C-C motif) ligand 2 (CCL2) was found in C6-1 cells compared with C6-2 cells. Moreover, the receptors for CXCL12/SDF1 and IL-18 (CXCR7 and IL18R) were expressed at a higher level in C6-1 cells than in C6-2 cells.
Table 1.
List of genes involved in pathways in cancers with an increased level in C6-1 versus C6-2
| Probe Set ID | Gene Symbol | Gene Title | Fold Change | P Value |
|---|---|---|---|---|
| 1368527_at | Ptgs2 | Prostaglandin-endoperoxide synthase 2 | 165.02 | 2.66E-06 |
| 1368174_at | Egln3 | EGL nine homolog 3 (C. elegans) | 15.20 | 2.28E-04 |
| 1381449_s_at | Tgfa | Transforming growth factor alpha | 7.99 | 2.45E-03 |
| 1370830_at | Egfr | Epidermal growth factor receptor | 7.68 | 7.41E-05 |
| 1368641_at | Wnt4 | Wingless-type MMTV integration site family, member 4 | 7.60 | 4.10E-04 |
| 1379340_at | Lamc2 | Laminin, gamma 2 | 6.23 | 2.22E-05 |
| 1398275_at | Mmp9 | Matrix metallopeptidase 9 | 5.82 | 1.66E-02 |
| 1391022_at | Lamb3 | Laminin, beta 3 | 4.57 | 8.98E-05 |
| 1369263_at | Wnt5a | Wingless-type MMTV integration site family, member 5A | 3.31 | 3.83E-03 |
| 1387232_at | Bmp4 | Bone morphogenetic protein 4 | 3.27 | 1.02E-03 |
| 1369884_at | Fgf7 | Fibroblast growth factor 7 | 3.04 | 5.11E-03 |
| 1370642_s_at | Pdgfrb | Platelet derived growth factor receptor, beta polypeptide | 2.71 | 1.12E-04 |
| 1369191_at | Il6 | Interleukin 6 | 2.45 | 1.96E-04 |
| 1369262_at | Casp8 | Caspase 8 | 2.39 | 5.42E-05 |
| 1392865_at | Fgf9 | Fibroblast growth factor 9 | 2.38 | 6.67E-05 |
| 1368424_at | Ikbkb | Inhibitor of kappa light polypeptide gene enhancer in B-cells, kinase beta | 2.32 | 4.38E-04 |
| 1392382_at | Tgfb2 | Transforming growth factor, beta 2 | 2.17 | 2.75E-03 |
| 1379815_at | LOC683733 | Similar to Transcription factor 7-like 2 (HMG box transcription factor 4) (T-cell-specific transcription factor 4) (TCF-4) (hTCF-4) | 2.09 | 2.40E-02 |
| 1388494_at | Col4a2 | Collagen, type IV, alpha 2 | 2.08 | 1.15E-03 |
| 1368308_at | Myc | Myelocytomatosis oncogene | 2.07 | 1.77E-04 |
Table 2.
Gene list of cytokines and chemokines with a higher level in C6-1 cells versus C6-2 cells
| Probe Set ID | Gene Symbol | Gene Title | Fold Change | P Value |
|---|---|---|---|---|
| 1373970_at | Il33 | Interleukin 33 | 151.93 | 3.02E-06 |
| 1389581_at | Il33 | Interleukin 33 | 104.10 | 2.39E-06 |
| 1388583_at | Cxcl12 | Chemokine (C-X-C motif) ligand 12 (stromal cell-derived factor 1) | 22.40 | 1.50E-05 |
| 1369633_at | Cxcl12 | Chemokine (C-X-C motif) ligand 12 (stromal cell-derived factor 1) | 18.65 | 2.53E-06 |
| 1367940_at | Cxcr7 | Chemokine (C-X-C motif) receptor 7 | 12.59 | 2.62E-05 |
| 1387316_at | Cxcl1 | Chemokine (C-X-C motif) ligand 1 (melanoma growth stimulating activity, alpha) | 8.88 | 4.22E-06 |
| 1379935_at | Ccl7 | Chemokine (C-C motif) ligand 7 | 7.00 | 1.53E-05 |
| 1369665_a_at | Il18 | Interleukin 18 | 6.92 | 1.97E-04 |
| 1367973_at | Ccl2 | Chemokine (C-C motif) ligand 2 | 6.11 | 7.11E-05 |
| 1384939_at | Il18r1 | Interleukin 18 receptor 1 | 4.95 | 6.98E-05 |
| 1387273_at | Il1rl1 | Interleukin 1 receptor-like 1 | 3.16 | 2.63E-03 |
| 1369191_at | Il6 | Interleukin 6 | 2.45 | 1.96E-04 |
| 1370905_at | Dock9 | Dedicator of cytokinesis 9 | 2.43 | 2.33E-04 |
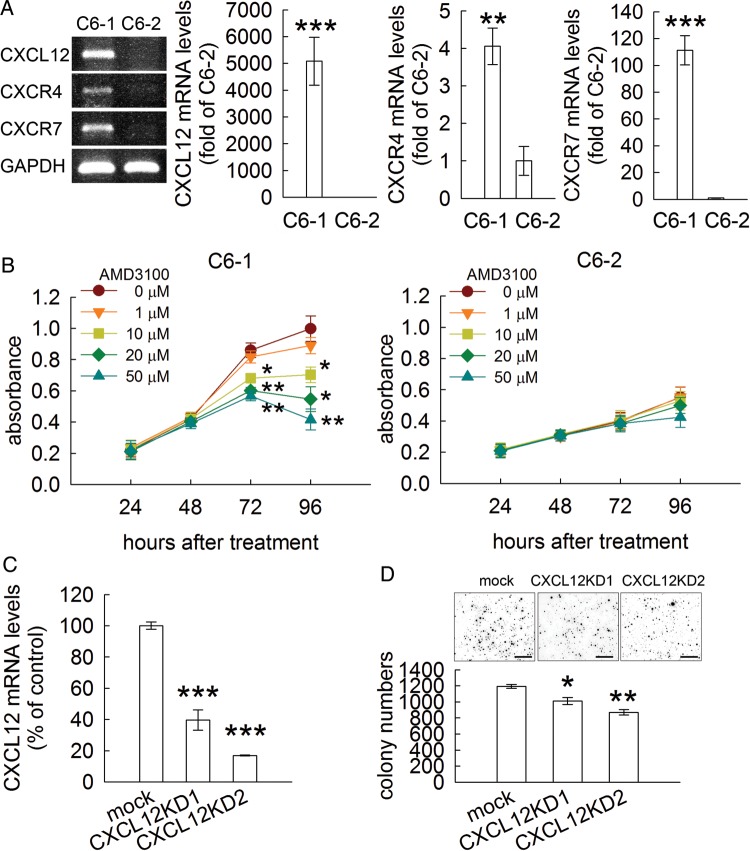
Among genes in the cytokine/chemokine cluster, CXCL12 (also named SDF-1) and CXCR7 were highly expressed in C6-1 cells compared with in C6-2 cells (Table 2). Gel-based RT-PCR analysis showed that increased CXCL12 mRNA levels were found in C6-1 cells, whereas there was an undetectable level of CXCL12 in C6-2 cells (Fig. 3A). The upregulation of CXCL12 mRNA in C6-1 cells was further confirmed by Q-PCR (Fig. 3A). Moreover, its receptors (CXCR4 and CXCR7) were expressed at higher levels in C6-1 cells than in C6-2 cells (Fig. 3A). To examine whether CXCL12 action mediated enhanced proliferation of C6-1 cells, the antagonist of CXCR4 (AMD3100) was applied to the C6-1 and C6-2 cultures. As shown in Fig. 3B, treatment with AMD3100 at 10 μM, 20 μM, and 50 μM effectively suppressed the proliferation of C6-1 cells. AMD3100 at 20 μM and 50 μM for 96 hours caused 50% and 60% reductions in C6-1 cell proliferation, respectively. However, AMD3100 at the concentrations used in this study did not affect the growth curve of C6-2 cells (Fig. 3B). The results from further experiments also showed that lenti-sh-CXCL12/SDF-1 reduced CXCL12 mRNA expression in C6-1 cells (CXCL12KD1 and CXCL12KD2) (Fig. 3C) and led to a decline in the ability of C6-1 to form colonies (Fig. 3D). Thus, C6 glioma cells increased CXCL12 expression, which in turn promoted their clonogenic ability through paracrine and autocrine pathways.
Fig. 3.
C6-1 cell growth suppressed by inhibition of CXCL12 action. (A). CXCL12, CXCR7, and CXCR4 mRNA levels in C6-1 and C6-2 cells were measured by Q-PCR. The 3 genes were expressed abundantly in C6-1 cells but not in C6-2 cells. Gel-based RT-PCR was used to verify the specificity of the primers for CXCL12, CXCR4, and CXCR7 (left-hand panel). (B) After treatment of C6-1 or C6-2 cells with AMD3100 (a CXCR4/CXCR7 inhibitor) for the various time periods indicated above, the cultures were subjected to MTT cell viability assay. AMD3100 at the concentrations greater than 10 μM effectively suppressed C6-1 cell growth but had no effect on the cell growth of C6-2 cells. (C) C6-1 cells were infected by control lentivirus (mock), lentivirus clones encoding shRNA (lenti-sh-SDF1_247 and lenti-sh-SDF1_293) against CXC12/SDF-1 expression (CXCL12KD1 and CXCL12KD2). (D). CXCL12KD1 and CXCL12KD2 were reseeded onto the soft agar plates for the observation of colony formation. Data are means ± SEM of at least 3 independent experiments. *P < .05, **P < .01, ***P < .001 versus C6-2 (A), control at the relative time point (B), or mock (C and D). Scale bar in D, 5 mm.
IL-33/ST2 Axis Increased Glioma Cell Growth and Migration
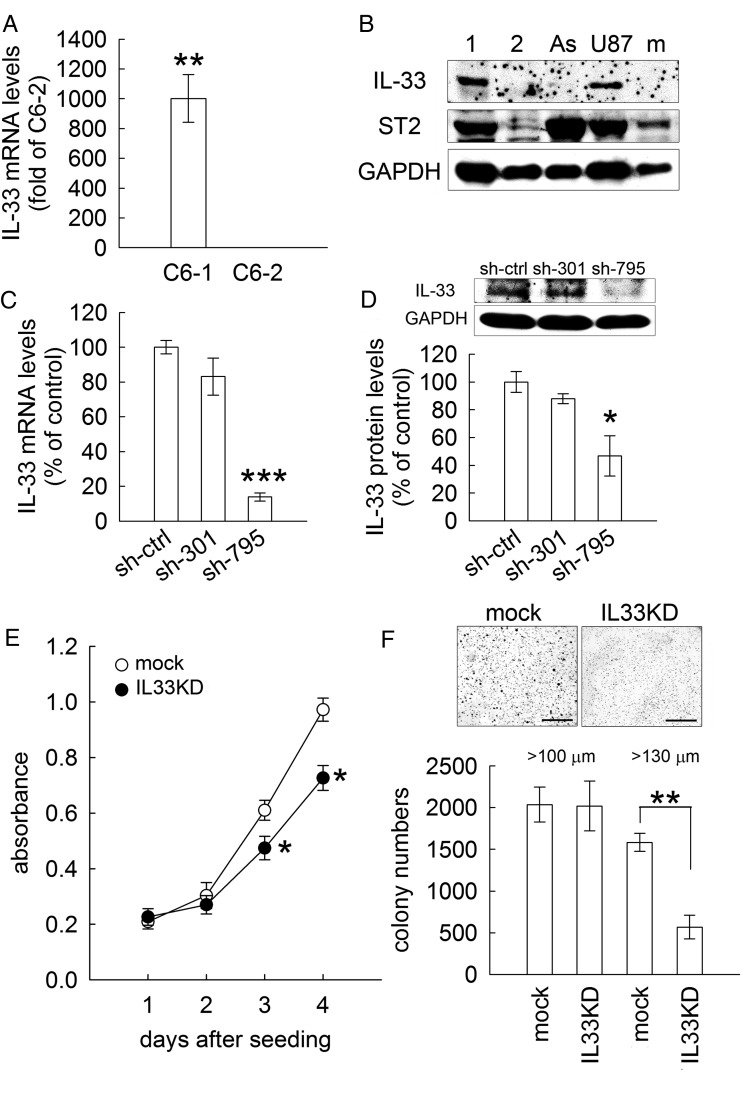
IL-33 (also known as IL-1F11) is a recently discovered IL-1 superfamily member and has been reported to be induced in astrocytes in the CNS.21 The IL-33 receptor ST2 is highly expressed in microglia and astrocytes.21 As shown in Table 2, there was significant expression of IL-33 in C6-1 cells. These results were validated by Q-PCR for the measurement of IL-33 mRNA levels in C6-1 and C6-2 cells (Fig. 4A). Moreover, Western blot analysis showed that IL-33 proteins were highly expressed in tumorigenic C6 cells and human U87MG, whereas no detectable level was observed in C6-2 cells (Fig. 4B). Like primary astrocytes and microglia, we also noticed that tumorigenic C6 cells and human U87MG expressed the receptor for IL-33 (ST2) (Fig. 4B) but it was much less expressed in C6-2 cells. The results suggested that C6-1 cells were able to respond to IL-33 by paracrine and autocrine actions. Furthermore, we used the lentivirus-mediated IL-33 gene knockdown approach to inhibit IL-33 mRNA (Fig. 4C) and IL-33 proteins (Fig. 4D) in C6-1 cells infected by lenti-IL33_795 (C6-IL33KD) but not by sh-ctrl (C6-mock) and shIL33_301. We also found that the cell proliferation level of C6-IL33KD was only 70% of that seen in C6-mock (Fig. 4E). The results from the soft agar colony formation assay also indicated that a lower number of cell colonies with diameter greater than 130 μm were found in C6-IL33KD (Fig. 4F).
Fig. 4.
An increased gene expression of IL-33 improves C6-1 cell growth. (A) IL-33 mRNA levels in C6-1 and C6-2 cells were measured by Q-PCR. The IL-33 gene was exclusively expressed in C6-1 cells but not in C6-2 cells. (B). Western blot analysis was performed to examine the expression of IL-33 and its receptor ST2 in C6-1 (1), C6-2 (2), primary rat astrocytes (As), human U87MG (U87), and microglia (m). The GAPDH protein level was used as a loading control. (C and D). C6-1 cells were treated with control lentivirus (sh-ctrl) or lentivirus particles encoding shRNAs against IL-33 mRNA expression (lenti-sh-IL33_301 and lenti-sh-IL33_795) and then subjected to Q-PCR (C) and Western blot analysis (D) for IL-33 expression. Lenti-sh-IL33_795 was more efficient with regard to IL-33 knockdown. (E). The cell viability of C6-1 cells infected with lenti-sh-IL33_795 (IL33KD) or with sh-ctrl (mock) was examined using MTT assay at the indicated time points. A slower growth rate of IL33KD cells was observed when compared with that of mock cells. (F). Mock and IL33KD cells were subjected to the colony formation assay. A comparison of colonies formed by C6-mock and C6-IL33KD indicated that the number of IL33KD-formed colonies with diameter greater than 130 μm were significantly reduced. Data are means ± SEM of at least 3 independent experiments. *P < .05, **P < .01, ***P < .001 versus C6-2 (A), sh-ctrl (C), and mock (D and E). Scale bar in E, 100 μm.
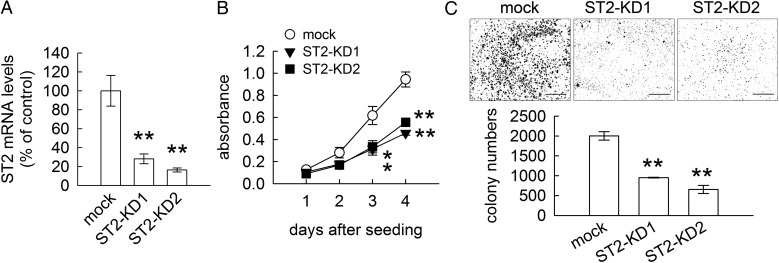
To verify the involvement of IL-33 receptor ST2 in the cell growth of tumorigenic C6 cells, the knockdown of ST2 expression was performed using lentivirus-mediated gene transfer approach. ST2 mRNA expression was effectively inhibited in tumorigenic C6 cells after infection by lenti-sh-ST2_529 (ST2-KD1) or lenti-sh-ST2_771 (ST2-KD2) when compared with that detected in mock cells (Fig. 5A). Moreover, the cell growth and colony formation of tumorigenic C6 cells declined after ST2 gene expression was significantly reduced (Fig. 5B and C). These results revealed that IL-33 and its receptor ST2 contribute to the high proliferative rate of tumorigenic C6 cells.
Fig. 5.
Inhibition of C6-1 cell growth by knockdown of IL-33 receptor ST2. (A). C6-1 cells were treated with control lentivirus (sh-ctrl) or lentivirus particles encoding shRNAs against ST2 (lenti-sh-ST2_529 and lenti-sh-ST2_771), and then subjected to Q-PCR for ST2 mRNA expression. ST2 mRNA expression was significantly reduced in C6-1 cells after infection by lenti-sh-ST2_529 or lenti-sh-ST2_771 (ST2-KD1 or ST2-KD2). (B). The cell proliferation of ST2-KD1 or ST2-KD2 was examined using MTT assay at the indicated time points. ST2-KD1 and ST2-KD2 proliferated with a lower rate when compared with that of mock cells. (C). Mock, ST2-KD1 and ST2-KD2 were subjected to the colony formation assay. The number of ST2-KD formed colonies was significantly reduced. Data are means ± SEM of at least 3 independent experiments. **P < .01 versus mock. Scale bar in C, 5 mm.
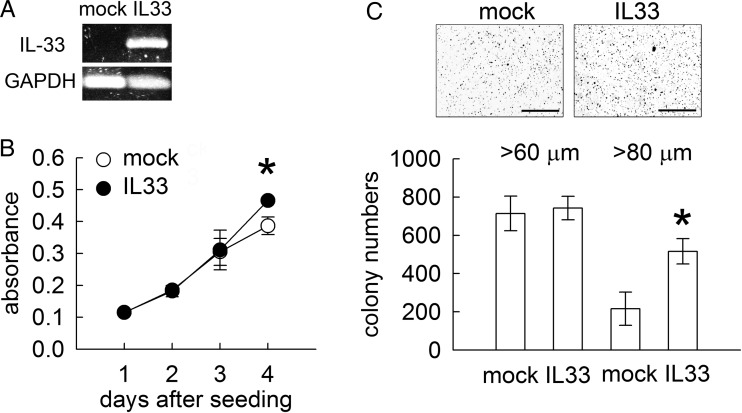
To determine if IL-33 could stimulate the proliferation of a C6-2 cell line displaying a slow growth rate (Fig. 2B and C), we performed the overexpression of IL-33 gene in C6-2 cells through lentivirus-mediated gene delivery. As shown in Fig. 6A, C6-2 cells infected by lenti-rIL-33 expressed a high level of IL-33, whereas an undetectable level of IL-33 mRNA was observed in C6-2 mock cells (Fig. 6A). MTT cell proliferative assay showed that IL-33 gene overexpression promoted C6-2 cell growth (Fig. 6B). Moreover, the number of C6-2 formed cell colonies with diameter greater than 80 μm was increased after overexpression of IL-33 gene when compared with mock culture (Fig. 6C).
Fig. 6.
Effect of IL-33 on the stimulation of C6-2 cell growth. (A). C6-2 cells were infected with control lentivirus (mock) or lentivirus particles encoding rat IL-33 cDNA (IL33). The stable infectants were then subjected to Q-PCR for rat IL-33 mRNA expression. C6-2 cells with rat IL-33 gene overexpression produced high levels of IL-33 mRNA. (B). The cell proliferation of C6-2-IL33 was examined using MTT assay at the indicated time points. The proliferation of C6-2 cells was promoted after IL-33 gene overexpression when compared with that of C6-mock. (C). C6-2-mock and C6-2-IL33 were subjected to the colony formation assay. The number of C6-2-IL33-formed colonies at the diameter greater than 80 μm was significantly increased. Data are means ± SEM of at least 3 independent experiments. *P < .05 versus mock. Scale bar in C, 5 mm.
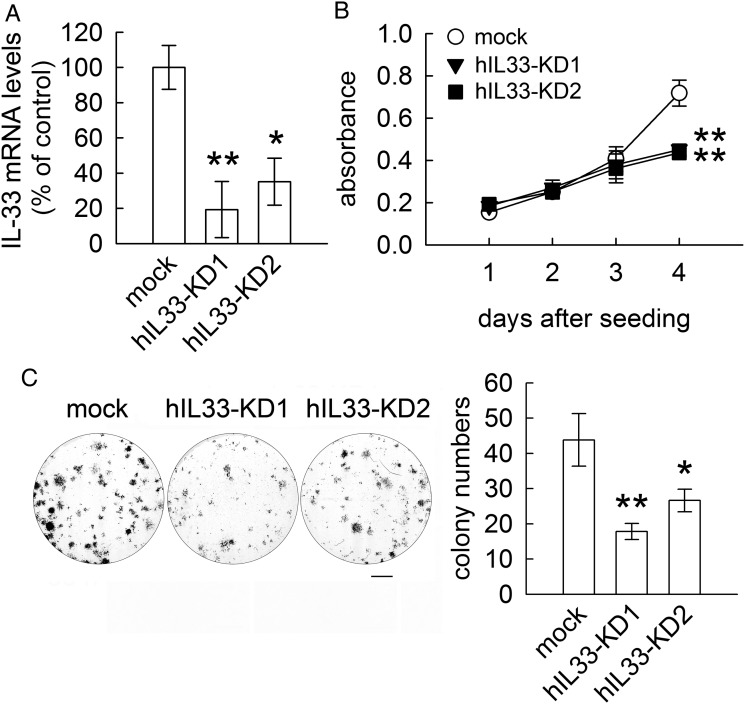
Given the fact that U87 MG cells expressed a high level of hIL-33 mRNA (Fig. 4B), the role of IL-33 in the involvement of U87 MG cell proliferation was also determined in the study. The inhibition of hIL33 gene expression in U87 MG cells was done by lentivirus-mediated shRNA delivery. As shown in Fig. 7A, the lentivirus particles encoding shRNA against hIL33 (sh-hIL33_487 and sh-hIL33_598) effectively inhibited IL33 gene expression in U87 MG cells (hIL33-KD1 and hIL33-KD2). The results from MTT assay indicated that IL-33 gene silence suppressed U87 MG cell proliferation when compared with that observed in mock-U87 MG cells (Fig. 7B). The colony formation analysis also showed that fewer colonies formed by U87-sh-hIL33 KD1 and U87-sh-hIL33 KD2 were observed (Fig. 7C). The results further confirmed that IL-33 contributes to cell growth of glioma cells.
Fig. 7.
Inhibition of IL-33 gene expression reduces human glioma cell growth. (A). Human glioma cell line U87 MG was transduced by control lentivirus (mock) or lentivirus particles encoding shRNAs against human IL-33 (lenti-sh-hIL33_487 and lenti-sh-hIL33_598) and then subjected to Q-PCR for measurement of hIL-33 mRNA expression. The expression of hIL-33 mRNA was significantly reduced in U87 MG cells after infection by lenti-sh-hIL33_487 or lenti-sh-hIl33_598 (hIL33-KD1 or hIL33-KD2). (B). The cell proliferation of mock, hIL33-KD1 or hIL33-KD2 was examined using MTT assay at the indicated time points. The proliferation of hIL33-KD1 and hIL33-KD2 cells declined. (C). U87-mock, U87-hIl33-KD1, and U87-hIl33-KD2 were subjected to the colony formation assay. The number of U87-hIl33-KD-formed colonies was significantly reduced. Data are means ± SEM of 3 independent experiments. *P < .05, **P < .01 versus U87-mock. Scale bar in C, 100 μm.
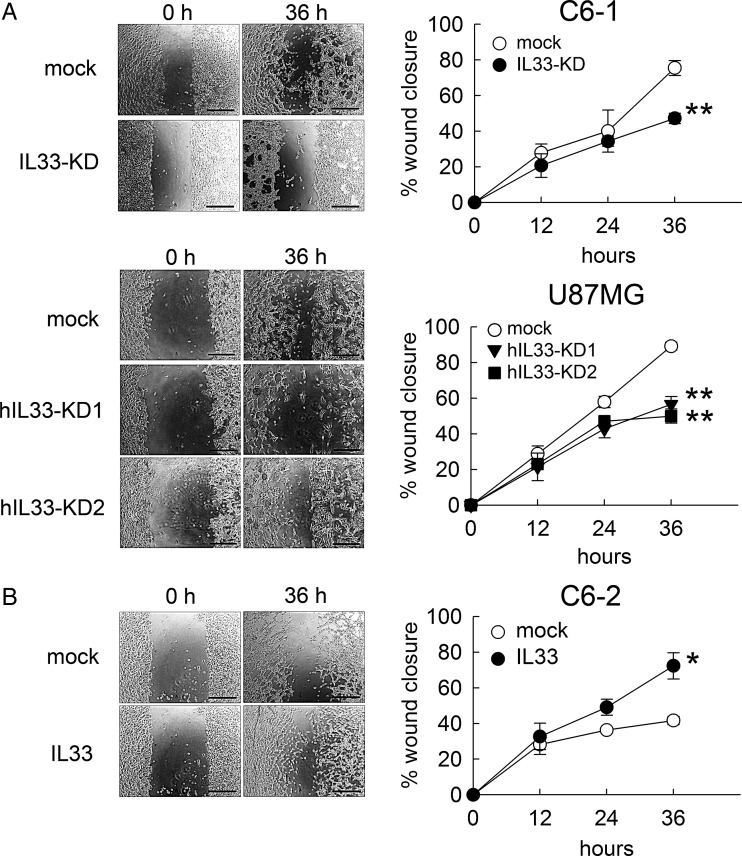
Furthermore, cell scratch analysis was conducted to evaluate if IL-33 is involved in the regulation of glioma cell migration. The results showed that the wound closure ability of C6-1 and U87 MG cells was significantly reduced after the inhibition of IL-33 gene expression by lentivirus-mediated shRNA approach (Fig. 8A). However, the better wound closure ability of C6-2 cells was detected when compared with that observed in mock-C6-2 cell culture (Fig. 8B). The findings revealed that IL-33 exerts the stimulatory effects on glioma cell migration.
Fig. 8.
Effect of IL-33 on the regulation of glioma cell migration. C6-1-mock, C6-1-IL33-KD, U87-mock, U87-IL33KD1, and U87-IL33KD2 were maintained in 10% FBS-containing medium (A). C6-2-IL33 cells grew in 10% FBS-containing medium (B). The cultures were subjected to scratch migration assay after the cell density of the cultures reached confluence. The quantification of wound closure was assessed at the initial point and the other indicated time points. The results were expressed as the percentage of wound closure by measuring migrating cell cover area over the wound area observed at the initial time point. Data are means ± SEM of at least 3 independent experiments. *P < .05, **P < .01 versus mock. Scale bars in A and B, 500 μm.
IL-33 Gene Knockdown Reduced C6-1–formed Tumor Volume in Rat Brains
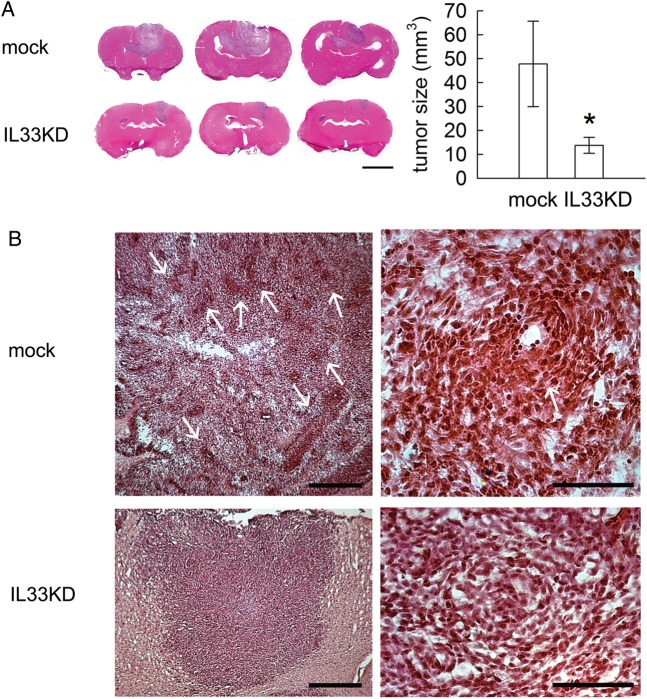
To further determine if IL-33 was involved in tumor formation, C6-1-mock or C6-1-IL33KD cells were transplanted into rat cerebral cortex at the density of 1 × 10⁶ cells. As shown in Fig. 9A, the inhibition of IL-33 caused profound reduction in C6-1–formed tumor volume (13.74 ± 3.35 mm3) when compared with that observed in mock cells (47.78 ± 17.89 mm3). Moreover, we observed that mock-C6 cells were scattered in the implanted site. However, C6-1–mock cells densely packed in a tumor mass (Fig. 9B, arrows). These results demonstrated that the growth of C6-1 cells was attenuated in vivo after IL-33 gene knockdown.
Fig. 9.
Tumor formation is reduced by knockdown of IL-33 gene expression in C6-1 cells. 1 × 10⁶ cells of C6-1 cells infected by sh-ctrl (mock) or by sh-IL33 (IL33-KD) were implanted into rat cerebral cortex. At 14 dpi, brains were removed and sectioned. (A). Brain sections were subjected to H&E staining to determine the tumor volume. (B). Representative photomicrographs of H&E-stained tumor indicate cell masses packed in the tumor formed by C6-1-mock (arrows) (B). Data consist of means ± SEM (mock, n = 4 rats; IL33-KD, n = 8 rats). *P < .05 versus mock. Scale bars in A, 5 mm; in B (left panel), 500 μm; in B (right panel), 100 μm.
IL-33 Mediated the Expression of Chemokines and Cytokines in Tumorigenic C6 Cells
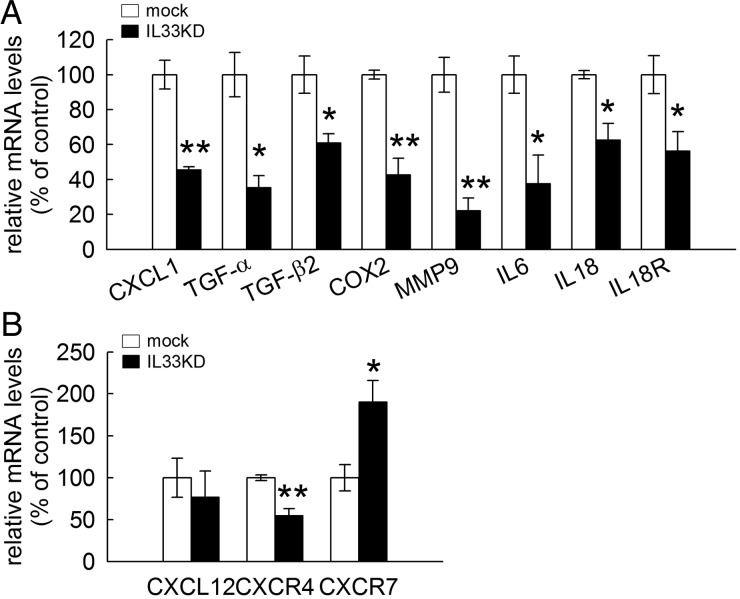
Given that several chemokines and chemokine receptors were abundantly expressed in C6-1 cells (Table 2), we examined whether a reduction in IL-33 expression could affect the expression of these molecules in C6-1 cells. We found that C6-IL33KD expressed CXCL1, TGF-α, and TGF-β2 mRNA at lower levels than those detected in C6-mock (Fig. 10A).Moreover, knockdown of IL-33 gene expression also attenuated the expression of COX-2, MMP-9, and IL-6 (Fig. 10A); the latter 2 gene expressions were also detected in C6-1 cells at a level twice that seen in C6-2 cells (Table 1). A reduction in IL-18 and its receptor IL-18R1 mRNA levels was also detected in C6-1 cells after the inhibition of IL-33 gene expression (Fig. 10A). The downregulation of CXCR4 gene expression was observed in C6-IL33KD cells (Fig. 10B). Although CXCR7 expression was upregulated in C6-1 cells with IL-33 gene knockdown, there was no significant difference in the expression of CXCL12 between C6-mock and C6-IL33KD (Fig. 10B).
Fig. 10.
Alteration of cytokine and chemokine gene expression in C6-1 cells by IL-33 gene knockdown. (A). C6-1 cells infected by sh-ctrl (mock) or by sh-IL33 (IL33KD) were subjected to Q-PCR analysis to examine the mRNA expression of cytokines, chemokines, and their receptors, as indicated. The expression of the genes that were highly expressed in C6-1 cells was reduced after IL-33 gene expression was suppressed in C6-1 cells. (B). The expression of CXCL12, CXCR4, and CXCR7 mRNA in mock and IL-33KD cells was also examined by Q-PCR analysis. Data are means ± SEM of 3 independent experiments. *P < .05; **P < .01 versus mock.
CCL7/MCP-3 Upregulation in C6-1 Cells
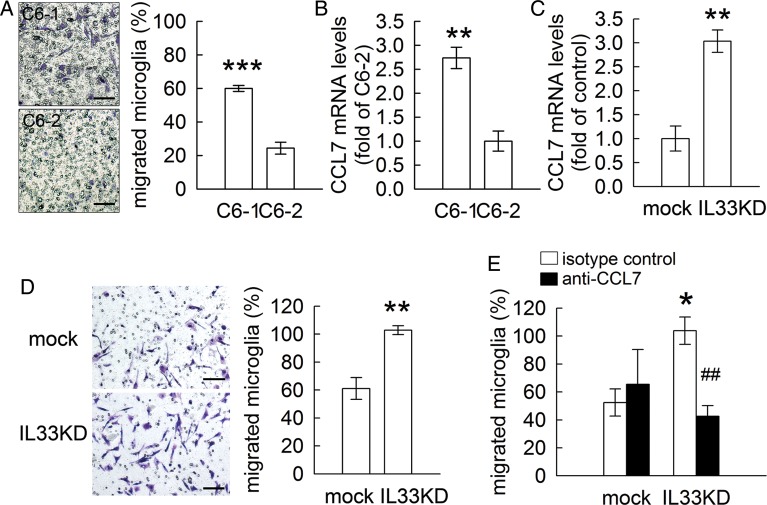
Given that C6-1 cells expressed high levels of chemokines and cytokines, C6-1 cells could have an effect on the stimulation of microglia/macrophage infiltration. The results of cell invasion assay showed that the invasion of microglia was enhanced by indirect co-culturing with C6-1 cells compared with C6-2 cells (Fig. 11A). It has recently been reported that the expression of CCL7, also known as monocyte chemotactic protein 3 (MCP-3), by tumor cells is correlated with the infiltration rate of microglia/macrophages.22 The results of cDNA microarray analysis showed that CCL7/MCP-3 was expressed at a higher level in C6-1 cells compared with C6-2 cells (Table 2). The upregulation of CCL7/MCP-3 mRNA expression in C6-1 cells was verified by Q-PCR (Fig. 11B). In contrast to the expression of other cytokines observed in C6-1 cells with IL33KD, we found that the inhibition of IL33 gene expression in C6-1 cells increased CCL7 mRNA expression (Fig. 11C). Interestingly, microglia invasion was increased when those cells were indirectly co-cultured with C6-1 cells with IL33KD (Fig. 11D). Furthermore, the addition of anti-CCL7 antibodies into microglia/C6-1 co-cultures effectively blocked microglia invasion (Fig. 11E). These results suggested that the high level of CCL7 mRNA expression in C6-1 cells contributes to C6-1 cell-induced increases in microglia cell invasion.
Fig. 11.
C6-derived CCL7 involvement in enhanced invasion of microglia. (A). Primary rat microglia were replated onto the upper side of the Transwell filter and then co-cultured with C6-1 or C6-2 cells. After 24 hours, the cells that migrated to the bottom side of the filter were stained (left-handed panel) and counted. C6-1 cells displayed a greater invasive ability than C6-2 cells. (B). Total RNA isolated from C6-1 cells or C6-2 cells was subjected to Q-PCR for the measurement of CCL7 mRNA expression. (C). Total RNA isolated from C6-mock and C6-IL33KD cells was subjected to Q-PCR for the measurement of CCL7 mRNA expression. (D). Primary rat microglia were seeded onto the upper side of the Transwell filter and then co-cultured with C6-mock or C6-IL33KD. The cells that migrated to the bottom side of the filter were stained (left-handed panel) and then counted. (E). Microglia were replated onto the upper side of the Transwell filter and then co-cultured with C6-mock or C6-IL33KD in the presence of isotype control or anti-CCL7/MCP3antibodies for an 8 hour incubation. Microglia that invaded to the bottom of the filter were counted.Scale bar in A and D, 100 μm. Data are means ± SEM of 3 independent experiments. *P < .05; **P < .01; ***P < .001 versus C6-2 (A and B) or C6-mock (C, D and E); ##P < .01 versus isotype control.
Discussion
The results show that C6 glioma cells associated with the upregulation of proliferation-associated genes have enhanced abilities with regard to cell growth and tumorigenicity. The findings of cDNA microarray analysis combined with Q-PCR show that the tumorigenic C6 cells act as a good source of cytokines and chemokines. Among the cytokine/chemokine gene cluster, IL-33 is profoundly induced and plays a regulatory role in the expression of cytokines and chemokines in tumorigenic C6 cells. We also provide evidence to show that increased expression of IL-33, CXCL12, and CCL7/MCP-3 contributes to enhanced cell growth of tumorigenic C6 cells and invasion of microglia.
It has been reported that elevated levels of COX-2 protein are present in high-grade glioma tissues when compared with that observed in low-grade glioma specimens.23 Through Kaplan–Meier analysis, Shono et al reported that high levels of COX-2 expression are correlated with poor survival for patients with brain tumors, especially for those with GBM. In other words, significant COX-2 expression is associated with clinically more aggressive gliomas and is a strong predictor of poor survival.24 COX-2 is also considered tp be a potent therapeutic target for various types of cancers including glioma.25–27 Based on the results from cDNA microarray analysis, tumorigenic C6 cells expressed a higher level of COX-2 mRNA (Table 1). Treatment of C6-1 cells with the COX-2 inhibitor Celecoxib effectively reduced both their cell viability and colony-formation ability (data not shown). The expression of CXCL12 and CXCR4 has been found to correlate directly with the degree of malignancy of human glioma cell lines and primary tumors.28,29 In addition to CXCR4, one recent study indicated that CXCL12 can bind to another receptor named CXCR7 (RDC-1), which is also highly expressed in tumor endothelial cells, microglia, and glioma cells.30 The same work reported that CXCL12 can exert its anti-apoptotic effects on human glioma through CXCR7 signaling.30 Our results showed that the CXCL12, CXCR4, and CXCR7 genes were highly expressed in C6-1 cells but not in C6-2 cells. Moreover, the application of AMD3100, a CXCR4/7 inhibitor that has been used in clinical trials for cancer treatment,31,32 effectively inhibited the growth of C6-1 cells but not C6-2 cells. The results further confirmed that enhanced cell proliferation of C6-1 cells is due in part to the action of the CXCL12, CXCR4, and CXCR7 genes.
Cytokines secreted by either cancer cells themselves or by the surrounding cells and infiltrating microglia/macrophages play a critical role in glioma malignancy.33–35 We have shown in this work that C6-1 cells expressed several cytokines and chemokines in abundance. In particular, enriched expression of IL-33, a novel member of the IL-1 superfamily,36 was detected in C6-1 cells and human U87 MG cells. Our findings have shown here that C6-1 cell proliferation was reduced after IL-33 and ST2 gene knockdown. Its action on the regulation of C6-1 cell growth is ST2 dependent. Moreover, IL-33 gene overexpression produced an increase in the cell proliferation and migration of C6-2 cells. The observations point to the possibility that upregulation of IL-33 expression could promote C6 tumorigenicity, which was verified by our in vivo experiments showing the reduction of the tumor volume by IL-33 gene knockdown. The function of IL-33 was also consistently detected in human glioma cell line, U87 MG. Moreover, the upregulation of IL-33 mRNA levels has been found to be clinically relevant to the low Kaplan–Meier survival probability of GBM patients.37 Thus, the present study indicated that high expression of IL-33 in glioma cells may contribute to glioma progression.
IL-33 functions through the IL-1 receptor-related protein ST2 and polarizes T cells to produce Th2-associated cytokines, stimulate mast cells and eosinophils, and activate microglia/macrophages.38 Since Th2 type cytokines can reduce tumor-specific immune responses by inhibiting tumor antigen presentation, IL-33 has recently been identified as a potent molecule involved in tumorigenesis and the development of vascular diseases.37 The results of the current work showed that IL-33 gene knockdown in C6-1 cells reduced the gene expression of CXCL-1, TGF-α, TGF-β2, COX-2, MMP-9, and IL-6. The comparative cDNA microarray analysis also showed that these genes were expressed at higher levels in C6-1 cells than in C6-2 cells (Table 1). CXCL-1, also known as growth related oncogene-α (GRO-α), acts as an oncogenic factor in glioma biology.39 TGF-α, a member of the EGF family, has been shown to work in combination with EGFR to promote human glioma cell growth.40 Moreover, TGF-α overexpression is associated with the initiation of glioma development.41 TGF-β2 has been reported to stimulate the cell proliferation of several glioma cell lines42 and is considered to be one of the key molecules for the progression of malignant gliomas.43 IL-6 is also known to promote glioma development in vivo44 and increases glioma stem cell survival and tumor growth.45 The results of the current work also showed that IL-33 gene knockdown led to reduced COX-2 mRNA expression in C6-1 cells, whereas the addition of COX-2 inhibitor had no effect on IL-33 gene expression (data not shown). This suggests that the upregulation of COX-2 mRNA expression in C6-1 cells could be controlled in part by the IL-33 dependent signaling pathway. Altogether, based on the previous findings regarding the effects of these genes on glioma cell proliferation, the downregulated levels of these genes due to IL-33 gene knockdown could lead to the lower growth rate of C6-1 cells.
The results of this work showed that, compared with C6-2, C6-1 cells not only have a greater proliferation rate but also exert a stimulatory effect on microglia invasion. IL-18 mRNA expression was downregulated in C6-1 cells with IL33KD when compared with the C6-mock cells. The chemokines participate in the migration and maturation of immune cell lineages.46,47 CXCL12 and its receptor CXCR4 can promote the migration of microglia under hypoxic conditions.48 Activation of CXCL12/CXCR4 in microglia triggers the PI3K/Akt dependent pathway and increases the release of cytokines.49,50 CXCL12/CXCR4 signaling may thus have important regulatory roles in the functioning of glioma-associated microglia/macrophages and further regulate glioma growth in vivo. However, the treatment with AMD3100 caused no change in microglia invasion in microglia co-cultured with C6-1-mock or C6-1 cells with IL33KD (data not shown), implying that CXCL12/SDF1 may mainly have mitogenic effects on C6-1 proliferation but not act as a chemotactic factor for microglia invasion. On the other hand, CCL7/MCP-3 was found to be not only highly expressed in C6-1 cells but also significantly upregulated in C6-1 cells with IL33KD. Moreover, the recent findings have demonstrated that glioma-derived CCL7/MCP-3 facilitates the infiltration of microglia/macrophages into tumors.22 In the present study, the addition of anti-CCL7 antibody can prevent the invasion of microglia in the co-culture with C6-1 cells. This indicated that CCL7/MCP-3 is involved in the promotion of microglia recruitment by C6-1 cells. Nevertheless, owing to the complicated biological functions of IL-33 as a traditional cytokine and a nuclear transcriptional factor,36,51 the exact mechanism underlying IL-33 regulation of C6-1 tumorigenicity remains to be further explored.
Based on our present findings, the abundant expression of proliferation-associated genes and cytokines/chemokines is a key characteristic of C6-1 cells, and these are involved in enhanced cell proliferation and tumorigenicity. Compared with the effect of IL-33 gene knockdown, the blockade of the action induced by CXCL12 and its receptors had greater effects with regard to suppression of C6-1 cell proliferation. However, given the findings that the inhibition of the IL-33 gene expression downregulates TGF-α/β2, COX-2, IL-6, IL-18, CXCL2, and MMP9 expression in C6-1 cells, IL-33 upregulation in glioma cells could play a critical role in creating a favorable microenvironment for glioma cell growth by regulating the production of the growth factors and cytokines/chemokines needed to modify the activity of glioma-infiltrating microglia/macrophages. Further revealing the roles of IL-33 on GBM progression can help in the development of more effective anti-glioma therapies that combine IL-33 targeting with the antagonists of cytokines or chemokines, such as CXCL12/SDF-1.
Supplementary Material
Funding
The work was supported by the National Science Council, Taiwan R.O.C. (NSC 99-2628-B-006-030-MY3 and 101-2811-B-006-029) and the Ministry of Education, Taiwan, R.O.C. under the NCKU Aim for the Top University Project Promoting Academic Excellence & Developing World Class Research Centers (D100-38B07).
Supplementary Material
Acknowledgments
The authors thank the technical staff at NHRI Microarray Core Facility, Mr. Chih-Hsien Wu for his assistance with tissue sectioning and staining, and Dr. Wen-Chi Chang for discussion on comparative gene expression profiling.
Conflict of interest statement: None declared.
References
- 1.Robins HI, Peterson CG, Mehta MP. Combined modality treatment for central nervous system malignancies. Semin Oncol. 2003;30(4 suppl 9):11–22. doi: 10.1016/s0093-7754(03)00271-9. [DOI] [PubMed] [Google Scholar]
- 2.Watters JJ, Schartner JM, Badie B. Microglia function in brain tumors. J Neurosci Res. 2005;81(3):447–455. doi: 10.1002/jnr.20485. [DOI] [PubMed] [Google Scholar]
- 3.Lam-Himlin D, Espey MG, Perry G, Smith MA, Castellani RJ. Malignant glioma progression and nitric oxide. Neurochem Int. 2006;49(8):764–768. doi: 10.1016/j.neuint.2006.07.001. [DOI] [PubMed] [Google Scholar]
- 4.Stiles CD, Rowitch DH. Glioma stem cells: a midterm exam. Neuron. 2008;58(6):832–846. doi: 10.1016/j.neuron.2008.05.031. [DOI] [PubMed] [Google Scholar]
- 5.Norden AD, Drappatz J, Wen PY. Novel anti-angiogenic therapies for malignant gliomas. Lancet Neurol. 2008;7(12):1152–1160. doi: 10.1016/S1474-4422(08)70260-6. [DOI] [PubMed] [Google Scholar]
- 6.Duda DG, Jain RK, Willett CG. Antiangiogenics: the potential role of integrating this novel treatment modality with chemoradiation for solid cancers. J Clin Oncol. 2007;25(26):4033–4042. doi: 10.1200/JCO.2007.11.3985. [DOI] [PMC free article] [PubMed] [Google Scholar]
- 7.Shai R, Shi T, Kremen TJ, et al. Gene expression profiling identifies molecular subtypes of gliomas. Oncogene. 2003;22(31):4918–4923. doi: 10.1038/sj.onc.1206753. [DOI] [PubMed] [Google Scholar]
- 8.Rickman DS, Bobek MP, Misek DE, et al. Distinctive molecular profiles of high-grade and low-grade gliomas based on oligonucleotide microarray analysis. Cancer Res. 2001;61(18):6885–6891. [PubMed] [Google Scholar]
- 9.Vitucci M, Hayes DN, Miller CR. Gene expression profiling of gliomas: merging genomic and histopathological classification for personalised therapy. Br J Cancer. 2011;104(4):545–553. doi: 10.1038/sj.bjc.6606031. [DOI] [PMC free article] [PubMed] [Google Scholar]
- 10.Nutt CL, Mani DR, Betensky RA, et al. Gene expression-based classification of malignant gliomas correlates better with survival than histological classification. Cancer Res. 2003;63(7):1602–1607. [PubMed] [Google Scholar]
- 11.Dieterich LC, Mellberg S, Langenkamp E, et al. Transcriptional profiling of human glioblastoma vessels indicates a key role of VEGF-A and TGFbeta2 in vascular abnormalization. J Pathol. 2012;228(3):378–390. doi: 10.1002/path.4072. [DOI] [PubMed] [Google Scholar]
- 12.Pen A, Moreno MJ, Martin J, Stanimirovic DB. Molecular markers of extracellular matrix remodeling in glioblastoma vessels: microarray study of laser-captured glioblastoma vessels. Glia. 2007;55(6):559–572. doi: 10.1002/glia.20481. [DOI] [PubMed] [Google Scholar]
- 13.Beaty RM, Edwards JB, Boon K, Siu IM, Conway JE, Riggins GJ. PLXDC1 (TEM7) is identified in a genome-wide expression screen of glioblastoma endothelium. J Neurooncol. 2007;81(3):241–248. doi: 10.1007/s11060-006-9227-9. [DOI] [PubMed] [Google Scholar]
- 14.Grobben B, De Deyn PP, Slegers H. Rat C6 glioma as experimental model system for the study of glioblastoma growth and invasion. Cell Tissue Res. 2002;310(3):257–270. doi: 10.1007/s00441-002-0651-7. [DOI] [PubMed] [Google Scholar]
- 15.Auer RN, Del Maestro RF, Anderson R. A simple and reproducible experimental in vivo glioma model. Can J Neurol Sci. 1981;8(4):325–331. doi: 10.1017/s0317167100043468. [DOI] [PubMed] [Google Scholar]
- 16.Tzeng SF, Lee JL, Kuo JS, et al. Effects of malonate C60 derivatives on activated microglia. Brain Res. 2002;940(1-2):61–68. doi: 10.1016/s0006-8993(02)02592-1. [DOI] [PubMed] [Google Scholar]
- 17.Fang KM, Wang YL, Huang MC, Sun SH, Cheng H, Tzeng SF. Expression of macrophage inflammatory protein-1alpha and monocyte chemoattractant protein-1 in glioma-infiltrating microglia: involvement of ATP and P2X(7) receptor. J Neurosci Res. 2011;89(2):199–211. doi: 10.1002/jnr.22538. [DOI] [PubMed] [Google Scholar]
- 18.Liu YP, Yang CS, Tzeng SF. Inhibitory regulation of glutamate aspartate transporter (GLAST) expression in astrocytes by cadmium-induced calcium influx. J Neurochem. 2008;105(1):137–150. doi: 10.1111/j.1471-4159.2007.05118.x. [DOI] [PubMed] [Google Scholar]
- 19.Lin YL, Tsai MJ, Lo MJ, et al. Evaluation of the antiangiogenic effect of Kringle 1–5 in a rat glioma model. Neurosurgery. 2012;70(2):479–489. doi: 10.1227/NEU.0b013e31822f3aea. discussion 489–490. [DOI] [PubMed] [Google Scholar]
- 20.Fu YS, Lin YY, Chou SC, et al. Tetramethylpyrazine inhibits activities of glioma cells and glutamate neuro-excitotoxicity: potential therapeutic application for treatment of gliomas. Neuro Oncol. 2008;10(2):139–152. doi: 10.1215/15228517-2007-051. [DOI] [PMC free article] [PubMed] [Google Scholar]
- 21.Yasuoka S, Kawanokuchi J, Parajuli B, et al. Production and functions of IL-33 in the central nervous system. Brain Res. 2011;1385:8–17. doi: 10.1016/j.brainres.2011.02.045. [DOI] [PubMed] [Google Scholar]
- 22.Okada M, Saio M, Kito Y, et al. Tumor-associated macrophage/microglia infiltration in human gliomas is correlated with MCP-3, but not MCP-1. Int J Oncol. 2009;34(6):1621–1627. doi: 10.3892/ijo_00000292. [DOI] [PubMed] [Google Scholar]
- 23.Joki T, Heese O, Nikas DC, et al. Expression of cyclooxygenase 2 (COX-2) in human glioma and in vitro inhibition by a specific COX-2 inhibitor, NS-398. Cancer Res. 2000;60(17):4926–4931. [PubMed] [Google Scholar]
- 24.Shono T, Tofilon PJ, Bruner JM, Owolabi O, Lang FF. Cyclooxygenase-2 expression in human gliomas: prognostic significance and molecular correlations. Cancer Res. 2001;61(11):4375–4381. [PubMed] [Google Scholar]
- 25.Turini ME, DuBois RN. Cyclooxygenase-2: a therapeutic target. Annu Rev Med. 2002;53:35–57. doi: 10.1146/annurev.med.53.082901.103952. [DOI] [PubMed] [Google Scholar]
- 26.Lin DT, Subbaramaiah K, Shah JP, Dannenberg AJ, Boyle JO. Cyclooxygenase-2: a novel molecular target for the prevention and treatment of head and neck cancer. Head Neck. 2002;24(8):792–799. doi: 10.1002/hed.10108. [DOI] [PubMed] [Google Scholar]
- 27.Thun MJ, Henley SJ, Patrono C. Nonsteroidal anti-inflammatory drugs as anticancer agents: mechanistic, pharmacologic, and clinical issues. J Natl Cancer Inst. 2002;94(4):252–266. doi: 10.1093/jnci/94.4.252. [DOI] [PubMed] [Google Scholar]
- 28.Ping YF, Yao XH, Jiang JY, et al. The chemokine CXCL12 and its receptor CXCR4 promote glioma stem cell-mediated VEGF production and tumour angiogenesis via PI3K/AKT signalling. J Pathol. 2011;224(3):344–354. doi: 10.1002/path.2908. [DOI] [PubMed] [Google Scholar]
- 29.Bian XW, Yang SX, Chen JH, et al. Preferential expression of chemokine receptor CXCR4 by highly malignant human gliomas and its association with poor patient survival. Neurosurgery. 2007;61(3):570–578. doi: 10.1227/01.NEU.0000290905.53685.A2. discussion 578–579. [DOI] [PubMed] [Google Scholar]
- 30.Hattermann K, Held-Feindt J, Lucius R, et al. The chemokine receptor CXCR7 is highly expressed in human glioma cells and mediates antiapoptotic effects. Cancer Res. 2010;70(8):3299–3308. doi: 10.1158/0008-5472.CAN-09-3642. [DOI] [PubMed] [Google Scholar]
- 31.Kalatskaya I, Berchiche YA, Gravel S, Limberg BJ, Rosenbaum JS, Heveker N. AMD3100 is a CXCR7 ligand with allosteric agonist properties. Mol Pharmacol. 2009;75(5):1240–1247. doi: 10.1124/mol.108.053389. [DOI] [PubMed] [Google Scholar]
- 32.Peled A, Wald O, Burger J. Development of novel CXCR4-based therapeutics. Expert Opin Investig Drugs. 2012;21(3):341–353. doi: 10.1517/13543784.2012.656197. [DOI] [PubMed] [Google Scholar]
- 33.Iwami K, Natsume A, Wakabayashi T. Cytokine networks in glioma. Neurosurg Rev. 2011;34(3):253–263. doi: 10.1007/s10143-011-0320-y. discussion 263–254. [DOI] [PubMed] [Google Scholar]
- 34.Streit WJ, Conde JR, Fendrick SE, Flanary BE, Mariani CL. Role of microglia in the central nervous system’s immune response. Neurol Res. 2005;27(7):685–691. doi: 10.1179/016164105X49463a. [DOI] [PubMed] [Google Scholar]
- 35.Zhu VF, Yang J, Lebrun DG, Li M. Understanding the role of cytokines in Glioblastoma Multiforme pathogenesis. Cancer Lett. 2012;316(2):139–150. doi: 10.1016/j.canlet.2011.11.001. [DOI] [PubMed] [Google Scholar]
- 36.Haraldsen G, Balogh J, Pollheimer J, Sponheim J, Kuchler AM. Interleukin-33 - cytokine of dual function or novel alarmin? Trends Immunol. 2009;30(5):227–233. doi: 10.1016/j.it.2009.03.003. [DOI] [PubMed] [Google Scholar]
- 37.REMBRANDT. REpository for Molecular BRAin Neoplasia Data. National Cancer Institute. 2005 http://rembrandt.nci.nih.gov. (accessed Septermber 28, 2013) [Google Scholar]
- 38.Liew FY, Pitman NI, McInnes IB. Disease-associated functions of IL-33: the new kid in the IL-1 family. Nat Rev. 2010;10(2):103–110. doi: 10.1038/nri2692. [DOI] [PubMed] [Google Scholar]
- 39.Zhou Y, Zhang J, Liu Q, et al. The chemokine GRO-alpha (CXCL1) confers increased tumorigenicity to glioma cells. Carcinogenesis. 2005;26(12):2058–2068. doi: 10.1093/carcin/bgi182. [DOI] [PubMed] [Google Scholar]
- 40.Tang P, Steck PA, Yung WK. The autocrine loop of TGF-alpha/EGFR and brain tumors. J Neurooncol. 1997;35(3):303–314. doi: 10.1023/a:1005824802617. [DOI] [PubMed] [Google Scholar]
- 41.Junier MP. What role(s) for TGFalpha in the central nervous system? Prog Neurobiol. 2000;62(5):443–473. doi: 10.1016/s0301-0082(00)00017-4. [DOI] [PubMed] [Google Scholar]
- 42.Barcellos-Hoff MH, Newcomb EW, Zagzag D, Narayana A. Therapeutic targets in malignant glioblastoma microenvironment. Semin Radiat Oncol. 2009;19(3):163–170. doi: 10.1016/j.semradonc.2009.02.004. [DOI] [PMC free article] [PubMed] [Google Scholar]
- 43.Hau P, Jachimczak P, Schlaier J, Bogdahn U. TGF-beta2 signaling in high-grade gliomas. Curr Pharm Biotechnol. 2011;12(12):2150–2157. doi: 10.2174/138920111798808347. [DOI] [PubMed] [Google Scholar]
- 44.Weissenberger J, Loeffler S, Kappeler A, et al. IL-6 is required for glioma development in a mouse model. Oncogene. 2004;23(19):3308–3316. doi: 10.1038/sj.onc.1207455. [DOI] [PubMed] [Google Scholar]
- 45.Wang CC, Fang KM, Yang CS, Tzeng SF. Reactive oxygen species-induced cell death of rat primary astrocytes through mitochondria-mediated mechanism. J Cell Biochem. 2009;107(5):933–943. doi: 10.1002/jcb.22196. [DOI] [PubMed] [Google Scholar]
- 46.Kabashima K, Sugita K, Shiraishi N, Tamamura H, Fujii N, Tokura Y. CXCR4 engagement promotes dendritic cell survival and maturation. Biochem Biophys Res Commun. 2007;361(4):1012–1016. doi: 10.1016/j.bbrc.2007.07.128. [DOI] [PubMed] [Google Scholar]
- 47.Honczarenko M, Le Y, Glodek AM, et al. CCR5-binding chemokines modulate CXCL12 (SDF-1)-induced responses of progenitor B cells in human bone marrow through heterologous desensitization of the CXCR4 chemokine receptor. Blood. 2002;100(7):2321–2329. doi: 10.1182/blood-2002-01-0248. [DOI] [PubMed] [Google Scholar]
- 48.Wang X, Li C, Chen Y, et al. Hypoxia enhances CXCR4 expression favoring microglia migration via HIF-1alpha activation. Biochem Biophys Res Commun. 2008;371(2):283–288. doi: 10.1016/j.bbrc.2008.04.055. [DOI] [PubMed] [Google Scholar]
- 49.Lu DY, Tang CH, Yeh WL, et al. SDF-1alpha up-regulates interleukin-6 through CXCR4, PI3K/Akt, ERK, and NF-kappaB-dependent pathway in microglia. Eur J Pharmacol. 2009;613(1-3):146–154. doi: 10.1016/j.ejphar.2009.03.001. [DOI] [PubMed] [Google Scholar]
- 50.Bezzi P, Domercq M, Brambilla L, et al. CXCR4-activated astrocyte glutamate release via TNFalpha: amplification by microglia triggers neurotoxicity. Nat Neurosci. 2001;4(7):702–710. doi: 10.1038/89490. [DOI] [PubMed] [Google Scholar]
- 51.Miller AM. Role of IL-33 in inflammation and disease. J Inflamm (Lond) 2011;8(1):22. doi: 10.1186/1476-9255-8-22. [DOI] [PMC free article] [PubMed] [Google Scholar]
Associated Data
This section collects any data citations, data availability statements, or supplementary materials included in this article.


