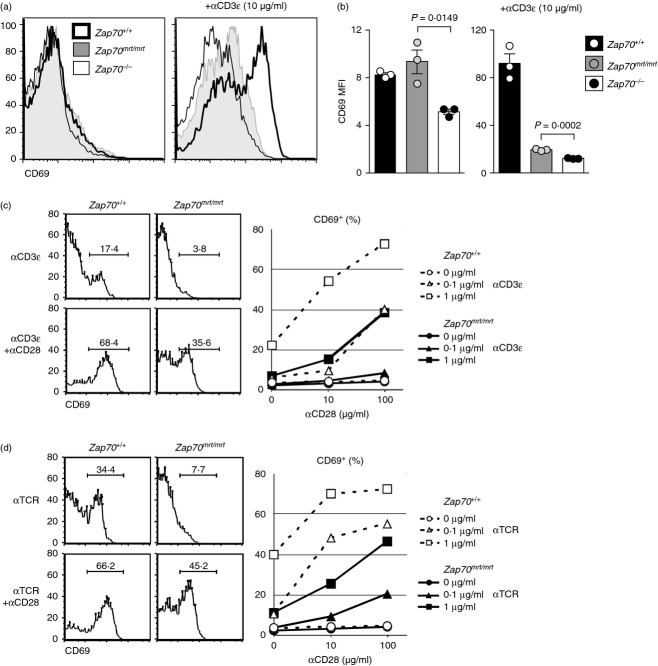
Figure 3.
Shifted dose–response kinetics following T-cell receptor (TCR) stimulation in vitro. Thymocytes were stimulated for 20 hr in culture wells coated with anti-CD3 (a–c) or anti-TCR (d) in the presence or absence of anti-CD28, and the CD4+ CD8+ thymocyte response was examined by median CD69 expression (a) or by the percentage of cells that were CD69 positive (c,d). (a) Representative histogram of CD69 expression on Zap70+/+ (filled), Zap70mrt/mrt (open, solid line) and Zap70−/− (open, broken line) after stimulation with 1 μg/ml anti-CD3 + 1 μg/ml anti-CD28. Bars in (b) represent standard error of the mean, and P-values were calculated by two-tailed Student's t-test. Data are representative of one (a, b) or two (c) independent experiments.

