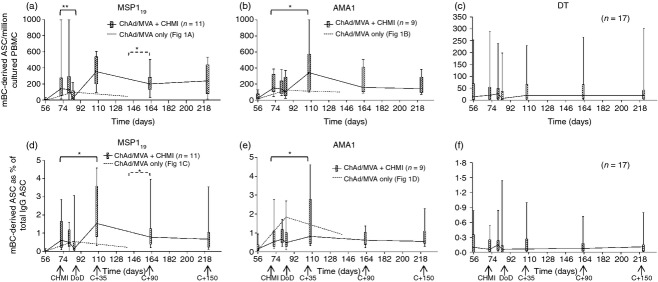
Figure 3.

Memory B-cell (mBC) responses in vaccinated volunteers receiving controlled human malaria infection (CHMI). Box and whisker plots show the median, range and interquartile range of antigen-specific mBC-derived antigen-secreting cell (ASC) responses measured over time using the mBC ELISPOT assay. Responses are defined as mBC derived ASC per million cultured peripheral blood mononuclear cells (PBMC) specific for (a) 19 kDa C-terminus of merozoite surface protein 1 (MSP119), (b) apical membrane antigen 1 (AMA1) and (c) diphtheria toxid (DT); or as mBC-derived ASC as a % of total IgG+ ASC for the same antigens (d–f). Assays were performed at the indicated time-points from frozen PBMC; MSP1 vaccinees (n = 11) and AMA1 vaccinees (n = 9) are shown by solid lines; DT responses are shown from vaccinated volunteers in both the MSP1 and AMA1 groups (n = 17). Day of diagnosis (DoD) is plotted at d84 as the average diagnosis time-point. Responses from vaccinated volunteers who did not receive CHMI are shown in (a, b, d, e) from the previous Phase Ia trials (median response from Fig. 1a, b, d, e dashed line). Differences between time-points in the Phase IIa trial were analysed by Wilcoxon matched-pairs signed rank test (solid lines). Differences between resting levels in the Phase IIa and Phase Ia trials were analysed by Mann–Whitney U-test (dashed lines), *P < 0·05 and **P < 0·01. Differences between all time-points for DT performed using Friedman test with Dunn's post-test.
