

Abstract
Skin cancer studies depend on questionnaires to estimate exposure to ultraviolet light and subsequent risk but are limited by recall bias. We investigate the feasibility of developing a short checklist of categories comprising outdoor activities that can improve sun exposure questionnaires for use in epidemiologic studies. We recruited 124 working and retired U.S. radiologic technologists (52% women). Each subject was instructed to complete a daily activity diary, listing main indoor and outdoor activities between 9:00 A.M. and 5:00 P.M. during a 7 day period. A total of 4697 entries were associated with 1408 h (21.1%) of the total 6944 h spent outdoors. We were able to classify the activities into seven main activity categories: driving, yard work, home-maintenance, walking or performing errands, water activities, other recreational or sports activities and leisure activities or relaxing outside. These activities accounted for more than 94% of time spent outdoors both for working and retired men and women. Our data document the feasibility and guidance for developing a short checklist of outdoor activities for use in epidemiologic questionnaires for estimating sunlight exposures of working and retired indoor workers.
INTRODUCTION
Epidemiologic studies have linked ultraviolet radiation (UVR) present in sunlight with increased risks of skin cancers and perhaps decreased risks of other malignancies (1-7). The primary strategy for reconstructing lifetime UVR exposure in epidemiologic studies is from questionnaires which employ proxy or indirect measures. However, the epidemiologic studies that have relied on questionnaires to assess past UVR exposures are prone to error and mis-specification of time spent outdoors (8,9). Traditionally, these questionnaires are based on the recall of study participants on the amount of time they have spent outdoors during different periods of their lives (10,11).
Few studies utilizing questionnaires have evaluated whether assessment of specific outdoor activities might be more reproducible or accurate than the number of hours spent outdoors (12,13). The ultimate goal of our multi-phase program of research was to improve the accuracy of lifetime cumulative UVR exposure assessment. The initial phase involves assessment of current time activity patterns of our study population. We assess the feasibility of identifying a short list of relatively homogeneous groups of outdoor activities to be incorporated in an activity-based questionnaire for estimating lifetime cumulative UVR exposure in epidemiologic studies. It is crucial that the list of activities be limited in number to enable respondents to provide information about the time spent engaged in each of these activities in each decade of life within a questionnaire of reasonable length.
This paper describes the first step in the process, e.g. consolidation of thousands of current activities from daily diary entries. Having a better grasp of the feasibility of this process will enable researchers to design better questionnaires which form the backbone of research on UV exposure and cancer risks. A special feature of our research is the focus on female workers who have been little studied (14,15).
METHODS
Study subjects
Study participants were volunteers within the nationwide U.S. Radiologic Technologists (USRT) cohort study (16,17). Initially, we mailed a survey questionnaire in the summer of 2004 on lifetime sun exposure to 1800 USRT cohort members residing in the greater Minneapolis metropolitan area or surrounding areas of Wisconsin (northern latitudes) or in North Carolina or Atlanta, Georgia (southern latitudes). Among the 600 cohort members who returned a questionnaire within 4 weeks, a stratified sample of 300 subjects was randomly selected for recruitment for this pilot study. The sample included 150 persons residing in each of the two geographic regions. Within each of the geographic regions, the sample was stratified into equal proportions by age (e.g. 40–59 years and 60 years or older) and gender. Individuals mailing in the questionnaire received a follow-up recruitment phone call to explain the purpose of the study and to obtain informed consent. Of the 300 randomly selected individuals, we enrolled 127 persons (42% recruitment rate), and obtained complete UVR measurement and subsequent questionnaire data from 124 subjects (98% participation rate). This study was approved by the Institutional Review Boards of RTI International and the National Cancer Institute (NCI) and the Scientific Advisory Board of the NCI.
UVR exposure assessment
The goal of the data collection was to assess UVR exposures from sunlight during a typical nonvacation week in late summer. For each of the subjects, data were collected over seven consecutive days. All data collection occurred between 1 September and 5 October 2004. Study participants were asked to record all activities, including those conducted indoors as well as outdoors, which were carried out between 9 A.M. and 5 P.M. Subjects were instructed to briefly describe the major outdoor or indoor activity carried out during each 30 min interval, the type of activity, whether it was indoor or outdoors, whether the activity was carried out in full sun or shade and whether specified sun protection measures were used (e.g. characteristics of clothing, use of hats, application of sunscreen together with the associated sun protection factor number). If multiple activities occurred during the 30 min time block, then the participants were instructed to record the discrete amount of time he or she engaged in each activity in increments from 1 to 30 min. If the length of time was not specified, we assumed that each activity took an equal amount of time during the 30 min period. If an activity lasted longer than 30 min, it was to be reported within each of the relevant number of 30 min intervals.
Activity grouping and statistical analysis
As a first step towards improving the accuracy of lifetime UVR assessment, we focused on the current activities of our study population. We sought to develop a short list of categories of similar types of activities so as to assess the feasibility of this approach for developing an activity-based questionnaire for estimating lifetime cumulative UV exposures. All self-reported activities were entered verbatim as free text fields (n = 13 953) and grouped into various outdoor activities performed (Fig. 1). For the 4697 types of outdoor activities, patterns of key words and phrases associated with time spent outdoors were identified using factor analysis (18,19) and grouped into 37 categories developed using the American Time Use Survey (ATUS) and the National Human Activity Pattern Survey (NHAPS) as guides (20,21).
Figure 1.
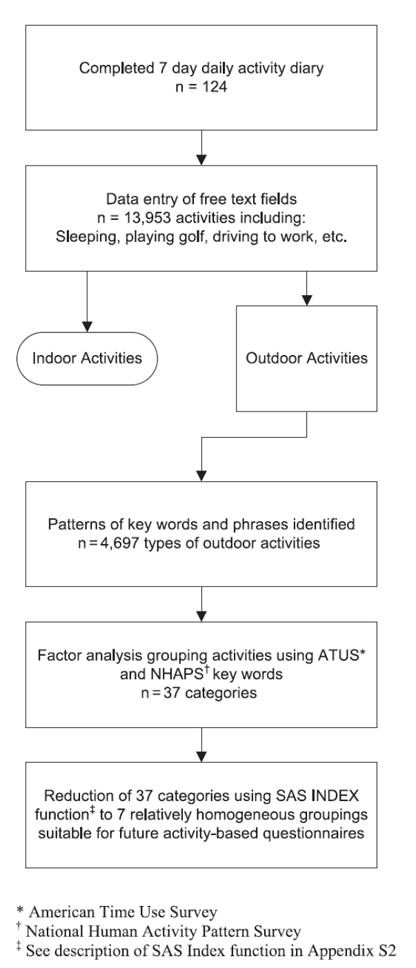
Flow chart of data collection preparation and reduction into major activity categories.
The purpose of this initial grouping was to reduce the large number of outdoor activities into a more manageable set. In the development of the initial categories, we used the principles described in detail by Shelley in creating the ATUS coding lexicon to group similar diary entries (such as “biked,”“biking” and “rode my bike”) into a uniform classification (e.g. “biking”) of 37 secondary categories based on the categories described by ATUS and NHAPS (see Supplemental Materials—Appendix S1) (21). We decreased further the overall number of categories by grouping the initial 37 secondary categories into seven primary categories using the SAS Index Function (see Supplemental Materials—Appendix S2). These primary categories were derived from the activities of our study population using the primary categories described in the ATUS and NHAPS as guides (20,21).
To illustrate, recreational activities such as “biking,” “running,” or “playing golf” were all grouped under the same category (RECREATION). Activities that appeared to overlap between two or more categories were separately indexed in each group, and then adjudicated by a study investigator so as to be classified under a single category. For example, a diary entry of “watched golf on TV while eating barbeque on my newly repaired deck” would be classified as leisure (“eating,” “barbeque”), home (“repaired deck”) and recreation (“golf”) through the factor analysis, then adjudicated by a study investigator so as to be classified in the more appropriate of the categories, namely leisure (“watching TV”) rather than home (“repaired deck”) or recreation (“golf”).
To assess how well this classification scheme cataloged the outdoor activities of our study population, we calculated the overall proportion of time spent outdoors by weekday and weekend day by gender. Descriptive statistics were calculated for the percent of total outdoor time for weekdays and weekend days. The strength of association between subgroups of activities and percent time spent outdoors was determined using analysis of variance (ANOVA) techniques. A major emphasis of the analysis was whether estimates by gender (as well as by age, geographic region and day of the week) differed significantly, and report differences using two-sided P-values. For purposes of the analysis, the U.S. national holiday designated “Labor Day,” although occurring on a Monday, was considered a weekend day.
RESULTS
Using the methods described and shown in Fig. 1, we consolidated the 37 activity categories (examples listed below) into seven primary groups (shown in capital letters in parentheses).
1 Driving such as driving to errands, shopping, commuting to work (DRIVING).
2 Yard work, outdoor gardening, caring for farm animals (not cats or dogs) (GARDENING).
3 Outside home maintenance such as remodeling, painting or car maintenance (HOME).
4 Walking outside such as walking pets, light exercise, visiting neighbors or doing errands with their pet (WALKING/LIGHT EXERCISE).
5 Outdoor recreation such as playing golf, soccer, biking, hiking, running, jogging, or moderate to heavy exercise (RECREATION).
6 Outdoor water activities such as fishing, swimming, sailing, boating, or canoeing (WATER).
7 Outdoor leisure activities such as sitting or relaxing outside, eating or cooking outside, smoking, supervising children or watching sports games (LEISURE).
Examples of the SAS code and keywords used to create these primary categories are provided in Appendices 1 and 2. Overall, the primary purpose was to reduce the various daily activities of our study population into a smaller, more manageable number, while maintaining the integrity of the data.
To test the applicability of our approach for use in epidemiologic studies, we evaluated the amount of time spent outdoors by region, employment status, gender or age to determine whether there were differences by subgroup. Overall, approximately 21% of the total time recorded (6944 h) was spent outdoors (Table 1), although men spent significantly (P < 0.001) more time outdoors (26.4%) than women (16.0%).
Table 1.
Percent of time between 9:00 A.M. and 5:00 P.M. spent outdoors by region of residence, employment status and gender by age.
| Female
|
Male
|
Differences (female–male)
|
|||||||||||||
|---|---|---|---|---|---|---|---|---|---|---|---|---|---|---|---|
| <60 n = 30 |
≥60 n = 34 |
Total n = 64 |
<60 n = 30 |
≥60 n = 30 |
Total n = 60 |
< 60 | ≥60 | Total | |||||||
|
| |||||||||||||||
| Mean | SE | Mean | SE | Mean | SE | Mean | SE | Mean | SE | Mean | SE | Diff | Diff | Diff | |
| Total | |||||||||||||||
| Overall | 15.6 | 1.6 | 16.3 | 1.9 | 16.0 | 1.3 | 23.0 | 2.8 | 29.8 | 2.9 | 26.4 | 2.1 | −7.4* | −13.5** | −10.4** |
| Weekday | 12.1 | 1.5 | 14.8 | 2.0 | 13.5 | 1.3 | 17.2 | 3.4 | 27.8 | 3.4 | 22.5 | 2.5 | −5.1 | −13.0* | −9.0* |
| Weekend | 24.3 | 4.1 | 19.6 | 2.6 | 21.8 | 2.4 | 37.4 | 3.8 | 34.3 | 3.8 | 35.9 | 2.7 | −13.2* | −14.7* | −14.1** |
| Region | |||||||||||||||
| North | n = 15 | n = 18 | n = 33 | n = 15 | n = 15 | n = 30 | |||||||||
| Overall | 14.3 | 2.4 | 14.3 | 2.1 | 14.3 | 1.6 | 24.3 | 4.9 | 28.2 | 4.7 | 26.2 | 3.4 | −10.0 | −13.9* | −11.9* |
| Weekday | 11.6 | 1.9 | 12.1 | 2.1 | 11.9 | 1.4 | 16.5 | 6.0 | 24.3 | 5.1 | 20.4 | 4.0 | −4.9 | −12.1* | −8.5 |
| Weekend | 19.8 | 5.3 | 18.9 | 3.3 | 19.3 | 3.0 | 43.4 | 5.6 | 37.7 | 6.3 | 40.5 | 4.2 | −23.6* | −18.8* | −21.3** |
| South | n = 15 | n = 16 | n = 31 | n = 15 | n = 15 | n = 30 | |||||||||
| Overall | 16.9 | 2.2 | 18.5 | 3.2 | 17.8 | 2.0 | 21.7 | 2.8 | 31.4 | 3.5 | 26.6 | 2.4 | −4.8 | −12.8* | −8.8* |
| Weekday | 12.6 | 2.2 | 17.8 | 3.4 | 15.3 | 2.1 | 17.8 | 3.3 | 31.4 | 4.3 | 24.6 | 3.0 | −5.2 | −13.6* | −9.3* |
| Weekend | 28.7 | 6.0 | 20.5 | 4.1 | 24.5 | 3.7 | 31.5 | 4.6 | 30.8 | 4.1 | 31.2 | 3.1 | −2.7 | −10.4 | −6.7 |
| Current employment status | |||||||||||||||
| Currently working | n = 25 | n = 10 | n = 35 | n = 28 | n = 10 | n = 38 | |||||||||
| Overall | 13.9 | 1.4 | 14.4 | 2.2 | 14.0 | 1.2 | 22.7 | 2.9 | 20.1 | 3.1 | 22.0 | 2.3 | −8.8* | −5.7 | −8.0* |
| Weekday | 10.1 | 1.3 | 13.0 | 3.3 | 10.9 | 1.3 | 16.6 | 3.5 | 13.6 | 3.6 | 15.8 | 2.8 | −6.4 | −0.6 | −4.9 |
| Weekend | 23.3 | 4.4 | 17.4 | 3.3 | 21.6 | 3.3 | 37.8 | 3.9 | 36.3 | 6.3 | 37.4 | 3.3 | −14.5* | −18.9* | −15.8* |
| Not currently working/retired | n = 5 | n = 24 | n = 29 | n = 2 | n = 20 | n = 22 | |||||||||
| Overall | 24.4 | 5.2 | 17.3 | 2.6 | 18.6 | 2.4 | 27.6 | 12.5 | 34.7 | 3.7 | 34.0 | 3.5 | −3.1 | −17.4** | −15.5* |
| Weekday | 22.1 | 3.4 | 15.6 | 2.5 | 16.8 | 2.2 | 25.5 | 12.1 | 35.0 | 3.9 | 34.1 | 3.7 | −3.4 | −19.4** | −17.3** |
| Weekend | 29.2 | 11.1 | 21.0 | 3.6 | 22.5 | 3.6 | 32.8 | 13.5 | 33.2 | 4.8 | 33.2 | 4.5 | −3.6 | −12.2 | −10.7 |
P < 0.05;
P < 0.001.
We found that a larger proportion of time was spent outdoors during weekends compared to weekdays and there were gender differences (Fig. 2). The seven major activity categories accounted for more than 94% of all outdoor activities in all age and gender groups.
Figure 2.
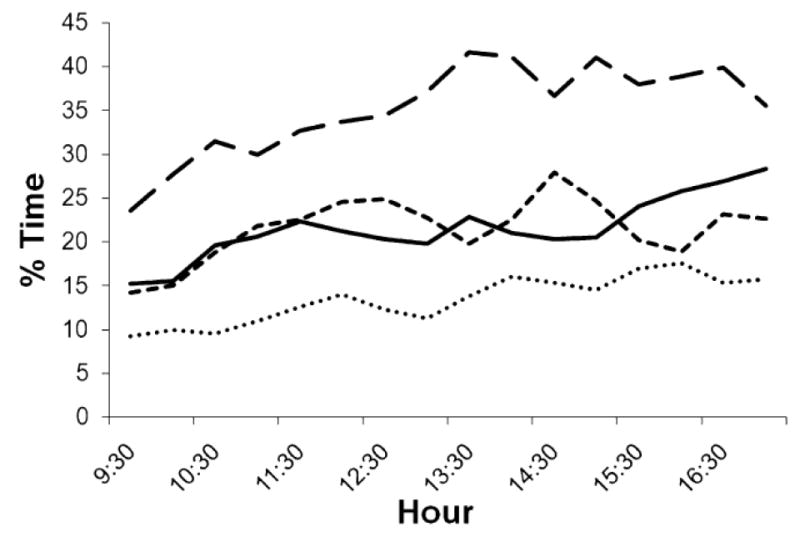
Gender differences in the proportion of time spent outdoors according to the daily diaries, by time of day for weekdays and weekends; male weekdays (solid black); male weekends (long dash); female weekdays (dotted) and female weekends (short dash).
Driving, which constituted the largest percentage of total time spent outdoors (39% of the overall total), differed by gender (e.g. women spent 45% of their time engaged in this activity compared with 33% for men). Leisure time activities (21%vs 20%, female vs male respectively) and gardening/landscaping (13%vs 20%, female vs male respectively) represented the second and third largest percentage of time outdoors, with statistically nonsignificant differences in the distribution by gender.
The gender difference was observed consistently on both weekends (P < 0.001) and weekdays (P < 0.05). There was a statistically significant difference in the percentage of time spent outdoors by age between those aged 60 or older and those aged 40–59 during the weekday (20.9 ± 16.7 vs 14.6 ± 14.6, respectively, P < 0.05), but not during the weekend (26.5 ± 19.6 vs 30.8 ± 22.7, respectively, P = 0.25). There were no differences in time spent outdoors according to geographic region of residence (P = 0.42). Those who were not employed at the time of the data collection spent a larger percentage of their time outdoors than those who were currently employed (25.4%vs 18.2%, respectively, P < 0.01). Among those who were not employed, there was a difference in the percentage of time spent outdoors between the females and males (18.6%vs 34.0%, respectively, P < 0.05). During weekdays, subjects who were not employed spent significantly more time outdoors than employed individuals (P < 0.01). This difference was not apparent during weekend days (P = 0.50).
For generalizability, we targeted our recruitment efforts to maintain equal numbers of study subjects by gender, age and geographic location. The number of persons completing the activity diaries were similar in each strata by gender (males, n = 60; females, n = 64), age (40–59 years, n = 60; age 60 years or older, n = 64) and geographic location (northern latitudes, Minnesota and Wisconsin, n = 63; southern latitudes, North Carolina and Georgia, n = 61).
DISCUSSION
Epidemiologic studies assessing the role of UV exposure in cancer risk must ascertain lifetime UV exposure. Generally, the questionnaires attempt to summarize the average amount of time spent outdoors for each decade. To address the overall goal of our multi-phase research program, we will determine whether questionnaires based on activities of individuals can provide better estimates of lifetime UV exposure than those based on hours spent outdoors. However, feasibility requirements necessitate identification of a reasonably small set of activities to be included in the questionnaires. Lengthy questionnaires would place an undue burden on the participant and the study staff. As a first step, we identified seven primary activity categories for our study population, and determined how well these primary categories summarized their outdoor activities. Using categories from large U.S. surveys as guides, we reduced 4000+ activities into seven primary categories of similar types comprising approximately 94% of outdoor time.
It is important to note that one or more of the seven categories may not be homogeneous with respect to UVR exposure due to the lack of activity-specific UVR measurements in this study population. The UVR measurements that were collected were from the polysulphone badges that each participant wore. These badges integrated UVR exposure over an 8 h period. Thus, even if studies in other populations permit relatively large numbers of activities to be grouped in fewer than 10 categories, it is possible that each category may be characterized by a range of levels for UVR exposure associated with the seemingly related activities. Detailed measurements of UVR exposures among persons involved in different activities within each of the seven categories would be important to evaluate the homogeneity of the groupings. Measurement data are also needed to estimate cumulative UVR levels from the intermittent UVR exposures associated with driving motor vehicles to determine whether or not driving is a significant UV exposure source. Although driving comprised the largest percent of time spent outdoors, particularly among women, the cumulative exposures may be significant, but the relative distribution of UVA vs UVB exposures may differ from that of most other activities involving UVR exposures (22,23). In addition, intermittent UV exposure from entering and leaving the vehicle could add up to substantial UV exposures (23,24).
We conducted this UVR exposure assessment methods investigation among a group of female and male volunteer radiologic technologists as one component of developing improved questionnaires for assessing UVR exposures in a planned future study of cancer risks within the source population. In one of the first studies examining outdoor activities of female and male indoor workers, gender differences were notable in the total percent time spent outdoors during weekdays, and for specific activities (e.g. particularly the amount of time spent driving). This difference was consistent across age, region and employment status groups. We were reassured to find that the U.S. radiologic technologists reported spending a comparable proportion of time outdoors (for females, 16% of the time between 9:00 A.M. and 5:00 P.M.; 26.4% for males) as a national probability sample of U.S. subjects evaluated in the NHAPS 2 year survey of 24 h diaries in adults and children (20).
It must be recognized that our data were collected over a single week during 1 year, and thus may not represent usual behavior patterns throughout the year, across different years, or over longer-term periods. Prior studies have demonstrated a three-fold seasonal difference in time spent outdoors between summer and winter (25). Our data were collected at the end of the summer season, when outdoor time is likely to be significant and UV exposure is still notable, but most study subjects would be working their regular work schedule. One should be cautious about generalizing the results from our study of radiologic technologists to other working populations or to nonworking individuals. Subjects were volunteers, whose outdoor activities and sun-protective behaviors may differ from nonparticipating radiologic technologists. Furthermore, a large number of our study subjects were retirees (e.g. 40% were not currently employed). This may be more indicative of the age of the study population rather than a more general, working population.
Our study demonstrates the feasibility of developing an activity-based questionnaire with a manageable number of categories for classifying UVR exposure for middle-aged and older female and male indoor workers. In an ongoing effort, we are examining whether activity-based questionnaires provide more accurate measures compared with standard hour-based questionnaires, by comparing questionnaire data for each UVR exposure assessment approach with data recorded in activity diaries (13). It will also be important to examine our methodology in different populations and settings (26-29). Ultimately, an outdoor activity-based questionnaire would be used in epidemiologic studies of skin cancer risk to retrospectively assess lifetime participant UVR exposure. Using a questionnaire with a small number of activity categories for classifying UVR exposure may provide more valid results than a questionnaire based solely on self-reported time spent outdoors.
Supplementary Material
Acknowledgments
The authors gratefully acknowledge the participation of the USRT cohort members. Thanks to Michael Phillips, Emily McFarlane, Colleen Waters (RTI) and Diane Kampa (U Minnesota) for their assistance. This work was supported by Contract N02-CP-31013 with the National Cancer Institute. This study has been conducted in accord with accepted ethical and humane practices, and has been approved by the pertinent institutional and/or governmental oversight group(s).
Footnotes
There are no other competing financial interests.
References
- 1.Armstrong BK, Kricker A. The epidemiology of UV induced skin cancer. J Photochem Photobiol B. 2001;63:8–18. doi: 10.1016/s1011-1344(01)00198-1. [DOI] [PubMed] [Google Scholar]
- 2.Cleaver JE, Crowley E. UV damage, DNA repair and skin carcinogenesis. Front Biosci. 2002;7:d1024–d1043. doi: 10.2741/A829. [DOI] [PubMed] [Google Scholar]
- 3.Hartge P, Lim U, Freedman DM, Colt JS, Cerhan JR, Cozen W, Severson RK, Davis S. Ultraviolet radiation, dietary vitamin D, and risk of non-Hodgkin lymphoma (United States) Cancer Causes Control. 2006;17:1045–1052. doi: 10.1007/s10552-006-0040-8. [DOI] [PubMed] [Google Scholar]
- 4.Matsumura Y, Ananthaswamy HN. Toxic effects of ultraviolet radiation on the skin. Toxicol Appl Pharmacol. 2004;195:298–308. doi: 10.1016/j.taap.2003.08.019. [DOI] [PubMed] [Google Scholar]
- 5.Reichrath J. The challenge resulting from positive and negative effects of sunlight: How much solar UV exposure is appropriate to balance between risks of vitamin D deficiency and skin cancer? Prog Biophys Mol Biol. 2006;92:9–16. doi: 10.1016/j.pbiomolbio.2006.02.010. [DOI] [PubMed] [Google Scholar]
- 6.Saladi RN, Persaud AN. The causes of skin cancer: A comprehensive review. Drugs Today (Barc) 2005;41:37–53. doi: 10.1358/dot.2005.41.1.875777. [DOI] [PubMed] [Google Scholar]
- 7.Tornaletti S, Pfeifer GP. UV damage and repair mechanisms in mammalian cells. Bioessays. 1996;18:221–228. doi: 10.1002/bies.950180309. [DOI] [PubMed] [Google Scholar]
- 8.Adami J, Gridley G, Nyren O, Dosemeci M, Linet M, Glimelius B, Ekbom A, Zahm SH. Sunlight and non-Hodgkin’s lymphoma: A population-based cohort study in Sweden. Int J Cancer. 1999;80:641–645. doi: 10.1002/(sici)1097-0215(19990301)80:5<641::aid-ijc1>3.0.co;2-z. [DOI] [PubMed] [Google Scholar]
- 9.Hu S, Ma F, Collado-Mesa F, Kirsner RS. UV radiation, latitude, and melanoma in US Hispanics and blacks. Arch Dermatol. 2004;140:819–824. doi: 10.1001/archderm.140.7.819. [DOI] [PubMed] [Google Scholar]
- 10.Bodiwala D, Luscombe CJ, Liu S, Saxby M, French M, Jones PW, Fryer AA, Strange RC. Prostate cancer risk and exposure to ultraviolet radiation: Further support for the protective effect of sunlight. Cancer Lett. 2003;192:145–149. doi: 10.1016/s0304-3835(02)00710-3. [DOI] [PubMed] [Google Scholar]
- 11.van der Mei IA, Ponsonby AL, Dwyer T, Blizzard L, Simmons R, Taylor BV, Butzkueven H, Kilpatrick T. Past exposure to sun, skin phenotype, and risk of multiple sclerosis: Case-control study. BMJ. 2003;327:316. doi: 10.1136/bmj.327.7410.316. [DOI] [PMC free article] [PubMed] [Google Scholar]
- 12.Berwick M, Chen YT. Reliability of reported sunburn history in a case-control study of cutaneous malignant melanoma. Am J Epidemiol. 1995;141:1033–1037. doi: 10.1093/oxfordjournals.aje.a117367. [DOI] [PubMed] [Google Scholar]
- 13.Chodick G, Freedman MD, Kwok RK, Fears TR, Linet MS, Alexander BH, Kleinerman RA. Agreement between contemporaneously recorded and subsequently recalled time spent outdoors: Implications for environmental exposure studies. Ann Epidemiol. 2007;17:106–111. doi: 10.1016/j.annepidem.2006.06.004. [DOI] [PubMed] [Google Scholar]
- 14.de Gruijl FR. Skin cancer and solar UV radiation. Eur J Cancer. 1999;35:2003–2009. doi: 10.1016/s0959-8049(99)00283-x. [DOI] [PubMed] [Google Scholar]
- 15.Elwood JM, Jopson J. Melanoma and sun exposure: An overview of published studies. Int J Cancer. 1997;73:198–203. doi: 10.1002/(sici)1097-0215(19971009)73:2<198::aid-ijc6>3.0.co;2-r. [DOI] [PubMed] [Google Scholar]
- 16.Boice JD, Jr, Mandel JS, Doody MM, Yoder RC, McGowan R. A health survey of radiologic technologists. Cancer. 1992;69:586–598. doi: 10.1002/1097-0142(19920115)69:2<586::aid-cncr2820690251>3.0.co;2-3. [DOI] [PubMed] [Google Scholar]
- 17.Sigurdson AJ, Doody MM, Rao RS, Freedman DM, Alexander BH, Hauptmann M, Mohan AK, Yoshinaga S, Hill DA, Tarone R, Mabuchi K, Ron E, Linet MS. Cancer incidence in the US radiologic technologists health study, 1983-1998. Cancer. 2003;97:3080–3089. doi: 10.1002/cncr.11444. [DOI] [PubMed] [Google Scholar]
- 18.Gorsuch R. Factor Analysis. Lawrence Erlbaum Associates; Hillsdale: 1983. [Google Scholar]
- 19.Rummel R. Applied Factor Analysis. Northwestern University Press; Evanston, IL: 1970. [Google Scholar]
- 20.Klepeis NE, Nelson WC, Ott WR, Robinson JP, Tsang AM, Switzer P, Behar JV, Hern SC, Engelmann WH. The National Human Activity Pattern Survey (NHAPS): A resource for assessing exposure to environmental pollutants. J Expo Anal Environ Epidemiol. 2001;11:231–252. doi: 10.1038/sj.jea.7500165. [DOI] [PubMed] [Google Scholar]
- 21.Shelley K. Developing the American Time Use Survey activity classification system. Monthly Labor Rev Online. 2005;128:3–15. [Google Scholar]
- 22.Kimlin MG, Parisi AV. Ultraviolet radiation penetrating vehicle glass: A field based comparative study. Phys Med Biol. 1999;44:917–926. doi: 10.1088/0031-9155/44/4/008. [DOI] [PubMed] [Google Scholar]
- 23.Kimlin MG, Parisi AV, Carter BD, Turnbull D. Comparison of the solar spectral ultraviolet irradiance in motor vehicles with windows in an open and closed position. Int J Biometeorol. 2002;46:150–156. doi: 10.1007/s00484-002-0131-5. [DOI] [PubMed] [Google Scholar]
- 24.Moehrle M, Soballa M, Korn M. UV exposure in cars. Photodermatol Photoimmunol Photomed. 2003;19:175–181. doi: 10.1034/j.1600-0781.2003.00031.x. [DOI] [PubMed] [Google Scholar]
- 25.Godar DE, Wengraitis SP, Shreffler J, Sliney DH. UV doses of Americans. Photochem Photobiol. 2001;73:621–629. doi: 10.1562/0031-8655(2001)073<0621:udoa>2.0.co;2. [DOI] [PubMed] [Google Scholar]
- 26.Dwyer T, Muller HK, Blizzard L, Ashbolt R, Phillips G. The use of spectrophotometry to estimate melanin density in Caucasians. Cancer Epidemiol Biomarkers Prev. 1998;7:203–206. [PubMed] [Google Scholar]
- 27.Hoppin JA, Tolbert PE, Flagg EW, Blair A, Zahm SH. Use of a life events calendar approach to elicit occupational history from farmers. Am J Ind Med. 1998;34:470–476. doi: 10.1002/(sici)1097-0274(199811)34:5<470::aid-ajim7>3.0.co;2-u. [DOI] [PubMed] [Google Scholar]
- 28.Teschke K, Olshan AF, Daniels JL, De Roos AJ, Parks CG, Schulz M, Vaughan TL. Occupational exposure assessment in case-control studies: Opportunities for improvement. Occup Environ Med. 2002;59:575–593. doi: 10.1136/oem.59.9.575. discussion 594. [DOI] [PMC free article] [PubMed] [Google Scholar]
- 29.van der Mei IA, Blizzard AL, Ponsonby AL, Dwyer T. Validity and reliability of adult recall of past sun exposure in a case-control study of multiple sclerosis. Cancer Epidemiol Biomarkers Prev. 2006;15:1538–1544. doi: 10.1158/1055-9965.EPI-05-0969. [DOI] [PubMed] [Google Scholar]
Associated Data
This section collects any data citations, data availability statements, or supplementary materials included in this article.