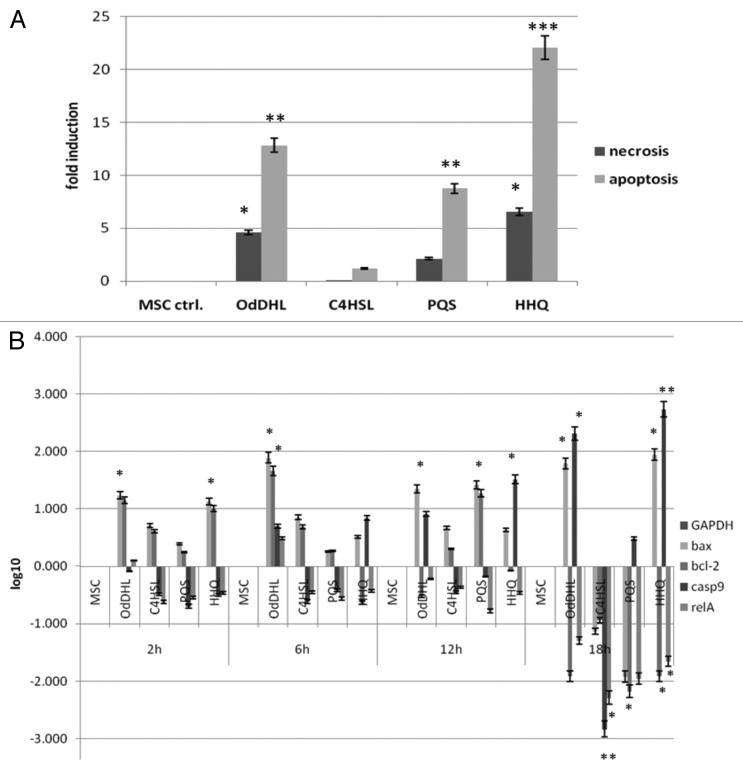
Figure 2. Graphic representation of MSCs apoptosis and necrosis rates at phenotypic (A) and gene expression level (B) after grown in the presence of 50 µM purified QSSMs. (A) Apoptosis and necrosis calculated induction rates obtained after analyzing flow cytometry results of MSCs treated with 50 µM of OdDHL, C4-HSL, PQS, and HHQ for 18 h. MSC ctrl, untreated control; *P < 0.05, **P < 0.01, ***P < 0.001 (sample vs. untreated control, based on ANOVA and Bonferroni post test of medians of 3 independent experiments performed in triplicate [n = 3]). (B) Graphic representation of gene expression patterns for bax, bcl-2, casp9, and relA from MSCs grown in the presence of 50 µM OdDHL, C4-HSL, PQS, and HHQ for 2, 6, 12, and 18 h, incubation at 37 °C, 5% CO2.

An official website of the United States government
Here's how you know
Official websites use .gov
A
.gov website belongs to an official
government organization in the United States.
Secure .gov websites use HTTPS
A lock (
) or https:// means you've safely
connected to the .gov website. Share sensitive
information only on official, secure websites.
