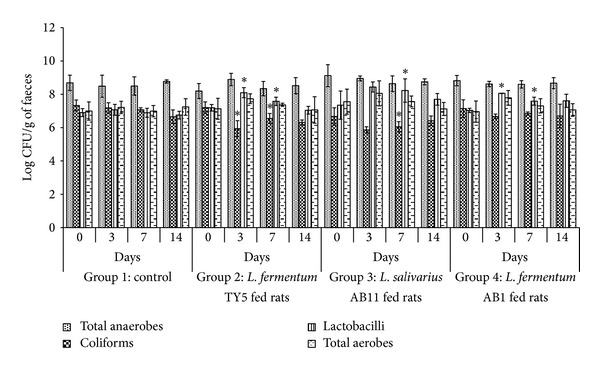
Figure 3.

Analysis of faecal microbiota composition in rats before and after oral administration of selected Lactobacillus. Each rat administered ~108 cells/day for one week. Viable counts of total anaerobes, coliforms, lactobacilli, and total aerobes expressed in terms of log CFU/g of faeces on days 0, 3, 7, and 14. Each value was represented as mean ± SD of log CFU/g wet faeces (n = four rats per group). *Significant difference in viable counts.
