Abstract
DICCCOL (Dense Individualized and Common Connectivity-based Cortical Landmarks) is a recently published system composed of 358 cortical landmarks that possess consistent correspondences across individuals and populations. Meanwhile, each DICCCOL landmark is localized in an individual brain’s unique morphological profile, and therefore the DICCCOL system offers a universal and individualized brain reference and localization framework. However, in current 358 diffusion tensor imaging (DTI)-derived DICCCOLs, only 95 of them have been functionally annotated via task-based or resting-state fMRI datasets and the functional roles of other DICCCOLs are unknown yet. This work aims to take the advantage of existing literature fMRI studies (1110 publications) reported and aggregated in the BrainMap database to examine the possible functional roles of 358 DICCCOLs via meta-analysis. Our experimental results demonstrate that a majority of 358 DICCCOLs can be functionally annotated by the BrainMap database, and many DICCCOLs have rich and diverse functional roles in multiple behavior domains. This study provides novel insights into the functional regularity and diversity of 358 DICCCOLs, and offers a starting point for future elucidation of fine-grained functional roles of cortical landmarks.
Keywords: structural connectivity, functional connectivity, brain networks
1. INTRODUCTION
For decades, the human brain mapping community has been interested in defining an anatomically and/or functionally annotated brain atlas and then warping it into individual brains via image registration methods (e.g., Collins et al., 1994; Thompson and Toga, 1996; Davatzikos, 1997; Fischl et al., 2002; Shen and Davatzikos, 2002; Liu et al., 2004; Van Essen and Dierker, 2007; Zilles and Amunts, 2009; Wu et al., 2011). This atlas warping methodology has dramatically advanced our understanding of the structure and function of the human brain at both individual level (e.g., Lao et al., 2004; Fan et al., 2008) and group level (e.g., Ashburner et al., 2003; Davatzikos, 2004). In the fMRI field, the common practice is to report a stereotaxic coordinate for brain activation, usually in relation to the Talairach or the Montreal Neurological Institute (MNI) coordinate system (e.g., 74% of over 9,400 fMRI studies (Derrfuss and Mar, 2009)). As a result, the development and application of a universal coordinate database for the purpose of aggregating and integrating fMRI results reported in the standardized Talairach or MNI coordinate systems have received increasingly strong interests (e.g., Laird et al., 2005; Laird et al. 2009; Hamilton, 2009; Costafreda, 2009). In particular, meta-analysis (the pooled analysis of published fMRI activations) of many published results (e.g., Laird et al., 2005; Laird et al. 2009) is deemed to significantly enhance the statistical power and reliability of individual fMRI studies, and thus is widely adopted and applied in the neuroimaging field.
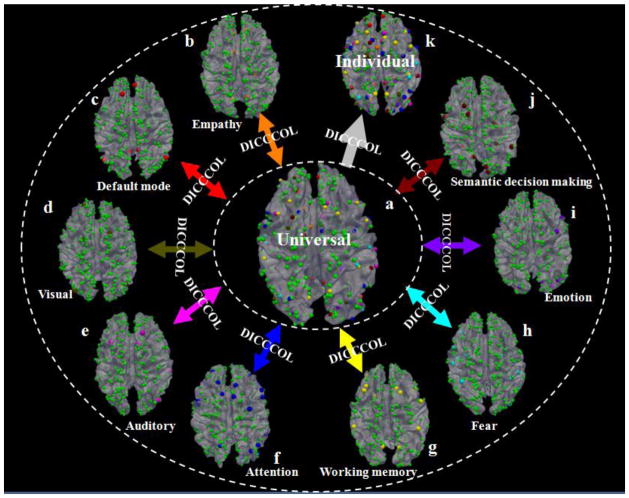
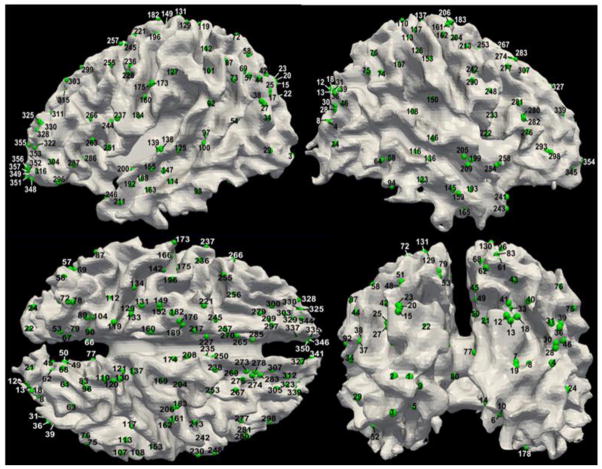
As an alternative approach to the popular stereotaxic coordinate based representation of brain function (Derrfuss and Mar, 2009), our recent studies in Zhu et al., 2012 developed and validated a landmark based brain reference and localization system, named Dense Individualized and Common Connectivity-based Cortical Landmarks (DICCCOL). As shown in Fig. 1, the DICCCOL system at the current stage is composed of 358 cortical landmarks, each of which was optimized to possess consistent group-wise DTI-derived fiber connection patterns across populations (Zhu et al., 2011; Zhu et al., 2012). The neuroscience basis is that each cortical region’s cyto-architectonic area has a unique set of extrinsic inputs/outputs (named the “connectional fingerprint” (Passingham et al., 2002)), which generally predicts the functions that each cortical area could possibly possess. This close relationship between structural connectivity pattern and brain function has been reported and replicated in a series of our recent works (Li et al., 2010; Zhu et al., 2011; Zhu et al., 2012; Zhang et al., 2011; Li et al., 2012; Li et al., 2012b; Li et al., 2012c). Therefore, we employed this principle and a data-driven approach (Zhu et al., 2012) to discover a dense map of 358 cortical landmarks via the maximization of group-wise consistency of trace-map description (Zhu et al., 2011; Zhu et al., 2012) of each landmark’s structural connection pattern. The set of 358 optimized DICCCOL landmarks has been replicated and reproduced in over 240 healthy brains and its predictions in four different multimodal fMRI/DTI datasets have been released publicly online at http://dicccol.cs.uga.edu.
Fig. 1.
Overview of the DICCCOL brain reference and localization system (Zhu et al., 2012). Spheres in orange (total 6), red (total 8), brown (total 9), pink (total 8), blue (total 27), yellow (total 14), cyan (total 14), purple (total 16), and black-red (total 19) colors represent DICCCOLs in empathy, default mode, visual, auditory, attention, working memory, fear, emotion, and semantic decision making networks that are identified from fMRI datasets (Zhu et al., 2012). The green spheres (totally 263) are landmarks that have not been functionally-labeled yet. The DICCCOLs can be used as the structural substrates to represent the common structural brain architecture. For instance, nine functionally-specialized networks ((b)–(j)) identified from different fMRI datasets (Zhu et al., 2012) can be integrated into the same universal brain reference system (a) via DICCCOL. Also, the functionally-annotated DICCCOLs can be predicted in an individual brain with DTI data such that the DICCCOLs and their functional roles can be readily transferred to a separate brain image (k).
To examine the potential functional roles of those 358 DICCCOLs, we have used six different datasets of multimodal task-based fMRI/DTI and resting state fMRI/DTI images to functionally annotate a portion of those DICCCOLs (Zhu et al., 2012), and 95 of them have been labeled into nine functional networks including working memory, visual, auditory, semantics, attention, emotion, fear, empathy, and default mode networks (Zhu et al., 2012). The multimodal fMRI/DTI studies have demonstrated that these 95 DICCCOLs not only possess consistent structural connection patterns, but also exhibit common functional activations (Zhu et al., 2012), as determined by either task-based fMRI or resting state fMRI data. However, due to the cost and time constraints, it is impractical to acquire as many task-based fMRI datasets as needed, e.g., all of the 55 functional domains used in the BrainMap system (Laird et al., 2009), to functionally label all of these 358 DICCCOLs in the same group of human subjects participated in our study (Zhu et al., 2012). Consequently, the current functional annotation of 358 DICCCOLs is far from being comprehensive and complete yet. Thus, we are strongly motivated to leverage the many existing literature fMRI studies and their results already aggregated and reported in the BrainMap database (Laird et al., 2005; Laird et al., 2009), and perform meta-analysis of the potential functional roles of the 358 DICCCOLs in this work.
In this meta-analysis study, we have used 1110 fMRI publications and their analysis results reported in the BrainMap database (Laird et al., 2005; Laird et al., 2009) to examine the potential functional roles of those 358 DICCCOLs. Briefly, the DICCCOLs in our template space (Zhu et al., 2012) were linearly warped (via FLS FNIRT) into the MNI template space used in the BrainMap database based on structural T1-weighted MRI images. Then, within each DICCCOL’s neighborhood of 3 mm radius in the MNI atlas space, all of the related fMRI publications and their reported activation foci in the BrainMap database were searched and examined. Thus, we obtained a large-scale 1110 (publications) × 358 (DICCCOL IDs) matrix (Supplemental Table 1) that reports a complete mapping of DTI-derived DICCCOL landmarks and their potential functional roles reported by literature fMRI studies. Detailed analyses of this map provide a variety of interesting results that motivated us to share them with the neuroimaging and neuroinformatics communities in this article. The rest of the paper is organized as follows. In Section 2, we detail the development of DICCCOL, its transform into the BrainMap database, and the meta-analysis procedure. Section 3 presents the details and interpretations of the meta-analysis results. Discussions and conclusions are provided in Section 4.
2. MATERIALS AND METHODS
2.1. DICCCOL
The 358 DICCCOLs, as shown in Fig. 1, were discovered and defined in a group of ten healthy adult brains, and were reproduced and replicated in over 240 healthy brains including three age groups of adolescent, adults and elders (Zhu et al., 2012). One of the prominent attribute of the DICCCOL system is that these 358 landmarks can be fairly accurately predicted in a single brain with DTI data (Zhang et al., 2011; Zhu et al., 2012; Li et al., 2012b), and our extensive evaluation results based on fMRI-derived benchmarks have shown that the average prediction error is around 6.25 mm (Zhu et al., 2012). In particular, quantitative comparisons of the DICCCOL localization accuracy with other linear and nonlinear brain image registration algorithms including FSL FLIRT (Jenkinson and Smith, 2001), FSL FNIRT (Andersson et al., 2008), ANTS (Avants et al., 2008), and HAMMER (Shen and Davatzikos, 2002) have shown that the DICCCOL system is substantially better (Zhu et al., 2012). Therefore, once the functional roles of certain DICCCOLs are determined in a certain multimodal fMRI/DTI dataset, this information could possibly be readily transferred to other brains. That is, the DICCCOL system offers a general platform to aggregate and integrate the brain’s functional information from different multimodal fMRI/DTI datasets into the universal DICCCOL map (Zhu et al., 2012), the sum of which can then be transferred to a new, separate individual brain via DTI data.
A complete list of those 358 DICCCOLs and their coordinates in the Talairach/MNI atlas spaces were provided in Zhu et al., 2012. It is apparent that although the Brodmann labels of these DICCCOLs provide the basic anatomic location and rough functional localization, the fine-grained functional roles of these DICCCOLs need to be determined by task-based fMRI data, which is widely considered and used as a benchmark approach to performing functional localizations. Our prior studies have used six task-based fMRI datasets and four resting state fMRI datasets to examine the functional roles of those 358 DICCCOLs (Zhu et al., 2012), and identified 95 DICCCOLs that are co-localized with the consistent activation/activity peaks in the fMRI datasets. A reproducibility study in Zhu et al., 2012 demonstrated that the functionally-annotated default mode network (DMN) nodes are remarkably reproducible in four independent groups of subjects, and the average Euclidean distance from DICCCOLs to the group-ICA (independent component analysis) derived benchmark peaks is around 5.43 mm (Zhu et al., 2012).
Though our prior studies already provided nine functional networks and their labels in the DICCCOL system, it is still far from being comprehensive and systematic to provide a complete functional brain reference and localization system. As shown in Fig. 1, despite the 95 colored DICCCOLs, there are still other 263 DICCCOLs in green that have not been functionally annotated yet. Considering that there are already thousands of published fMRI studies and their detected activation foci aggregated into the BrainMap database (http://brainmap.org, Laird et al. 2005; Laird et al., 2009), we hypothesize that this rich information source derived from the whole fMRI community could provide informative functional annotations to the 358 DTI-derived DICCCOLs.
2.2. Meta-analysis of functional roles of 358 DICCCOLs
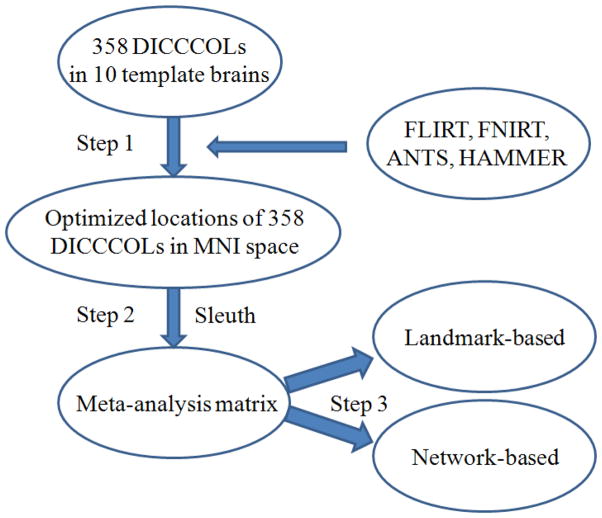
The flowchart of the meta-analysis of functional roles of 358 DICCCOLs is summarized in Fig. 2. In general, there are three steps in the computational pipeline. In step 1, four brain image registration algorithms were used to warp the 358 DICCCOLs in the MRI images of ten template brains into the MNI atlas space. Then, a meta-analysis of the warped DICCCOLs’ coordinates in the MNI atlas was performed to find the centers of their distributions within the atlas image. In step 2, the Sleuth tool (Laird et al., 2009) provided by the BrainMap database and toolkit was used to search the relevant fMRI publications and experiments. As a result, a large-scale matrix that maps the association between the fMRI experiments in BrainMap and the 358 DICCCOLs was obtained (Supplemental Table 1). In the step 3, both landmark-based and network-based meta-analyses were performed on the above matrix to infer potential functional roles of DICCCOLs. The following two sections will provide details for these steps, respectively.
Fig. 2.
The flowchart of the computational pipeline for meta-analysis of functional roles of 358 DICCCOLs. Three major steps are involved in this meta-analysis study.
2.2.1. Coordinates of 358 DICCCOLs in the MNI atlas space
In the DICCCOL system, all cortical landmarks were defined and predicted based on DTI images (Zhu et al., 2012). However, the two atlases (either MNI or Talairach) used in the BrainMap database are based on T1-weighted MRI images and have no DTI images available. Therefore, the transform of DTI-derived DICCCOLs into the MNI/Talairach atlas image has to rely on the registration of MRI images. Given the 358 DICCCOLs in ten template brains with structural MRI images (Zhu et al., 2012), we registered all these DICCCOLs in each template brain’s DTI images into the their corresponding MRI images by FSL FLIRT, and then warped them to the MNI template via four different MRI image registration methods including FSL FLIRT (Jenkinson and Smith, 2001), FSL FNIRT (Andersson et al., 2008), ANTS (Avants et al., 2008), and HAMMER (Shen and Davatzikos, 2002). Since there is no ground-truth for the correspondences of DICCCOLs in the MNI atlas image, we assessed the performances of these four image registration algorithms in terms of consistency by measuring the distances between the individually warped 358 landmarks to the averaged centers of the warped DICCCOLs from multiple templates. The comparison results of these four image registration methods are provided in Supplemental Fig. 1. On average, the FSL FNIRT algorithm has slightly better accuracy (6.29 mm) than others three image registration algorithms (6.69 mm for FSL FLIRT, 6.31 mm for ANTS, and 6.43 mm for HAMMER, respectively). Therefore, we used the warped DICCCOLs by FSL FNIRT to calculate the coordinates of the 358 DICCCOL landmarks in the MNI atlas space.
To further justify using FSL FNIRT in this meta-analysis study, we used a working memory task-based fMRI dataset (Faraco et al., 2011) that provides consistent functional regions to evaluate the registration accuracies of four image registration methods. Totally, 15 consistently activated brain regions were recognized and identified from the working memory task (Zhu et al., 2011), and one subject was randomly selected as the template. The activated regions in other subjects were warped to the template subject. The performances of four image registration algorithms (FSL FLIRT, FSL FNIRT, ANTS, and HAMMER) were assessed by measuring the distances between the individually warped ROIs to the corresponding ROIs in the template subject. The results are summarized in Supplemental Table 2. It can be clearly seen that the FSL FNIRT has the best performance, which justifies using FNIRT to warp 358 DICCCOLs in the MRI images of ten template brains into the MNI space.
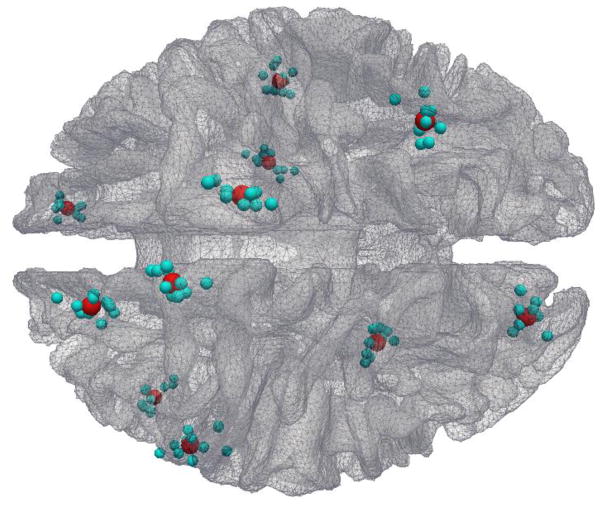
After all of these 358 DICCCOLs in the ten template brains were warped into the MNI template space using FSL FNIRT, each DICCCOL landmark has ten candidate localizations in the MNI template space. Given that there is no benchmark in the MNI atlas space, the warped ten landmarks for the same DICCCOL could be widely spread due to the inaccuracy of image registration and the intrinsic variation of cortical anatomies in different brains (as shown by the cyan spheres in Fig. 3), we used a meta-analysis to determine the DICCCOL locations in the template space. Specifically, the center of each group of ten warped landmarks was used as the location of a DICCCOL, as illustrated by the red spheres in Fig. 3.
Fig. 3.
Distributions of 11 randomly selected DICCCOL landmarks warped from ten template subjects into the MNI space, as represented by the cyan spheres. The red ones represent the centers of corresponding warped landmarks. It is obvious that the warped landmarks are distributed widespread around their centers.
2.2.2. Mapping fMRI experiments, activation foci and DICCCOLs
With the localized coordinate of each DICCCOL landmark, we then used the Sleuth toolkit provided by the BrainMap system to search fMRI experiments in the BrainMap database (Laird, et al., 2009) that cover our DICCCOLs. To illustrate the procedure, we use the first DICCCOL landmark as an example to search the corresponding fMRI experiments, as shown in Supplemental Fig. 2. We selected the location as the search request, inputted the coordinates of the first DICCCOL (-19, -90, 10), and used the neighborhood size of 3 mm (purple ellipse) as the search setting. Notably, since the DICCCOL system has higher spatial resolution than the traditionally used Brodmann atlas and it is expected that the DICCCOLs with distance larger than 6 mm can be treated as separate entities (Zhu et al., 2012), we searched the radius of 3 mm around each DICCCOL ROI. Essential information of the activations falling into the 3 mm neighborhood of the coordinate of the first DICCCOL was obtained, including the paper ID in the BrainMap database, coordinates in Talairach/MNI atlas, Brodmann area, task design, and behavioral domains, as shown in Supplemental Fig. 3. Notably, only fMRI studies with healthy subjects in the BrainMap database were included in this work, since the DICCCOL system was primarily developed for healthy brains.
In order to represent the activation foci of fMRI experiments using DICCCOLs, we measured the Euclidean distance between the reported fMRI activation foci with our DICCCOLs’ coordinates. If the distance between an fMRI activation and one DICCCOL is below 8 mm, the corresponding DICCCOL is associated with the reported fMRI activation. Otherwise, the fMRI activation is considered outside of our study scope. If the activation can be associated with more than one DICCCOL given the 8 mm distance, we represent the activation by the DICCCOL that has the minimum distance between them. Our rationale is that our prior studies in Zhu et al., 2011 demonstrated that approximately 90% of fMRI-derived activation peaks could be optimized to be consistent with DTI-derived landmarks within 8 mm distance. Therefore, in this work, we enforce that structural and functional correspondences should be within the distance of 8 mm. In an example (functional network #6) shown in Supplemental Fig. 4, the fMRI experiment had 28 activation foci, but only 15 (red spheres) of them can be associated with DICCCOLs (yellow spheres). Supplemental Table 3 shows an example of the representation procedure of associating fMRI activation foci to DICCCOLs.
2.3. Landmark-based and network-based meta-analysis
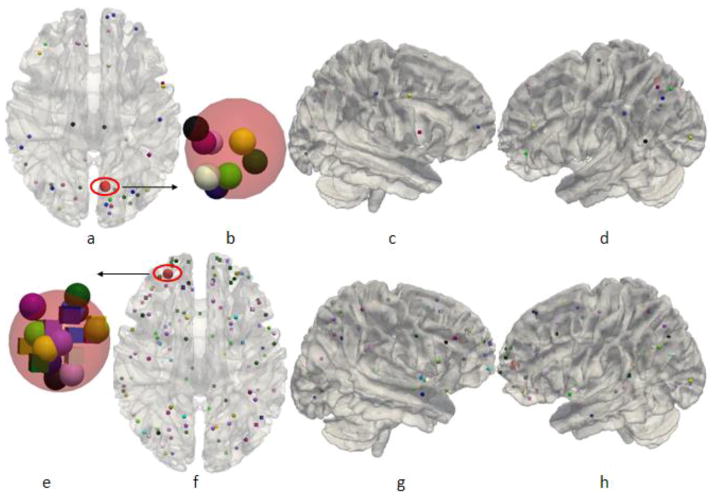
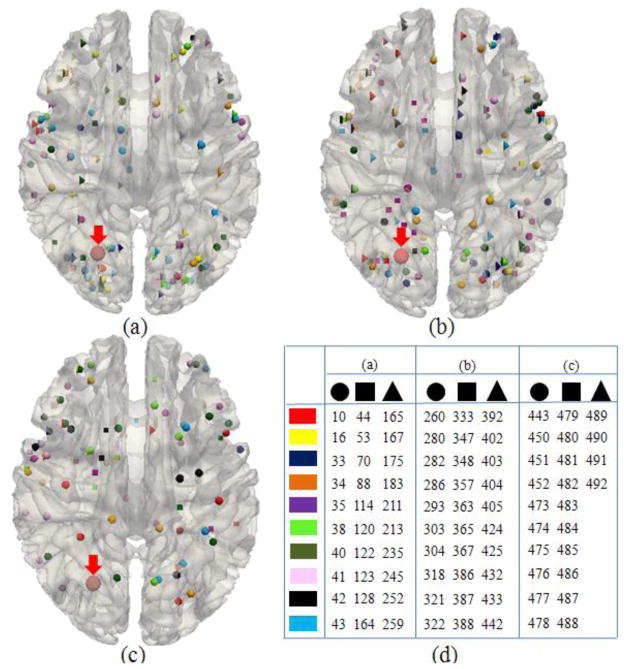
After we represented the fMRI experiments and their activation foci in the BrainMap database using DICCCOLs, we obtained a comprehensive map of 1110 fMRI experiments and 358 DICCCOLs (Supplemental Table 1). In this subsection, we will conduct both landmark-based and network-based analyses, respectively. The purpose of landmark-based analysis is to assess the possible varieties of functional roles (e.g., Bisley and Pasternak, 2000; Fogassi et al., 2005) that one cortical region (e.g., DICCCOL) could possibly perform. For the landmark-based analysis, we calculated the number of fMRI experiments and the derived functional networks that are associated with each DICCCOL, as shown in Fig. 4. For instance, the DICCCOL #45 (shown in red color in Fig. 4a) is associated with the activation foci of 8 fMRI experiments and functional networks, and each different color represents a separate network in Figs. 4a, 4c, 4d. Similarly, Figs.4e–4h show the functional networks that are associated with DICCCOL #322. The visualization of DICCCOLs locations on the cortical surface is provided in Fig. 5 and their fiber connection patterns are available at: http://dicccol.cs.uga.edu. In addition, the anatomical coordinates of each DICCCOL in the Talairach/MNI atlas spaces and the associated paper IDs in the BrainMap database are provided in Supplemental Table 7.
Fig. 4.
The DICCCOL #45 is involved in 8 functional networks shown in (a)–(d). The DICCCOL # 322 is involved in 23 functional networks as shown in (e)–(h). The figures of (b) and (e) are the zoomed views of the red spheres in (a) and (f), respectively.
Fig. 5.
The distribution of 358 DICCCOLs on the cortical surface.
In total, there are 1110 fMRI experiments and the corresponding activated functional networks (each fMRI activation pattern is considered as a functional network) that have been associated with 358 DICCCOLs. In the network-based analysis, we measured the frequencies of co-activation (Toro et al., 2008) between any pair of DICCCOLs based on the 1110 functional networks and their activation foci, and obtained a 358*358 matrix of co-activation or functional connectivity map. That is, if any pair of DICCCOLs was reported to be within the same fMRI-derived functional networks in the BrainMap database, their functional co-activation strength is incremented by one and the total co-activation map is accumulated over all of these 1110 fMRI studies. Intuitively, this co-activation map of DICCCOLs reflects the probability of how likely the DICCCOLs are co-active under the same task performance (Toro et al., 2008; Lair et al., 2011), which is a statistical measurement of functional connectivity among DICCCOL landmarks. Then, this 358*358 co-activation map was clustered into 10 sub-networks via a multimodal multi-view spectral clustering algorithm (Kumar and Daume, 2011; Chen et al., 2012). The basic idea is that both structural connectivity and resting state functional connectivity matrices between DICCCOLs that were derived from DTI and R-fMRI datasets (Zhu et al., 2012) are simultaneously considered together with the task-based fMRI-derived co-activation map, all of which are then clustered into a homogenous, multi-view, and multi-model sub-networks. The major advantage of the multi-view spectral clustering methodology (Kumar and Daume, 2011; Chen et al., 2012) is that it can effectively deal with heterogeneous features, e.g., three types of connectivity matrices in this paper, by the maximization of the mutual agreement across multimodal clusters in different views. In this paper, we considered each type of connectivity (structural connectivity, resting state functional connectivity, and task-based functional connectivity) in a group of subjects as a separate view of the studied large-scale network, and model the clustering of group-wise consistent multimodal brain sub-networks in a unified multi-view clustering framework. In this way, the substantial variabilities of large-scale brain networks across modalities (DTI, resting state fMRI, and task-based fMRI) and different populations (the subjects in our studies (Zhu et al., 2012) and the subjects in the BrainMap database (Laird et al., 2009)) are modeled and handled effectively by the powerful multi-view spectral clustering method (Kumar and Daume, 2011; Chen et al., 2012). Therefore, consistent and functionally meaningful sub-networks can be identified across modalities and populations, which is one of the major methodology contributions of this paper. Finally, each of the 1110 fMRI-derived functional networks obtained from the BrainMap database will be assigned to one of the sub-networks, if more than half of its activation foci are associated with the corresponding DICCCOLs within the sub-network.
3. RESULTS
3.1 Landmark-based analysis
3.1.1 The DICCCOLs associated with functional networks
We performed statistical analyses of the DICCCOLs associated with each functional network. It turns out that 73.5% of the functional networks include more than or equal to 4 DICCCOL landmarks. On average, each functional network is associated with 5.89 DICCCOLs, and the detailed distribution is provided in Fig. 6. This result suggests that the 358 DICCCOLs can reasonably cover the major functional areas of the cerebral cortex, as conjectured in Zhu et al., 2012. We also found that the largest functional network includes 23 DICCCOLs and the top 20 functional networks with the largest numbers of DICCCOLs are shown in Table 1. It is evident that most of the top networks are related to higher functions such as attention, emotion, memory, language, semantics, and speech. This result suggests that the DICCCOL system can be used to represent large-scale functional networks across the whole brain, which is one of the original design objectives of the DICCCOL system (Zhu et al., 2012). As examples, the top 3 functional networks in Table 1 with the largest numbers of DICCCOLs are visualized on the cortical surface in Figs. 7a–7c. It is interesting that although both of the first and second networks (Figs. 7a–7b) are functionally annotated as “Cognition. Attention” from two different publications (BrainMap paper IDs 5080210 and 30360, respectively), they have 4 DICCCOLs in common (highlighted by arrows) and have other 18 DICCCOLs located in different regions. From a neuroscience perspective, this result demonstrates the co-existence of common and variable functional regions activated/involved in different types of attention tasks. From a methodology perspective, this result indicates that the DICCCOL system can be very useful to visualize and quantitatively represent the functional brain regions activated in different tasks. The DICCCOLs distributions for “Action. Motor Learning” in Figs. 7c are also quite reasonable, given current neuroscience knowledge about motor learning (Diedrichsen et al., 2005).
Fig. 6.
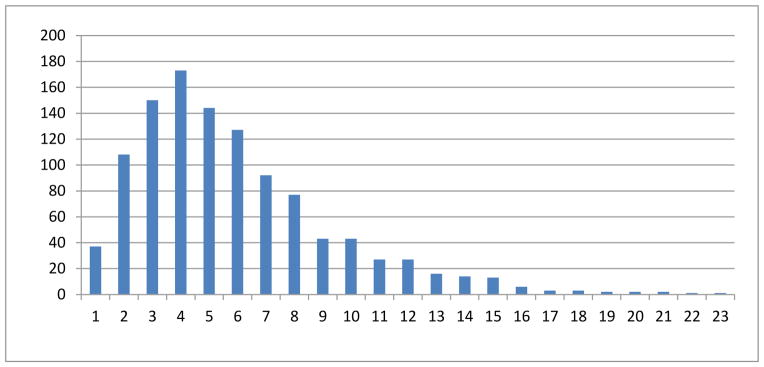
The histogram of the number of DICCCOLs in functional networks. The horizontal axis represents the numbers of DICCCOLs associated with functional networks, while the vertical axis is the number of networks. The index of DICCCOLs in the cortical surface are shown in Fig. 5. We fitted a Gaussian distribution model to the histogram. For those networks with more than 16 counts, we have over 95% confidence level.
Table 1.
The details of top 20 functional networks with the largest numbers of DICCCOLs. The network IDs are referred to Supplemental Table 1.
| Network ID | Behavioral domain | Number of DICCCOLs | BrainMap paper ID |
|---|---|---|---|
| 105 | Cognition. Attention | 23 | 5080210 |
| 153 | Cognition. Attention | 22 | 30360 |
| 39 | Action. Motor Learning | 21 | 7030086 |
| 951 | Emotion | 21 | 8110289 |
| 2 | Action. Execution. Speech, Cognition. Language. Speech | 20 | 30081 |
| 43 | Cognition. Attention, Perception. Vision. Motion | 20 | 30175 |
| 356 | Cognition. Language. Speech, Perception. Audition | 19 | 8110296 |
| 433 | Action. Inhibition, Cognition. Attention | 19 | 10080149 |
| 179 | Cognition, Emotion | 18 | 11010021 |
| 436 | Action. Inhibition, Cognition. Attention | 18 | 10080149 |
| 735 | Cognition. Attention | 18 | 30126 |
| 183 | Cognition. Language, Cognition. Memory. Explicit | 17 | 5070082 |
| 199 | Cognition. Memory. Working | 17 | 6080141 |
| 286 | Cognition. Language. Semantics, Cognition. Memory. Explicit | 17 | 6060077 |
| 30 | Cognition | 16 | 7070192 |
| 46 | Cognition. Memory. Working | 16 | 7120368 |
| 126 | Cognition. Attention | 16 | 5080210 |
| 222 | Cognition. Language. Speech, Perception. Audition | 16 | 9090113 |
| 293 | Cognition. Attention | 16 | 10030017 |
| 673 | Emotion, Cognition. Social Cognition | 16 | 9090156 |
Fig. 7.
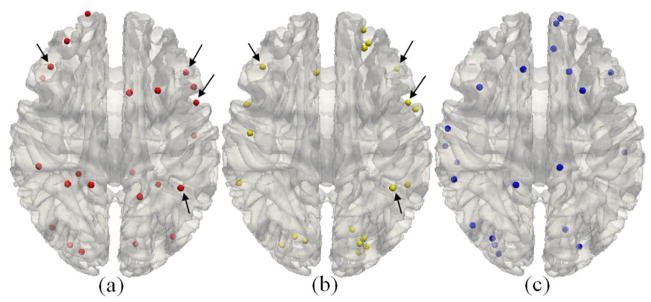
The top 3 functional networks ((a)–(c)) associated with the largest numbers of DICCCOLs. The arrows in (a) and (b) highlighted the common DICCCOLs in two networks. The details of these three networks including names and network IDs are listed in the top three rows of Table 1, and additional details are provided in Supplemental Table 1.
3.1.2. The functional networks associated with each DICCCOL
In this subsection, we analyzed the number of functional networks associated with each DICCCOL. On average, each DICCCOL is associated with 18.26 functional networks and Supplemental Fig. 5 shows the histogram. Fig. 8 shows the color-coded distributions of the number of functional networks associated with 358 DICCCOLs on the cortical surface. It is interesting that the distribution patterns exhibit certain level of symmetry between two hemispheres, as highlighted by the arrows in Fig. 8a. Also, certain DICCCOLs, e.g., those in the Broca’s areas and Heschl’s gyrus pointed by the arrows in Figs. 8b–8c, have substantially more numbers of associated functional networks than others. The results in Fig. 8 clearly demonstrates that one cortical region represented by DICCCOL could participate in multiple functional roles, as widely reported in the literature (e.g., Bisley and Pasternak, 2000; Lalonde et al., 2002; Fogassi et al., 2005; Zaksas et al., 2006; Fischera et al., 2008). In particular, we found the following DICCCOL IDs: #48, #113, #228, #242, #128, #180, #300, #244, #213, and #187 (as showed in Fig. 8(d)) are associated with the largest numbers of functional networks (e.g., over 57 networks), meaning that they potentially have many functional roles. These results offer novel insights into the diversity of functional roles of DICCCOLs.
Fig. 8.

The color-coded distributions of the numbers of functional networks associated with DICCCOLs. (a), (b), (c) represent the superior, right and left lateral views. The numbers of functional networks were truncated to 25 for visualization purpose. The arrows in (a) highlighted areas with certain degree of inter-hemispheric symmetry. The arrows in (b) and (c) point to DICCCOLs with substantially more numbers of functional networks. (d) shows the distributions of top 20 DICCCOLs with the largest numbers of associated functional networks.
As one example, we visualized the functional networks associated with DICCCOL #48 in Fig. 9 and randomly selected 20 functional networks associated with DICCCOL #48 as listed in Supplemental Table 4. It is apparent that DICCCOL #48 is extensively involved in many functional networks across the whole brain, suggesting that it might be a functional hub of the brain. To independently examine this conjecture, we visualized the DTI-derived fiber tracts emanating from the DICCCOL #48 in ten brains in Fig. 10. It can be clearly seen that this DICCCOL #48 landmark has quite dense and complex DTI-derived fiber connections to other cortical lobes such as the frontal, parietal, temporal and occipital lobes, which partly explain the large number of different functional roles shown in Fig. 9. Additional visualizations of the fiber tracts emanating DICCCOLs #113, #228, #242, #128, #180, #300, #244, #213, and #187 can be seen at: http://dicccol.cs.uga.edu. Supplemental Table 5 lists the details of the top 20 DICCCOLs with the highest numbers of functional networks. Altogether, these results suggest the close relationship between the structural connection patterns and functional roles of cortical regions, which further supports the biological principle underling the DICCCOL system.
Fig. 9.
The distribution of the functional networks associated with the DICCCOL #48. (a)–(c): the functional networks are divided into three groups in three figures for visualization purpose, respectively. (d) The index of the functional networks in (a)–(c) associated with DICCCOL #48, which can be found in the Supplemental Table 1.
Fig. 10.
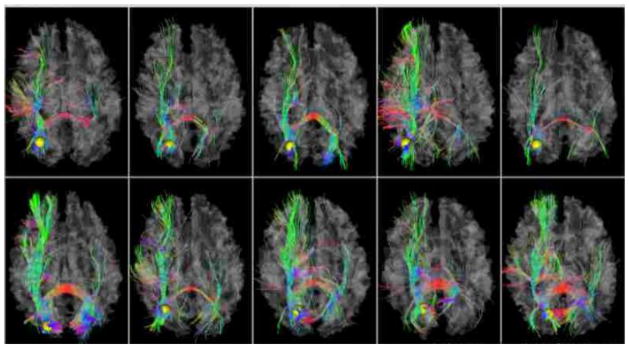
The DTI-derived fiber tracts connected to the DICCCOL #48 in 10 template subjects.
Notably, we also found that the number of functional networks associated with DICCCOLs #65, #206, #342, #348, #349, #350, #352, and #357 are zero, as shown by the red color spheres in Fig. 11. That is, these DICCCOLs are not involved in any of the 1110 functional networks reported in the BrainMap database. In addition, these DICCCOLs were not activated in any of our nine task-based fMRI datasets (Zhu et al., 2012). This result suggests that more studies should be performed or additional literature studies should be examined in the future to investigate the possible functional roles of these DICCCOLs with no functional roles reported so far in this work. For instance, it would be interesting to examine the functional connectivities of these DICCCOLs during resting state or under task performances in fMRI studies such that their functional roles might be inferred. Furthermore, the bottom 30 DICCCOLs associated with the least numbers of functional networks are listed in Supplemental Table 6, which merits further extensive fMRI and connectivity studies in the future.
Fig. 11.
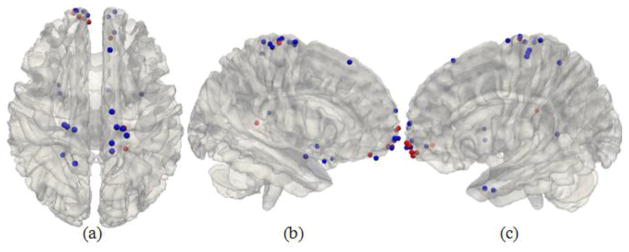
The 30 ROIs with the lowest numbers of associated functional networks. The red color represents the DICCCOL with no associated networks.
3.1.3. The duplicated functional roles of DICCCOLs
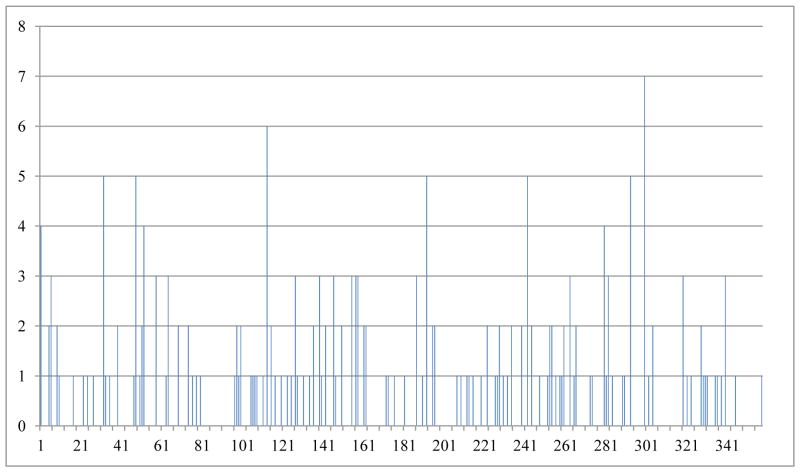
For one task-based fMRI experiment, we can represent each activation peak by one DICCCOL landmark based on the criterion that the distance between the actual activation and a DICCCOL is below 8 mm. However, we found an interesting result that for one fMRI experiment, there could be more than one activation focus (e.g., 2) that are represented by the same DICCCOL, indicating that these DICCCOLs might not be spatially dense enough to represent functional brain networks. The distribution of duplicated times for each DICCCOL is shown in the Fig. 12. For example, the top ten DICCCOLs with duplicated roles are: #300, #113, #32, #48, #192, #242, #293, #1, #52, and #280. As an example, in the functional network #72 (Supplemental Table 1), it has 14 activation foci as shown in Supplemental Fig. 6. However, there are two activation foci located in the same neighborhood of DICCCOL #9. This result means that some DICCCOLs are not dense enough to represent the fine-grained functional brain network nodes. This result will give us important clues about where and how to improve the spatial resolution of DICCCOLs in the future.
Fig. 12.
The distribution of duplicated times for each DICCCOL.
3.2. Network-based analysis
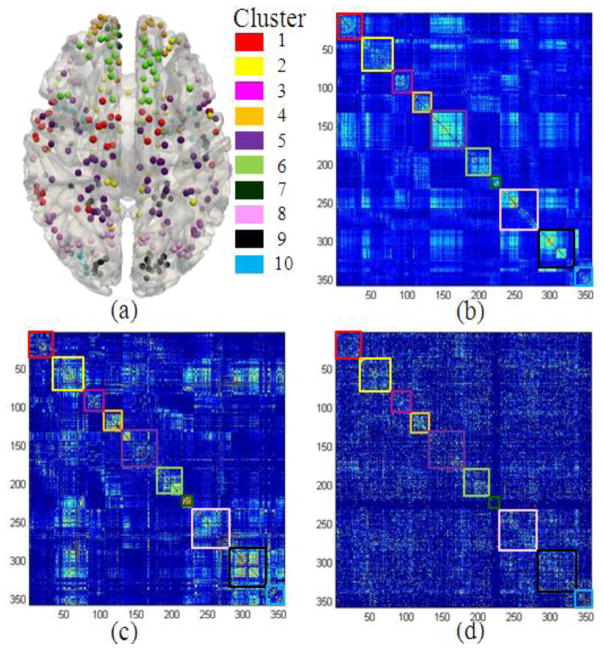
In this subsection, we examined the network-scale distributions of the 1110 fMRI studies in the BrainMap database within the context of the DTI-derived DICCCOL system (details of each DICCCOL are provided in Supplemental Table 7). Based on the multi-view network clustering methods described in Section 2.3, we grouped the functional co-activation networks that were reported in the BrainMap database and represented by the DICCCOLs into 10 clusters, as shown in Table 2. That is, for each of the 1110 fMRI-derived functional networks, if more than half of its reported activation foci are associated with the corresponding DICCCOLs within a cluster, the functional network is annotated with the same cluster. Notably, the cluster number of 10 was determined experimentally. Specifically, we conducted a variety of experiments by varying the clustering number from 5 to 20, in order to obtain the best consistency among the resting-state functional networks, DTI-derived structural networks, and BrainMap-derived co-activation networks. Given the lack of benchmark, we visually examined all of these clustering results and found 10 to be more suitable. The visualizations of these 10 clustered functional networks are shown in Fig. 13a. It is evident that the clustering result is quite reasonable given current brain networks knowledge (Bullmore and Sporns, 2009), e.g., those clusters concentrated on functionally meaningful areas, such as the cluster #9 in the occipital lobes and cluster #5 in the motor and sensory areas. In particular, the clustered task-based fMRI derived networks (Fig. 13d) are reasonably consistent with those connectivity patterns derived from resting state fMRI (Fig. 13b) and DTI (Fig. 13c) data, as shown by the colored boxes for different clusters respectively. Notably, the results in Fig. 13 are consistent with a recent study in Lair et al., 2011 which demonstrated that intrinsic connectivity networks derived from resting state fMRI data are well correlated with co-activation networks mapped from the BrainMap database. Importantly, the results in this paper further suggest the close relationships among structural, resting-state functional and task-based functional networks, and demonstrate the possibility of deriving consistent sub-networks across multiple modalities and populations. Also, these analyses demonstrate the advantage of analyzing the fMRI studies and results reported in the BrainMap within the context of the DICCCOL system, which serves as the bridge that links fMRI-derived activation patterns to DTI-derived structural networks and R-fMRI-derived resting state networks simultaneously. This result offers novel insights into the regularity of brain networks.
Table 2.
The number of functional networks reported in the BrainMap database and the number of DICCCOLs in each cluster.
| Cluster index | Number of DICCCOLs | Number of networks | Cluster index | Number of DICCCOLs | Number of networks |
|---|---|---|---|---|---|
| 1 | 35 | 87 | 6 | 33 | 30 |
| 2 | 47 | 111 | 7 | 15 | 0 |
| 3 | 25 | 28 | 8 | 53 | 127 |
| 4 | 24 | 25 | 9 | 51 | 75 |
| 5 | 51 | 111 | 10 | 24 | 13 |
Fig. 13.
(a) Visualizations of the 10 clustered brain networks on the cortical surface. The color bars are shown on the right. (b) The resting state connectivity matrix. (c) The DTI-derived structural connectivity matrix. (d) Functional connectivity matrix derived from the co-activations reported in the BrainMap database. The colors in the cluster boxes in (b)–(d) correspond to those in the color bars in (a). For visualization purpose, we normalized the original matrix by each row and then added the normalized matrix with its transpose.
Furthermore, we examined the details of functional networks in each cluster shown in Fig. 13 and Table 2. For example, the cluster #1 contains 87 fMRI-derived functional networks (shown in Supplemental Fig. 7 and listed in Table 3). For each functional network, we searched its original fMRI experiment and the corresponding behavioral domain (listed in Table 3) and found that most of them are located in the regions of action execution and perception. This result is quite reasonable based on the locations of the DICCCOLs on the cortical surface shown in Supplemental Fig. 7. Also, this result is in agreement with other literature reports about the functional localizations of motion execution and social perception, e.g., in the premotor areas (Gazzola and Keysers, 2009; Keysers et al., 2010), where some of the red DICCCOLs in Supplemental Fig. 7a concentrate on. Moreover, the resting-state functional connectivity patterns, DTI-derived structural connectivity patterns, and task-based fMRI derived co-activation patterns within this cluster (35 DICCCOLs) are shown the in red rectangles in the Supplemental Figs. 7b–7d, respectively. It is evident that the connectivity patterns are reasonably consistent across modalities, which cross-validate the soundness of connectivity in each individual modality.
Table 3.
The rank of functional domain description of networks in cluster #1.
| Behavioral domain | Number of networks | Behavioral domain | Number of networks |
|---|---|---|---|
| Action.execution | 40 | language | 10 |
| perception | 18 | memory | 6 |
| emotion | 11 | attention | 2 |
The second cluster contains 111 fMRI-derived functional networks (shown in Supplemental Fig. 8). Similarly, for each network, we searched its original fMRI experiment and the corresponding behavioral domains (listed in Table 4), and found that most of the landmarks are located in the regions of emotion and perception. Given that most of the landmarks are located in the cingulate gyri, superior frontal gyri, medial prefrontal cortex, and motor and sensory areas, the listed behavior domains (or functional networks) are quite reasonable given current literature reports. For instance, it was reported in Etkin et al., 2011 that the anterior cingulate and medial prefrontal cortex play important roles in emotion process. It was also reported in Keysers et al., 2010 that the premotor areas are important for perception, e.g., social perception, and it was reported in Pavuluri et al., 2009 that the prefrontal cortices (including the superior, middle, and inferior frontal gyri) are activated in emotion processing. Furthermore, the resting-state functional connectivity pattern, DTI-derived structural connectivity pattern, and task-based fMRI derived co-activation patterns within this cluster (47 DICCCOLs) are reasonably consistent, as shown in the yellow rectangles in the Supplemental Figs. 8b–8d. These results further demonstrated that the reported functional roles in literature fMRI studies in the BrainMap database have their anatomic, connectional and functional supports. In particular, the association of functional networks to the DICCCOLs provides the opportunity to examine brain networks from multiple perspectives, which is one of the major contributions of this paper.
Table 4.
The rank of functional domain description of the functional networks in cluster #2.
| Behavioral domain | Number of networks | Behavioral domain | Number of networks |
|---|---|---|---|
| Emotion | 43 | action | 10 |
| perception | 20 | attention | 4 |
| Memory | 18 | Cognition. Social | 2 |
| Language | 14 |
The cluster #3 contains 28 functional networks (shown in Supplemental Fig. 9). Similarly, we searched its original fMRI experiments and examined the corresponding behavioral domains for each network (listed in Table 5), and found that a majority of them are located in the region of memory, language and action. These results are consistent with current neuroscience knowledge and literature reports, e.g., quite a few DICCCOLs in cluster #3 (Supplemental Fig. 9) are located in the Wernicke’s area, which is a brain region involved in language understanding (Saur et al., 2008). For another example, the DICCCOL ID#256 labeled in Supplemental Fig. 9 was reported to be involved in the working memory network (Zhu et al., 2012; Faraco et al., 2011). Again, the resting state connectivity, DTI-derived structural connectivity, and task-based fMRI derived co-activation patterns within this cluster (25 DICCCOLs) are reasonably consistent, as shown in purplish red rectangles in Supplemental Figs. 9b–9d.
Table 5.
The rank of brain domain description of networks in cluster #3.
| Behavioral domain | Number of networks | Behavioral domain | Number of networks |
|---|---|---|---|
| memory | 10 | emotion | 4 |
| language | 5 | perception | 2 |
| action | 5 | attention | 2 |
Moreover, we plotted the cluster #5 that contains 111 functional networks Supplemental Fig. 10. For this cluster, a majority of functional networks are located in the region of action, as listed in Table 6. This result is reasonable, given the visualizations of the locations of the DICCCOLs in Supplemental Fig. 10 and a variety of literature papers (e.g., Meier et al., 2008; Brunner et al., 2009) reporting the functional roles of motor areas. Also, the functional networks in cluster #5 are involved in perception, which is consistent with literature papers (Keysers et al., 2010). Again, the resting state functional connectivity, DTI-derived structural connectivity, and task-based fMRI derived co-activation patterns within this cluster (51 DICCCOLs) are reasonably consistent, as shown in the purple rectangles in Supplemental Figs. 10b–10d.
Table 6.
The rank of functional domain description of networks in cluster #5.
| Behavioral domain | Number of networks | Behavioral domain | Number of networks |
|---|---|---|---|
| action | 48 | memory | 10 |
| perception | 18 | attention | 7 |
| emotion | 12 | Cognition | 4 |
| language | 12 |
Finally, we examined the cluster #8 that contains 127 functional networks (shown in Supplemental Fig. 11). The list of fMRI experiments and the corresponding behavioral domains are provided in Table 7. We found that most of them are located in the region of language, memory and perception, which is partly verified by the visualization in Supplemental Fig. 11. The result is in agreement with literature reports (Ferstl et al., 2008; Tesink et al., 2009) on the languages areas including the middle frontal gyrus, inferior frontal sulcus, precentral gyrus, and literature reports on visual perception (Ganis et al., 2004). Moreover, the resting state connectivity, DTI-derived structural connectivity, and fMRI-derived co-activation patterns within this cluster (53 DICCCOLs) are reasonably consistent, as shown in the pink rectangles in the Supplemental Figs. 11b–11d.
Table 7.
The rank of functional domain description of networks in cluster #8.
| Behavioral domain | Number of networks | Behavioral domain | Number of networks |
|---|---|---|---|
| language | 34 | action | 10 |
| memory | 26 | attention | 13 |
| perception | 22 | cognition | 8 |
| emotion | 14 |
4. DISCUSSION AND CONCLUSION
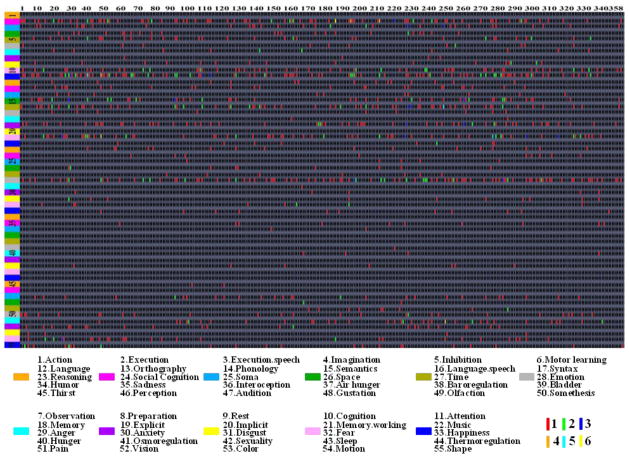
This paper focused on the examination of the potential functional roles of 358 DICCCOL landmarks by taking the advantage of existing extensive literature fMRI studies (1110 publications) reported and aggregated in the BrainMap database. Through landmark-based analysis, our results demonstrated that a majority of 358 DICCCOLs can be functionally annotated by the BrainMap database, and many DICCCOLs exhibited very rich and diverse functional roles in multiple behavioral domains. The major findings of this meta-analysis of functional roles of DICCCOLs are summarized in Fig. 14. Furthermore, based on the network-based analysis, we represented the co-activation patterns of the 1110 fMRI experiments within the DICCCOLs system, and then performed multi-view clustering of them together with DTI-derived structural and R-fMRI-derived resting state networks. The major result of this paper demonstrated the close relationships among landmark anatomy, connection and function and suggested the possibility of deriving consistent sub-networks across multiple modalities and populations.
Fig. 14.
The summary of the meta-analysis of functional roles of DICCCOLs in the BrainMap database. Each column represents BrainMap-reported fMRI activations and associated behavioral domains for each DICCCOL landmark, and each row stands for DICCCOL landmarks that are involved in the same behavioral domain. The 55 BrainMap behavioral domains are represented by nine different colors as shown in the bottom panel. The same DICCCOL landmark might be involved in the same functional network reported by multiple literature papers, represented by red (1), green (2), blue (3), orange (4), Cyan (5) and yellow (6) colors in the grid, respectively. The anatomical locations of the 358 DICCCOLs are referred to Fig. 5 and Supplemental Table 7.
Representation and characterization of brain function is challenging. This work explored the possibility of using structural connectivity landmarks to encode and represent functional activations reported in the BrainMap database, which is considered as an alternative approach to the traditional stereotaxic coordinate based representation of brain functions. From the conceptual level, group-wise structural connectivity patterns derived from DTI data are predictive of brain functions (Li et al., 2010; Zhu et al., 2011; Zhu et al., 2012; Zhang et al., 2011; Li et al., 2012; Li et al., 2012b), and in particular, the DICCCOLs based on consistent structural connectivity patterns are reproducible and predictive in each individual’s brain (Zhu et al., 2012, Li et al., 2012). Therefore, consistent and common DICCCOLs that are localized directly in each subject’s image space and thus avoid the possible image registration errors (Fig. 3) possess both theoretical and practical superiorities to encode and represent brain functions, in comparison with the traditional stereotaxic coordinate based approaches that heavily rely on image registration approaches.
However, the current study has been limited by several factors. First, the spatial coverage of the current DICCCOL system is still limited. That is, it is hard to use 358 DICCCOLs to cover the whole cerebral cortex, e.g., some reported fMRI activation foci in the BrainMap database cannot find corresponding DICCCOLs as shown by the blue spheres in Supplemental Fig. 4. In the future, we could possible substantially increase the density and coverage of the current DICCCOL system by integrating better landmark initialization and optimization approaches. As a result, the spatial resolution and coverage of the meta-analysis in this paper can be further improved. Second, the meta-analysis in this work has been dependent on the registration of structural MRI images and the MNI atlas. Though we tried and used state-of-the-art image registration algorithms such as the FNIRT, ANTS and HAMMER, the spatial warping accuracy is still limited. In the future, we plan to collaborate with other functional neuroimaging labs to employ large-scale multimodal DTI and fMRI datasets to expand our current meta-analysis. That is, DICCCOLs will be predicted in the different DTI datasets and coincident fMRI-derived activation foci will be employed to independently annotate and validate the functional roles of DICCCOLs (Zhu et al., 2012). It is expected that the usage of multimodal DTI/fMRI data will substantially increase the capacity of meta-analysis of functional roles of DICCCOLs, and can cross-validate the obtained results reported in this paper.
Finally, we believe that the public releases of the DICCCOL system (Zhu et al., 2012) and the meta-analysis results of possible functional roles of DICCCOLs achieved in this paper will facilitate neuroimaging researchers to further investigate the structures and functions of the cerebral cortex, as well as their relationships. For instance, our meta-analysis results of DICCCOLs can be evaluated and cross-validated by separate research groups via different fMRI datasets (e.g., Nielsen, 2003) and various analysis methodologies (e.g., Costafreda, 2009; Poldrack et al., 2011). We believe that the availability of such a common and robust platform that enables neuroimaging researchers to integrate, exchange, cross-validate and interpret various neuroimaging datasets and analysis methods is essential for studying the functions of the brain in the future.
Supplementary Material
Acknowledgments
T Liu was supported by the NIH Career Award (NIH EB 006878), NIH R01 HL087923-03S2, NIH R01 DA033393, and The University of Georgia start-up research funding. The functional meta-analysis was performed on the BrainMap database. The authors would like to thank the anonymous reviewers for their constructive comments and suggestions.
Footnotes
Information Sharing Statement
The meta-analysis results are available at: http://www.cs.uga.edu/~tliu/Supplemental_Table_1.xlsx. The DICCCOL system is already released at: http://dicccol.cs.uga.edu.
References
- Andersson J, Smith S, Jenkinson M. FNIRT - FMRIB’s Non-linear Image Registration Tool. In 14th Annual Meeting of the Organisation for Human Brain Mapping; 2008. [Google Scholar]
- Ashburner J, Csernansky JG, Davatzikos C, Fox NC, Frisoni GB, Thompson PM. Computer-assisted imaging to assess brain structure in healthy and diseased brains. The Lancet (Neurology) 2003;2:79–88. doi: 10.1016/s1474-4422(03)00304-1. [DOI] [PubMed] [Google Scholar]
- Avants BB, Epstein CL, Grossman M, Gee JC. Symmetric diffeomorphic image registration with cross-correlation: evaluating automated labeling of elderly and neurodegenerative brain. Medical Image Analysis. 2008;12:26–41. doi: 10.1016/j.media.2007.06.004. [DOI] [PMC free article] [PubMed] [Google Scholar]
- Bisley JW, Pasternak T. The multiple roles of visual cortical areas MT/MST in remembering the direction of visual motion. Cereb Cortex. 2000;10:1053–1065. doi: 10.1093/cercor/10.11.1053. [DOI] [PubMed] [Google Scholar]
- Brunner P, Ritaccio AL, Lynch TM, Emrich JF, Wilson JA, Williams JC, Aarnoutse EJ, Ramsey NF, Leuthardt EC, Bischof H, Schalk G. A practical procedure for real-time functional mapping of eloquent cortex using electrocorticographic signals in humans. Epilepsy Behav. 2009 Jul;15(3):278–86. doi: 10.1016/j.yebeh.2009.04.001. [DOI] [PMC free article] [PubMed] [Google Scholar]
- Bullmore Ed, Sporns Olaf. Complex brain networks: graph theoretical analysis of structural and functional systems. Nature Neuroscience Reviews. 2009 Mar;186(10) doi: 10.1038/nrn2575. [DOI] [PubMed] [Google Scholar]
- Chen Hanbo, Li Kaiming, Zhu Dajiang, Zhang Tuo, Jin Changfeng, Guo Lei, Li Lingjiang, Liu Tianming. MICCAI. 2012. Inferring Group-wise Consistent Multimodal Brain Networks via Multi-view Spectral Clustering. in press. [DOI] [PubMed] [Google Scholar]
- Collins DL, Neelin P, Peters TM, Evans AC. Automatic 3D inter-subject registration of MR volumetric data in standardized Talairach space. Journal of Computer Assisted Tomography. 1994;18(2):192–205. [PubMed] [Google Scholar]
- Costafreda SG. Pooling fMRI data: meta-analysis mega-analysis and multi-center studies. Front, Neuroinformatics. 2009;3:33. doi: 10.3389/neuro.11.033.2009. [DOI] [PMC free article] [PubMed] [Google Scholar]
- Davatzikos C. Spatial transformation and registration of brain images using elastically deformable models. Comput Vision Image Understand. 1997;66(2):207–222. doi: 10.1006/cviu.1997.0605. [DOI] [PubMed] [Google Scholar]
- Davatzikos C. Why voxel-based morphometric analysis should be used with great caution when characterizing group differences. Neuroimage. 2004;23:17–20. doi: 10.1016/j.neuroimage.2004.05.010. [DOI] [PubMed] [Google Scholar]
- Derrfuss J, Mar RA. Lost in localization: The need for a universal coordinate database. NeuroImage. 2009;48(1):1–7. doi: 10.1016/j.neuroimage.2009.01.053. [DOI] [PubMed] [Google Scholar]
- Diedrichsen J, Hashambhoy Y, Rane T, Shadmehr R. Neural correlates of reach errors. Journal of Neuroscience. 2005;25:9919–9931. doi: 10.1523/JNEUROSCI.1874-05.2005. [DOI] [PMC free article] [PubMed] [Google Scholar]
- Etkin A, Egner T, Kalisch R. Emotional processing in anterior cingulate and medial prefrontal cortex. Trends in Cognitive Sciences. 2011;15(2) doi: 10.1016/j.tics.2010.11.004. [DOI] [PMC free article] [PubMed] [Google Scholar]
- Fan Y, Batmanghelich N, Clark CM, Davatzikos C. Spatial patterns of brain atrophy in MCI patients, identified via high-dimensional pattern classification, predict subsequent cognitive decline. Neuroimage. 2008;39(4):1731–1743. doi: 10.1016/j.neuroimage.2007.10.031. [DOI] [PMC free article] [PubMed] [Google Scholar]
- Faraco CC, Unsworth N, Langley J, Terry D, Li K, Zhang D, Liu T, Miller LS. Complex span tasks and hippocampal recruitment during working memory. NeuroImage. 2011;55(2):773–787. doi: 10.1016/j.neuroimage.2010.12.033. [DOI] [PubMed] [Google Scholar]
- Ferstl EC, Neumann J, Bogler C, von Cramon DY. The extended language network: a meta-analysis of neuroimaging studies on text comprehension. Hum Brain Mapp. 2008 May;29(5):581–93. doi: 10.1002/hbm.20422. [DOI] [PMC free article] [PubMed] [Google Scholar]
- Fischera MH, Zwaan RA. Embodied language: A review of the role of the motor system in language comprehension. The Quarterly Journal of Experimental Psychology. 2008;61(6):825–850. doi: 10.1080/17470210701623605. [DOI] [PubMed] [Google Scholar]
- Fischl B, Salat DH, Busa E, Albert M. Whole brain segmentation: automated labeling of neuroanatomical structures in the human brain. Neuron. 2002;33(3):341–355. doi: 10.1016/s0896-6273(02)00569-x. [DOI] [PubMed] [Google Scholar]
- Fogassi L, Ferrari PF, Gesierich B, Rozzi S, Chersi F, Rizzolatti G. Parietal Lobe: From Action Organization to Intention Understanding. Science. 2005;308 (5722):662–667. doi: 10.1126/science.1106138. [DOI] [PubMed] [Google Scholar]
- Hamilton AF. Lost in localization: A minimal middle way. Neuroimage. 2009;48:8–10. doi: 10.1016/j.neuroimage.2009.05.007. [DOI] [PubMed] [Google Scholar]
- Ganis G, Thompson WL, Kosslyn SM. Brain areas underlying visual mental imagery and visual perception: an fMRI study. Brain Res Cogn Brain Res. 2004 Jul;20(2):226–41. doi: 10.1016/j.cogbrainres.2004.02.012. [DOI] [PubMed] [Google Scholar]
- Gazzola V, Keysers C. The Observation and Execution of Actions Share Motor and Somatosensory Voxels in all Tested Subjects: Single-Subject Analyses of Unsmoothed fMRI Data. Cereb Cortex. 2009;19(6):1239–1255. doi: 10.1093/cercor/bhn181. [DOI] [PMC free article] [PubMed] [Google Scholar]
- Jenkinson M, Smith SM. A global optimisation method for robust affine registration of brainimages. Medical Image Analysis. 2001;5(2):143–156. doi: 10.1016/s1361-8415(01)00036-6. [DOI] [PubMed] [Google Scholar]
- Kumar A, Daume H. A Co-training Approach for Multi-view Spectral Clustering. International Conference on Machine Learning (ICML); 2011. [Google Scholar]
- Laird AR, Lancaster JL, Fox PT. BrainMap: the social evolution of a human brain mapping database. Neuroinformatics. 2005;3:65–78. doi: 10.1385/ni:3:1:065. [DOI] [PubMed] [Google Scholar]
- Laird AR, Eickhoff SB, Kurth F, Fox PM, Uecker AM, Turner JA, Robinson JL, Lancaster JL, Fox PT. ALE meta-analysis workflows via the BrainMap database: Progress towards a probabilistic functional brain atlas. Neuroinformatics. 2009;3(23):11. doi: 10.3389/neuro.11.023.2009. [DOI] [PMC free article] [PubMed] [Google Scholar]
- Laird AR, Fox PM, Eickhoff SB, Turner JA, Ray KL, McKay DR, Glahn DC, Beckmann CF, Smith SM, Fox PT. Behavioral interpretations of intrinsic connectivity networks. J Cogn Neurosci. 2011 Dec;23(12):4022–37. doi: 10.1162/jocn_a_00077. [DOI] [PMC free article] [PubMed] [Google Scholar]
- Lalonde J, Chaudhuri A. Task-dependent transfer of perceptual to memory representations during delayed spatial frequency discrimination. Vision Research. 2002;42(14):1759–1769. doi: 10.1016/s0042-6989(02)00111-6. [DOI] [PubMed] [Google Scholar]
- Lao Z, Shen D, Xue Z, Bilge K, Resnick SM, Davatzikos C. Morphological classification of brains via high-dimensional shape transformations and machine learning methods. NeuroImage. 2004;21(1):46–57. doi: 10.1016/j.neuroimage.2003.09.027. [DOI] [PubMed] [Google Scholar]
- Li K, Guo L, Faraco CC, Zhu D, Deng F, Zhang T, et al. Neural Information Processing Systems (NIPS) 2010. Individualized ROI Optimization via Maximization of Group-wise Consistency of Structural and Functional Profiles. [Google Scholar]
- Li K, Guo L, Zhu D, Hu X, Han J, Liu T. Individual Functional ROI Optimization via Maximization of Group-wise Consistency of Structural and Functional Profiles. Neuroinformatics. 2012 doi: 10.1007/s12021-012-9142-5. in press. [DOI] [PMC free article] [PubMed] [Google Scholar]
- Li K, Zhu D, Guo L, Li Z, Lynch ME, Coles C, Hu X, Liu T. Connectomics Signatures of Prenatal Cocaine Exposure Affected Adolescent Brains. Human Brain Mapping. 2012 doi: 10.1002/hbm.22082. accepted. [DOI] [PMC free article] [PubMed] [Google Scholar]
- Li K, Guo L, Faraco C, Zhu D, Chen H, Yuan Y, Lv J, Deng F, Jiang X, Zhang T, Hu X, Zhang D, Miller L, Liu T. Visual Analytics of Brain Networks. NeuroImage. 2012 doi: 10.1016/j.neuroimage.2012.02.075. accepted. [DOI] [PMC free article] [PubMed] [Google Scholar]
- Liu T, Shen Di, Davatzikos C. Predictive modeling of anatomic structures using canonical correlation analysis. International Symposium on Biomedical Imaging (ISBI); 2004. [Google Scholar]
- Keysers C, Kaas JH, Gazzola V. Somatosensation in social perception. Nature Reviews Neuroscience. 2010;11:417. doi: 10.1038/nrn2833. [DOI] [PubMed] [Google Scholar]
- Meier JD, Aflalo TN, Kastner S, Graziano MS. Complex Organization of Human Primary Motor Cortex: A High-Resolution fMRI Study. J Neurophysiol. 2008;100:1800–1812. doi: 10.1152/jn.90531.2008. [DOI] [PMC free article] [PubMed] [Google Scholar]
- Nielsen FA. The Brede database: a small database for functional neuroimaging. NeuroImage. 2003;19(2) [Google Scholar]
- Passingham RE, Stephan KE, Kötter R. The anatomical basis of functional localization in the cortex. Nat Rev Neurosci. 2002;3(8):606–16. doi: 10.1038/nrn893. [DOI] [PubMed] [Google Scholar]
- Pavuluri MN, Passarotti AM, Harral EM, Sweeney JA. An fMRI study of the neural correlates of incidental versus directed emotion processing in pediatric bipolar disorder. J Am Acad Child Adolesc Psychiatry. 2009 Mar;48(3):308–19. doi: 10.1097/CHI.0b013e3181948fc7. [DOI] [PMC free article] [PubMed] [Google Scholar]
- Poldrack RA, Kittur A, Kalar D, Miller E, Seppa C, Gil Y, Parker DS, Sabb FW, Bilder RM. The cognitive atlas: toward a knowledge foundation for cognitive neuroscience. Front Neuroinform. 2011;5:17. doi: 10.3389/fninf.2011.00017. [DOI] [PMC free article] [PubMed] [Google Scholar]
- Saur D, Kreher BW, Schnell S, Kummerer D, Kellmeyer P, Vry M, Umarova R, Musso M, Glauche V, Abel S, Huber W, Rijntjes M, Hennig J, Weiller C. Ventral and dorsal pathways for language. Proceedings of the National Academies of Science of the USA. 2008;105 (46):18035–18040. doi: 10.1073/pnas.0805234105. [DOI] [PMC free article] [PubMed] [Google Scholar]
- Shen D, Davatzikos C. HAMMER: hierarchical attribute matching mechanism for elastic registration. IEEE Trans on Medical Imaging. 2002;21(11):1421–1439. doi: 10.1109/TMI.2002.803111. [DOI] [PubMed] [Google Scholar]
- Tesink CM, Petersson KM, van Berkum JJ, van den Brink D, Buitelaar JK, Hagoort P. Unification of speaker and meaning in language comprehension: an FMRI study. J Cogn Neurosci. 2009 Nov;21(11):2085–99. doi: 10.1162/jocn.2008.21161. [DOI] [PubMed] [Google Scholar]
- Thompson PM, Toga AW. A surface-based technique for 1336 warping 3-dimensional images of the brain. IEEE Trans Med Imag. 1996;1337, 15(4):1–16. doi: 10.1109/42.511745. [DOI] [PubMed] [Google Scholar]
- Toro R, Fox PT, Paus T. Functional Coactivation Map of the Human Brain. Cerebral Cortex. 2008;18:2553–2559. doi: 10.1093/cercor/bhn014. [DOI] [PMC free article] [PubMed] [Google Scholar]
- Van Essen DC, Dierker DL. Surface-Based and Probabilistic Atlases of Primate Cerebral Cortex. Neuron. 2007;56(2):209–25. doi: 10.1016/j.neuron.2007.10.015. [DOI] [PubMed] [Google Scholar]
- Wu G, Jia H, Wang Q, Shen D. SharpMean: Groupwise registration guided by sharp mean image and tree-based registration. NeuroImage. 2011;56(4):1968–1981. doi: 10.1016/j.neuroimage.2011.03.050. [DOI] [PMC free article] [PubMed] [Google Scholar]
- Zaksas D, Pasternak TJ. Directional signals in the prefrontal cortex and in area MT during a working memory for visual motion task. Neuroscience. 2006;26(45):11726–42. doi: 10.1523/JNEUROSCI.3420-06.2006. [DOI] [PMC free article] [PubMed] [Google Scholar]
- Zhang T, Guo L, Li K, Jing C, Yin Y, Zhu D, Cui G, Li L, Liu T. Predicting functional cortical ROIs based on fiber shape models. Cerebral Cortex. 2011;22(4):854–864. doi: 10.1093/cercor/bhr152. [DOI] [PMC free article] [PubMed] [Google Scholar]
- Zhu D, Li K, Faraco CC, Deng F, Zhang D, Guo L, et al. Optimization of functional brain ROIs via maximization of consistency of structural connectivity profiles. NeuroImage. 2011;59(2):1382–93. doi: 10.1016/j.neuroimage.2011.08.037. [DOI] [PMC free article] [PubMed] [Google Scholar]
- Zhu D, Li K, Guo L, Jiang X, Zhang T, Zhang D, Chen H, Deng F, Faraco C, Jin C, Wee CY, Yuan Y, Lv P, Yin Y, Hu X, Duan L, Hu X, Han J, Wang L, Shen D, Miller LS, Li L, Liu T. DICCCOL: Dense Individualized and Common Connectivity-based Cortical Landmarks. Cerebral Cortex. 2012 doi: 10.1093/cercor/bhs072. accepted. [DOI] [PMC free article] [PubMed] [Google Scholar]
- Zilles K, Amunts K. Centenary of Brodmann’s map-conception and fate. Nature Reviews Neuroscience. 2009;11:139. doi: 10.1038/nrn2776. [DOI] [PubMed] [Google Scholar]
Associated Data
This section collects any data citations, data availability statements, or supplementary materials included in this article.


