Abstract
Red blood cells (RBCs) attract significant interest as carriers of biomolecules, drugs and nanoparticles. In this regard, versatile technologies to attach molecules and ligands to the RBC surface are of great importance. Reported here is a fast and efficient surface painting strategy to attach ligands to the surface of RBCs, and the factors that control the stability and circulation properties of the modified RBCs in vivo. Distearoyl phosphatidylethanolamine anchor-conjugated immunoglobulin (IgG) efficiently incorporates in the RBC membrane following 15–30 min incubation. The optimized RBCs show prolonged circulation in vivo (70% of the injected dose after 48h) and efficient retention of IgG in the membrane with terminal half-life of 73 hours. The IgG construct is gradually lost from the RBCs mainly due to the transfer to plasma components, liver endothelial cells and Kupffer cells. The ligand retention efficiency is partially dictated by ligand type, anchor type, and ligand concentration in the membrane, while RBC half-life is determined by initial concentration of the ligand in the membrane and presence of PEG linker between the ligand and the anchor. This work provides important guidance for non-covalent surface painting of RBCs as well as other types of blood borne cells for in vivo therapeutic and targeting applications.
Keywords: erythrocytes, painting, anchor, circulation, targeting
1. Introduction
Red blood cells (RBCs) have been historically used for blood transfusion in emergency medicine. Due to long-circulating properties and biocompatibility, RBCs are now actively being explored for delivery of genes, chemotherapy, contrast agents and enzymes. [1, 2] Recently, RGD (Arg-Gly-Asp) peptide-modified RBCs [3] and sickle cells [4] have been shown to bind and obstruct tumor blood vessels, causing infarction and tumor shrinkage. Many of the therapeutic applications of RBCs require surface attachment of therapeutic enzymes (e.g., tissue plasminogen activator) or targeting ligands (antibodies, aptamers, peptides). Such attachment have been accomplished either through binding to defined membrane proteins, e.g., via anti-complement receptor CR1 antibody [5] or anti-glycophorin A antibody, [2] or through non-specific chemical conjugation to membrane proteins using biotin-avidin [2] and heterobifunctional chemistry. [3] Some of these modifications are difficult to scale up and control, and could result in the damage to integral membrane proteins. Damaged RBCs are rapidly sequestered by the immune system, mostly Kupffer macrophages and marginal zone macrophages in the spleen. [6]
Membrane painting is a simple and practical method for incorporation of biomolecules on the cell surface, mimicking the natural mechanism of anchorage of proteins to plasma membrane via palmitoyl, myristoyl or glycosylphosphatidylinositol (GPI) anchors. [7] In the cell painting approach, a lipophilic derivative of a molecule of interest is extraneously added to cells and quickly becomes anchored in the cell membrane. GPI anchors are the most extensively tested approach for cell painting and have been successfully utilized for reconstituting functional receptors on the cells surface. [8, 9] Unfortunately, GPI anchored proteins, when inserted into the RBC membrane, showed rapid transfer to other lipophilic structures, including RBCs, [10] endothelial cells, [8] parasites [11] and lipoproteins. [12] Triton extraction experiments suggested that extraneously added GPI anchored proteins do not incorporate into lipid rafts of cells. [13] This instability makes this approach problematic for in vivo therapeutic applications, wherein cells are supposed to circulate for prolonged periods of time and to retain therapeutic/targeting molecules on the surface. In addition, genetically engineered GPI-anchored proteins are difficult to manufacture and purify. [9] As an alternative to GPI anchors, constructs utilizing lipoprotein fragment [14] and dioleoyl phosphatidylethanolamine [15] have been tested. These extraneously added anchors have been able to add functional molecules to the cell surface, [14] but were also shed from cells within few hours of incubation in cell medium.
For the purpose of development of surface-painted RBCs for in vivo therapeutic applications (for example antibody-targeted RBCs), we set out to optimize surface painting of RBCs for membrane retention and long-circulating properties in vivo. Classical liposomal studies suggest that distearoyl (C18) based lipids show optimal retention in liposomes in vivo, [16] while other studies suggested that lipid transfer between liposomes and erythrocytes is dramatically reduced with the increase in lipid chain length. [17] As model ligands, we used full immunoglobulin (IgG) and fluorescein (FITC). The advantage of the selected molecules is that they both could be quantified with flow cytometry. In addition, the data regarding IgG and FITC could be extrapolated to other ligands. Our data suggest that DSPE-PEG3400-conjugated IgG is well retained in the RBC membrane in vitro and in vivo with terminal half-life of over 3 days. The loss of the anchor in vivo occurs primarily due to the lipid transfer to blood components, liver endothelial cells and Kupffer cells. The data provide strategies for the design of long-circulating, ligand-modified RBCs and other cells as carriers for targeted therapeutics.
2. Results
2.1. Lipid-antibody construct synthesis and RBC painting
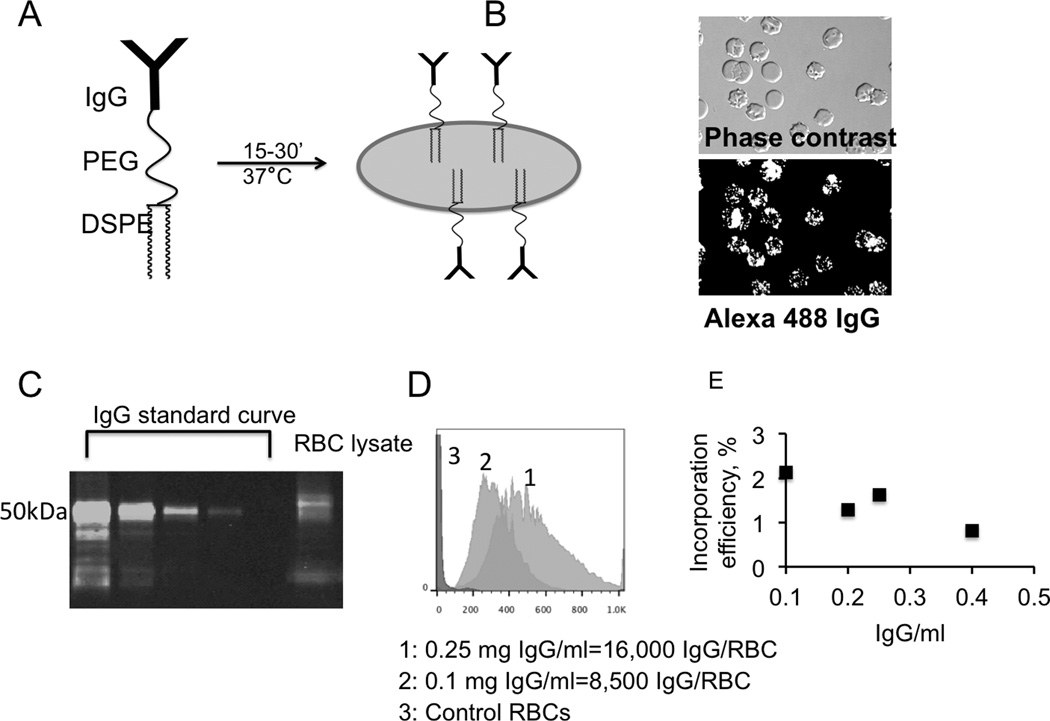
We set out to optimize ligand retention and circulation properties of surface-painted RBCs in vivo. As a starting approach, we decided to use distearoyl phosphatidylethanolamine, since (a) in previous studies using liposomes, distearoyl phosphatidylethanolamine showed the lowest level of exchange, [16] and (b) RBC membrane lipids consist of predominantly C18 acyl chains. [18] Mouse whole IgG molecules were modified with 1–2 thiol groups using Traut’s reagent, and the thiolated IgG was clicked to DSPE-PEG3400-maleimide via Michael addition. MALTI-TOF analysis showed the mass around 154,000 Da of the conjugate (Supplemental Figure S1), suggesting that each IgG contained on average one DSPE-PEG3400 anchor. Washed mouse RBCs were incubated for 15–30 min at 37°C with DSPE-PEG-IgG (Figure 1A). The incubation resulted in the efficient incorporation of IgG molecules in the membrane (as detected by secondary Alexa 488-labeled antibody (Figure 1B). Most of RBCs were either echinocytes or spherocytes (Figure 1B), but were restored to normocytes after incubation in mouse plasma (not shown). Despite the fact that RBCs have low-affinity receptors for IgG [19], no significant binding of non-lipid IgG to RBCs was observed (not shown). Interestingly, the staining of the membrane was punctuated, possibly due to the lateral diffusion and segregation of IgG molecules. DSPE-PEG-IgG incorporation efficiency was analyzed with immunoblotting using standard dilutions of IgG (Figure 1C and Supplemental Figure S2). For example, at 0.1 and 0.25mg IgG/ml concentrations during the incubation, 8,500 and 16,000 IgG molecules became attached to each RBC, respectively. Flow cytometry analysis of IgG painted RBCs showed correlation between IgG density and FL-1 fluorescence (Figure 1D). For subsequent experiments, we used FL-1 fluorescence (that was calibrated before each experiment to verify consistency) to estimate IgG levels on RBCs. IgG Incorporation efficiency was around 2% at 0.1 mg/ml IgG and somewhat decreased with higher incubation concentrations (Figure 1E).
Fig. 1. Surface painting and characterization of red blood cells.
A, DSPE-PEG-IgG was synthesized as described in Methods. The construct was incubated with washed mouse RBCs in order to be incorporated into the RBC membrane; B, The incorporated IgG was detected with Alexa 488 labeled anti-mouse IgG. The antibody forms punctuate label on the RBC surface; C, DSPE-PEG-IgG was quantified with western blotting. Purified mouse IgG was used for calibration curve. Painted RBCs were lysed and loaded on the gel. RBC lysate shows incorporation of the construct. Note that IgG construct shows a retardation in the gel as compared to native IgG heavy chain (50 kDa); D, Amount of incorporated IgG vs. FL-1 fluorescence by flow cytometry; E, Incorporation efficiency as a function of IgG concentration. Note a decrease in the percentage of incorporated IgG with the increase in DSPE-PEG-IgG concentration during incubation.
2.2. In vivo retention and biodistribution of DSPE-PEG-IgG
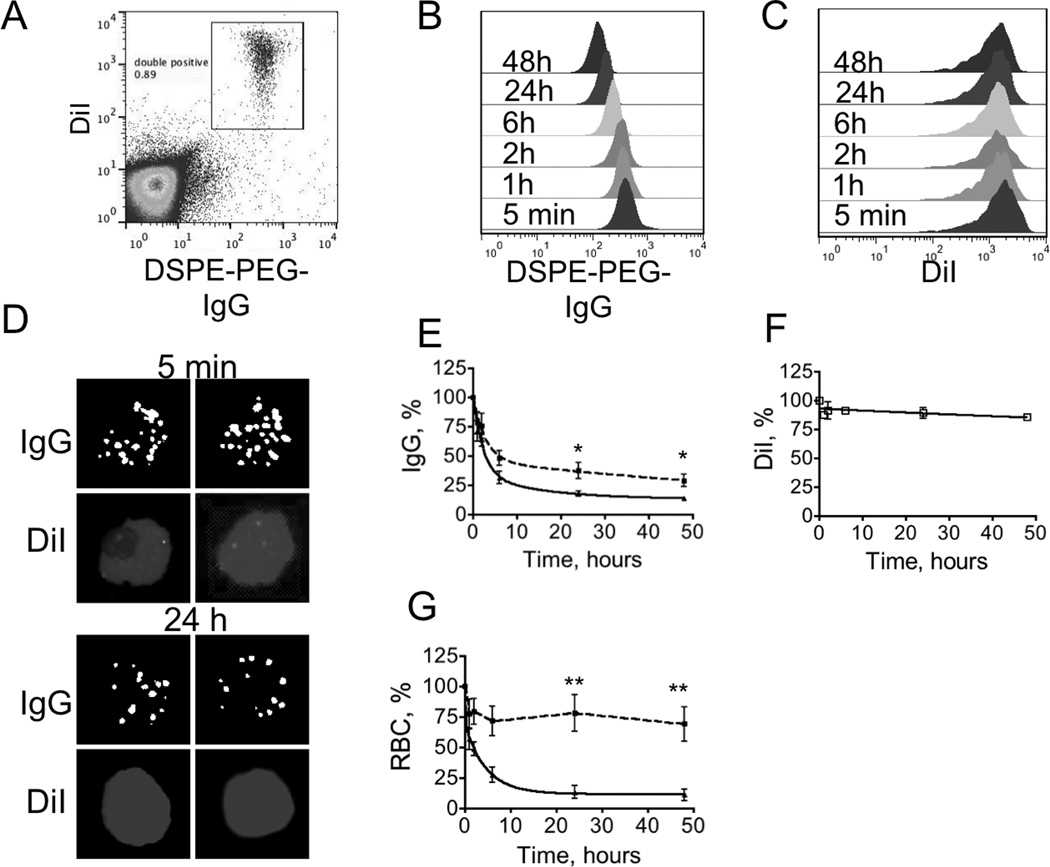
In order to test the stability and circulation properties of DSPE-PEG-IgG painted RBCs, we painted RBCs with lipophilic cyanine dye DiI and with approximately 10,000 IgG/RBC. This double painting allowed monitoring of RBCs independently of the IgG label. Blood samples were collected at various times and stained with secondary antibody to detect IgG on the cell surface. Painted RBCs could be distinguished from non-labeled RBCs as a distinct double-labeled population in the upper right quadrant (Figure 2A). There was a decrease in the level of IgG fluorescence over 48 h, judging by the shift in the FL-1 histogram (Figure 2B, dot-plot data in Supplemental Figure S3). At the same time, DiI did not show any decrease in levels on RBCs over 48h (Figure 2C). The microscopy images of RBCs in peripheral blood showed presence of both IgG and DiI at 24 h, albeit IgG fluorescence was somewhat decreased in the 24 h sample (Figure 2D). We tested the effect of IgG initial level on the retention and RBC circulation. It is challenging to prepare RBCs with known absolute IgG content, therefore we used FL-1 fluorescence before injection as an relative parameter to compare IgG content. Two groups of RBC fluorescence were used: with average FL-1 of 294±109 (n=4), and average FL-1 of 1111±208 (n=4). These levels of fluorescence approximately correspond to 8,000 IgG/RBC and 30,000 IgG/RBC, respectively. According to Figure 2E, the stability of the ligand in the membrane was dependent on the initial IgG level. At 48 h post-injection, “low IgG” RBCs contained 38% IgG, whereas “high IgG” RBCs contained only 14% IgG. The levels of IgG were fit into bi-exponential decay curve. For “low IgG” RBCs, the terminal half-life of IgG in the membrane was 74.4 h, for “high IgG” the terminal half-life was 10.4 h. DiI was much more stable, with over 80% of the ligand in the RBC membrane at 48 h post-injection (Figure 2F). RBC circulating levels also significantly depended on the initial IgG concentration. For “low IgG” painted RBCs the level at 48h was 69%, whereas for “high IgG” painted RBCs, the level at 48h was 11%.
Fig. 2. In vivo stability of surface painted RBCs.
RBCs were painted with DiI and DSPE-PEG-IgG. Presence of DiI enabled to monitor RBCs independently of IgG. DSPE-PEG-IgG/DiI painted RBCs were injected into mice and the presence of the ligand was analyzed in blood samples taken at different times post-injection (after detecting IgG on RBCs with secondary antibody). A, Flow cytometry dot-plot of the injected RBCs. Double painted RBCs were easily distinguishable from majority of unlabeled cells; B, IgG FL-1 channel histogram shows significant shift at 24 h and 48h, suggesting gradual loss of IgG from the membrane; C, DiI fluorescence appears to be stable over the same time period; D, examples of individual double painted stained RBCs in the blood smear 5 min and 24 h post-injection. Contrast and brightness of all images were adjusted to the same degree; E, RBCs were prepared with different levels of DSPE-PEG-IgG painting (dotted trace–“low IgG”; solid trace–“high IgG”, see Result section). The clearance curve was fitted into bi-exponential decay with Prism software. There was significantly more retained IgG in case of “low IgG” painted RBCs (p-value 0.03, n=4, two-sided t-test). Low-IgG had a terminal half-life in the membrane of 74h; F, DiI on the same RBCs shows remarkable stability over time. DiI clearance could not be fitted into the exponential curve therefore connecting line is shown instead; G, RBC clearance is much lower for “low IgG” painted RBCs (dotted trace) than for “high IgG” painted RBCs (solid trace) (p-value 0.006, n=4, two-sided t-test).
2.3. Mechanisms of removal of DSPE-PEG-IgG
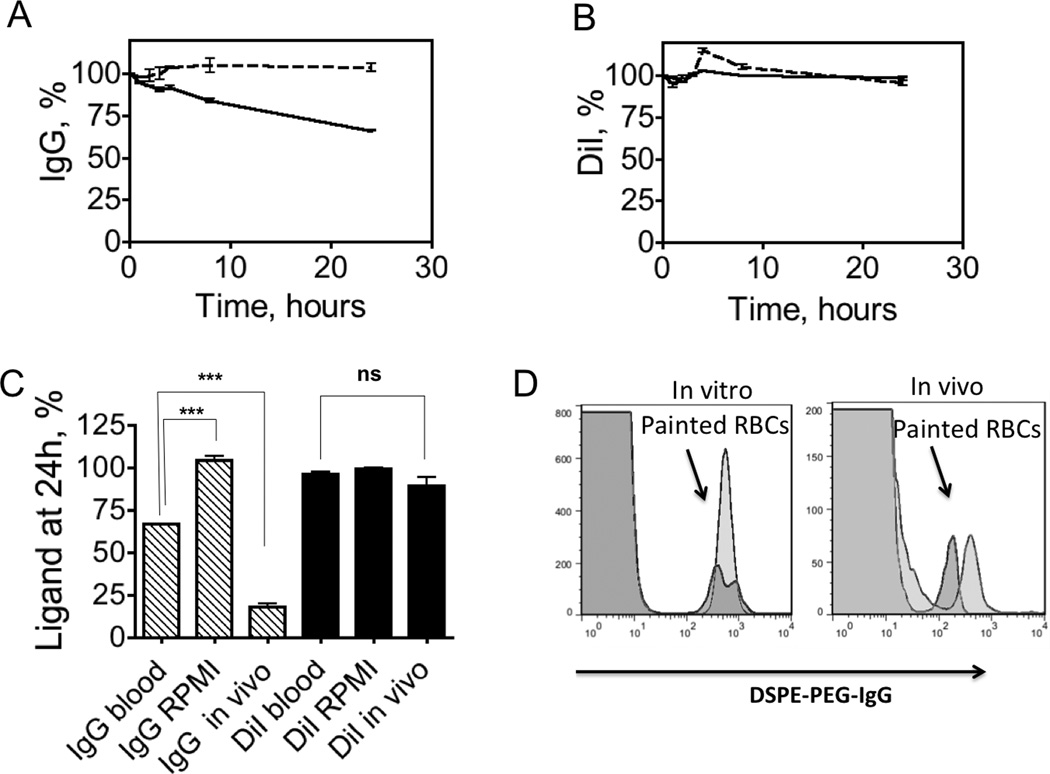
The data above suggest that surface-painted RBCs undergo several (independent) processes in vivo: (a) loss of DSPE-PEG-IgG; (b) loss (minimal) of DiI; (c) clearance of RBCs from circulation. We questioned the mechanisms of loss of DSPE-PEG-IgG from the RBC membrane [12]. In order to understand the contribution of lipid transfer to blood components in the IgG removal, we performed incubation studies in vitro. RBCs painted with DiI and with DSPE-PEG-IgG (FL-1=600, or approximately 18,000 IgG/RBC) were incubated under mixing in 10% FBS supplemented RPMI medium or in whole mouse blood at 37°C. The ligand retention over time was measured with flow cytometry as described for in vivo studies (flow cytometry data in Supplemental Figure S4). According to Figure 3A, IgG level did not change significantly in FBS/RPMI medium over 24h. However, when RBCs were incubated in blood, there was significant decrease in the IgG level (Figure 3A, black trace). DiI fluorescence was stable during the incubation in both medium and blood (Figure 3B). The fluorescence changes of a triplicate experiment at 24 h are summarized in Figure 3C. Comparison of levels of IgG in vitro (Figure 3C) showed that IgG levels were significant lower in blood than in RPMI (66% vs. 104%, n=3, p-value <0.001), suggesting that around 37% of the construct could be lost due to the transfer to other blood cells or to plasma components. However, the levels of IgG dropped more significantly after injection than after incubation in blood (18% vs. 66%, n=3, p-value <0.001), suggesting that non-specific lipid transfer to blood cells or plasma factors only partially explains IgG removal in vivo. Of note, DiI showed no significant loss from RBC membrane in vitro and in vivo (Figure 3C, red bars).
Fig. 3. In vitro vs. in vivo stability of surface painted RBCs.
RBCs were double painted as in Fig. 2 (“high IgG” painting) and stability of DSPE-PEG-IgG/DiI was monitored with flow cytometry (Supplemental Fig. S4). A, Stability of IgG and after incubation in full medium (dotted trace) and whole blood (solid trace). IgG levels are stable in medium, but less stable in whole blood over 24h incubation period; B, Stability DiI after incubation in medium (dotted trace) and full mouse blood (solid trace); C, Summary of IgG fluorescence and DiI fluorescence loss at 24h. Some IgG is lost in vitro due to exchange with blood components judging by the significant difference between ROMI and blood incubation levels (p-value<0.001, n=3, two-sided t-test). In vivo specific loss contributes significantly since there is a difference between IgG levels in blood in vitro and in vivo (p-value<0.001, n=3, two-sided t-test); D, Flow cytometry histograms of DSPE-PEG-IgG levels on RBCs in blood in vitro (left) and in vivo (right). Red trace is 5 min post-incubation (injection), blue trace is 24h post-incubation (injection). The histogram shows that there is no transfer of fluorescence from painted RBCs (arrow) to normal RBCs (major population) both in vitro and in vivo.
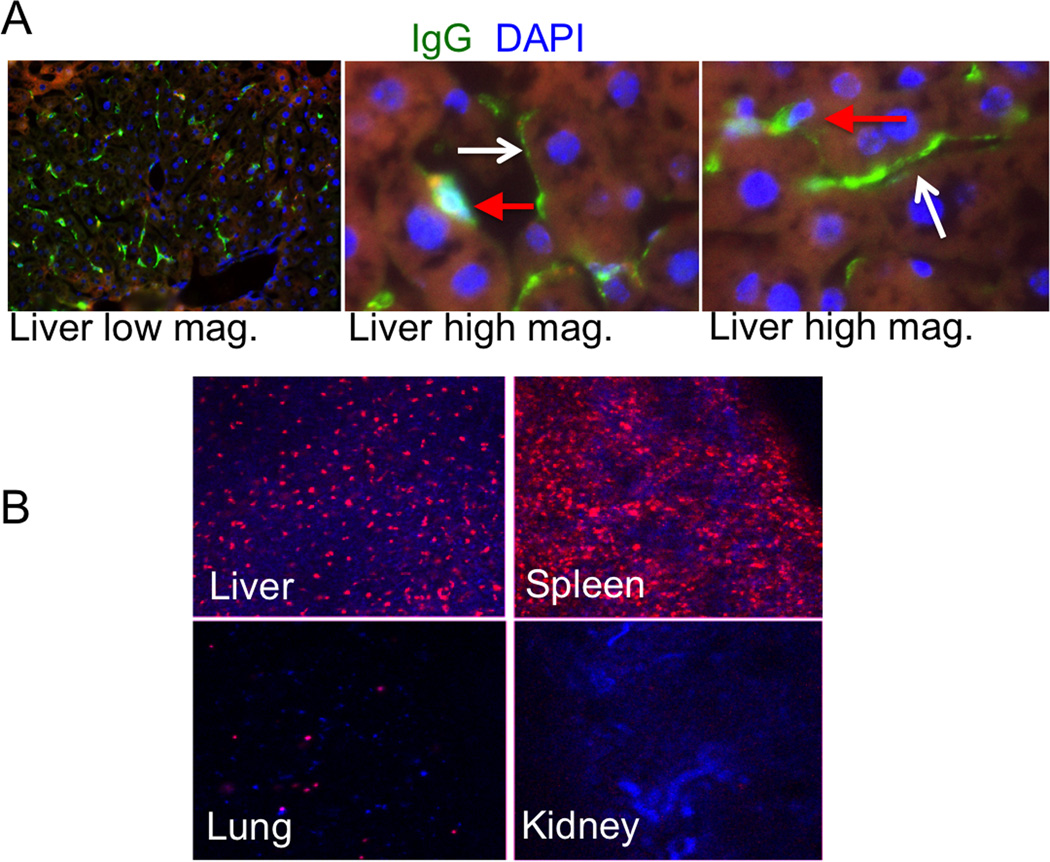
Previously, transfer of GPI anchored proteins from RBCs to other RBCs via microvesicles was observed. [10] We analyzed flow cytometry histograms of IgG levels at 5 min and 24h post-injection (Figure 3D). There was very little transfer of IgG to general population of blood cells in vitro and in vivo, suggesting that DSPE-PEG-IgG does not readily migrate to other blood cells. The fact that DiI was very stable in vitro and in vivo suggests that the DSPE-PEG-IgG loss is not through non-specific membrane microvesicles, but rather through lipid transfer. Previously, it was shown that GPI anchored proteins migrate from RBCs to endothelial cells in the heart, kidney, spleen and liver. [8] In order to determine whether DSPE-PEG-IgG also ends up on endothelial cells, we injected mice with RBCs painted with DSPE-PEG-IgG (rat antibody) and stained the tissue sections with Alexa 488-goat ant-rat antibody. Microscopic examination of the tissues revealed that rat IgG was abundantly and exclusively present on sinusoidal (endothelial) cells and on Kupffer cells in the liver (Figure 4A). Other organs, including spleen, lung, heart and kidney did not reveal significant deposition of DSPE-PEG-IgG (not shown). Next, we determined the fate of the injected RBCs. We collected main organs 24 h post-injection and studied DiI fluorescence in non-fixed tissue sections (DiI is a non-fixable dye and is lost from sections after fixation). According to Figure 4B, DiI stained RBCs were sequestered in the liver and spleen, with only minimal accumulation in the lungs and kidneys.
Fig. 4. Fate of surface IgG and painted RBCs in vivo.
A, Mice were injected with DSPE-PEG-IgG (rat) and the tissues were stained with Alexa 488 goat-anti-rat IgG. Liver tissue showed presence of DSPE-PEG-IgG stain. Left image is low magnification; center and right images are high magnification of the liver tissue. Red arrows point to depositions of rat IgG in Kupffer cells and white arrows point to rat IgG on endothelial (sinusoidal) cells; B, Mice were injected with DSPE-PEG-IgG/DiI painted RBCs. Low-magnification images of non-fixed tissue sections of mouse organs were taken 24h post-injection. Majority of DiI accumulated in the liver and spleen and trace amounts were found in lungs and kidneys.
2.4. Role of IgG and PEG in ligand retention in vivo and RBC circulation
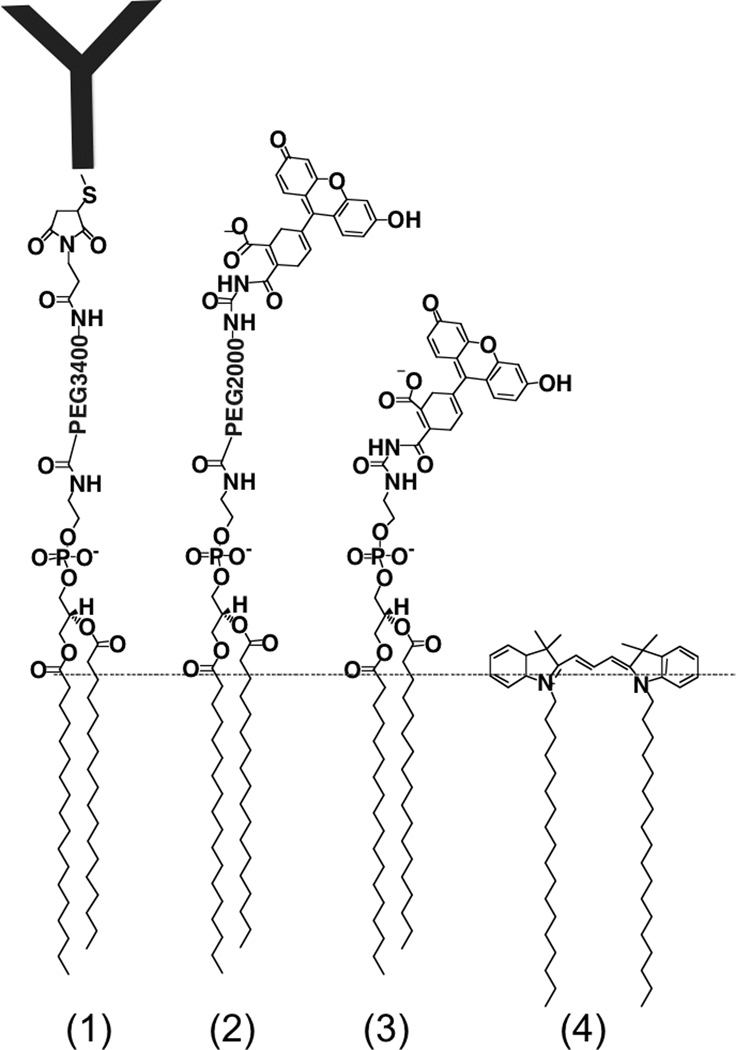
We questioned whether construct chemistry affects the circulation and retention properties described above. In particular, we sought to better understand the contribution of the tethered ligand in the retention in the RBC membrane. For comparison with DSPE-PEG-IgG (Figure 5, compound 1), we prepared DSPE-PEG-FITC (compound 2). To compare the effect of PEG linker, we prepared DSPE-FITC (compound 3). DiI is also shown (compound 4). Mass spectrometry analysis of the compounds is provided in Supplemental Fig. S5.
Fig. 5. Constructs tested for membrane retention and RBC half-life.
From left to right: DSPE-PEG-IgG, DSPE-PEG-FITC, DSPE-FITC, DiI. Dotted line shows approximate position at the water-lipid interface.
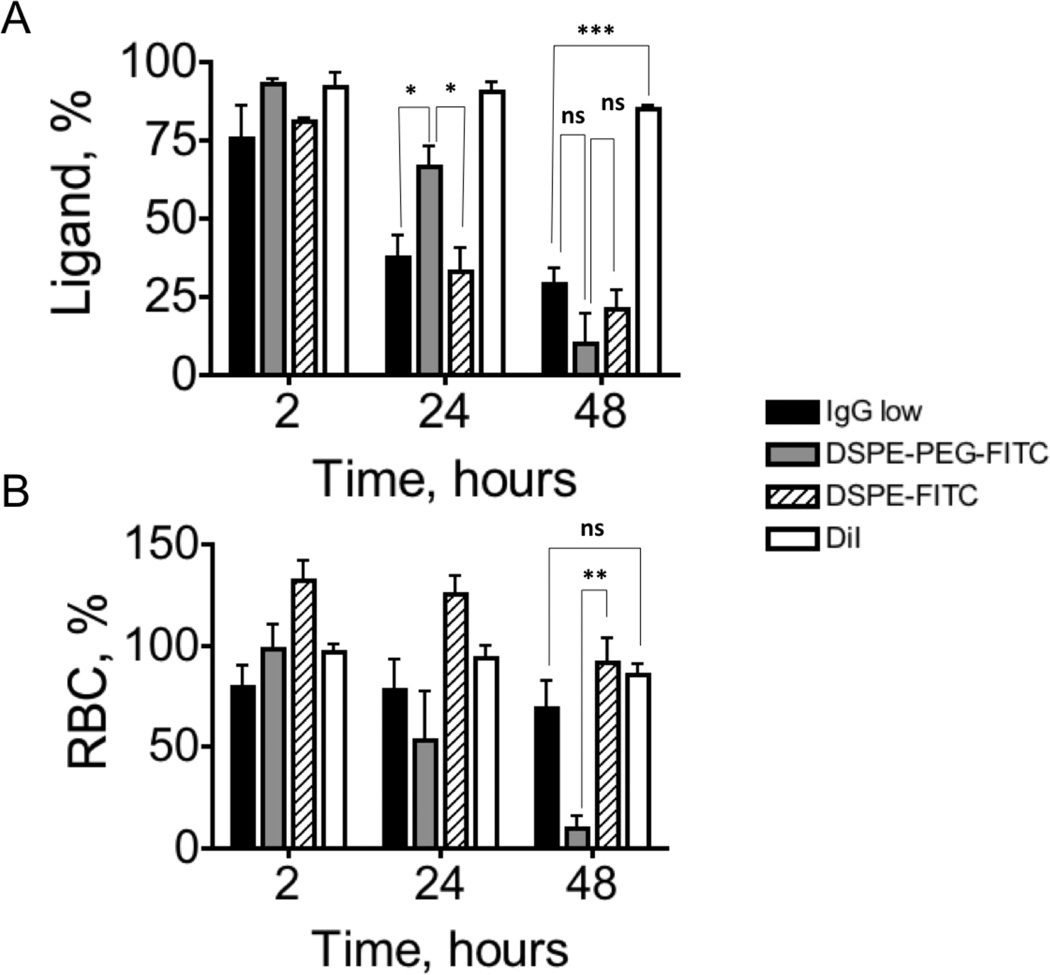
RBCs were painted with DiI alone or in combination with each of the constructs in Fig. 5. The level of FITC fluorescence was amplified with secondary Alexa 488-anti-FITC antibody (Supplemental Fig. S6). Before injection, FL-1 fluorescence of DSPE-PEG-FITC RBCs was 915, and that of DSPE-FITC RBCs was 723, which should roughly correspond to “low IgG” levels in regards to the number of construct copies per RBC. The ligand and RBC levels following tail vein injection are shown at three time points: 2 h, 24 h and 48 h post-injection (we used 5 min time point as 100%). DSPE-PEG-IgG “low IgG” data from Figure 2E,G are also included. According to Figure 6A, the retention of DSPE-PEG-FITC at 24 h was significantly better than DSPE-PEG-IgG or DSPE-FITC (p-value 0.034 and 0.043, respectively). However, at 48 h the levels of DSPE-PEG-FITC dropped dramatically and were not statistically different from DSPE-PEG-IgG and DSPE-FITC. The conclusion from these data is that both DSPE-PEG-FITC and DSPE-PEG-IgG are prone to removal from the membrane, albeit DSPE-PEG-FITC was more stable at 24 h. Also, DSPE-PEG-FITC retention at 24 h was significantly better than that of DSPE-FITC, but at 48 h the trend was reversed. In contrast, DiI was significantly more stable than all other constructs at all time points (Figure 6A). RBC levels (Figure 6B) showed that all formulations except DSPE-PEG-FITC circulated for prolonged periods of time. At 48h, the levels were significantly higher for DSPE-FITC RBCs and DSPE-PEG-IgG than for DSPE-PEG-FITC RBCs (p-value=0.006). The reason for this drop at 48h is not clear, but could be related to delayed activation of immune mechanisms that recognize DSPE-PEG-FITC.
Fig. 6. Stability of lipid constructs and RBC clearance in vivo.
RBCs were painted with DiI alone or with DiI and FITC constructs described in Fig. 5. Results are compared with DSPE-PEG-IgG (low IgG)/DiI-painted RBCs. Ligand levels on the RBC surface (A) and RBC levels in blood (B) were independently monitored by flow cytometry as described in Fig. 2. DSPE-PEG-FITC showed somewhat better retention than DSPE-PEG-IgG at 24h but there was no significant difference at 48h. Conversely, both DSPE-PEG-IgG RBCs and DSPE-FITC RBCs showed better circulation properties than DSPE-PEG-IgG at 48h. All data were in triplicates and analyzed with two-sided t-test.
3. Discussion
The purpose of the study was: (a) to develop a strategy for stable painting of RBC surface with ligands for in vivo targeting and therapeutic applications; (b) to study the factors controlling in vivo stability of surface-painted RBCs. Previous studies reported efficient cell painting with GPI anchors, [13] phospholipid derivatives [15] and lipoproteins, [14] but there were no reports that addressed the stability of extraneously added lipid anchors and the stability of the painted cells in vivo. Our data show an excellent stability of DSPE-PEG-IgG in vitro and prolonged stability and circulation properties of DSPE-PEG-IgG-painted RBCs in vivo. Previous study demonstrated the transfer of GPI-anchored CD55 and CD59 from normal RBCs to the deficient RBCs in vivo [10] via microvesicles. However, our in vitro incubation experiments suggest that microvesiculation is not the main mechanisms for IgG removal from RBC surface, since DiI and DSPE-PEG-IgG showed very different rates of removal. Based on our data (Fig. 3C–D and Fig. 4) we conclude that DSPE-PEG-IgG construct removal in vitro occurs due to the transfer to plasma components, such as lipoproteins, whereas in vivo there is an additional mechanism of transfer to liver endothelial membranes. Both modes of lipid transfer have been demonstrated before. [8, 12, 20]
IgG removal from the membrane could be specifically mediated by low- and high-affinity immunoglobulin receptors present on many cell types, including endothelia and macrophages. [21] IgG Fc portion could also be responsible for extraction of RBCs from the circulation by liver and spleen macrophages. The important observation of our work is that ligand removal and RBC clearance are only partially due to the presence of IgG, since FITC-painted RBCs were also prone to ligand removal and clearance. Moreover, IgG-painted RBCs can be designed to exhibit long-circulating properties by adjusting the ligand concentration in the membrane. On the other hand, PEG linker promoted clearance of DSPE-PEG-FITC RBCs at 24h. Modification with PEG has been shown to protect RBCs against immune recognition, [22] and we observed that incorporation of DSPE-PEG5000 in RBCs does not affect the clearance (not shown here). It is possible that PEG linker increased the distance between FITC and RBC membrane and thus facilitated the immune recognition of FITC coated RBCs by liver and spleen macrophages. The remarkable stability of DiI stood out from the DSPE-based constructs. DiI is incorporated deep in the bilayer structure [23], which could explain the excellent retention and long circulating properties of DiI-painted RBCs. Understanding the mechanisms of stability and retention of DiI could be instrumental in designing ultra-stable lipid constructs for membrane painting.
Based on the data, we would like to summarize the most important parameters that could be varied to increase the stability of the ligand and the circulation properties of RBCs: (a) Concentration of the ligand (IgG) in the membrane should be kept around 8,000–15,000 molecules/RBC for prolonged circulation and optimal retention; (b) Ligand size (IgG vs. FITC) has some effect on the retention in the membrane in vivo, therefore it would be beneficial to use Fab fragment, single chain antibody or small peptide as a targeting ligand; (c) PEG linker between the ligand and the anchor negatively affects circulation half-life of RBCs, therefore shorter linkers could be beneficial for RBC circulation; (d) Lipid anchor chemistry appears to determine the retention of the ligand in the membrane, therefore alternative non-DSPE anchors could be tested to improve ligand retention.
In conclusion, our data are the important contribution to the design of surface-painted RBCs as therapeutic/diagnostics carriers, and provide clues for surface painting of other types of cells (e.g., stem cells, immune cells) for in vivo applications.
4. Experimental Section
Reagents
1,2-distearoyl-sn-glycero-3-phosphoethanolamine (DSPE) and 1,2-distearoyl-sn-glycero-3-phosphoethanolamine-N-[amino(polyethylene glycol)-2000] (ammonium salt) (DSPE-PEG2000-amine) were purchased from Avanti Polar Lipids (Alabaster, AL, USA), 2-distearoyl-sn-glycero-3-phospho-ethanolamine-N-[maleimide(polyethylene glycol)-3400] (DSPE-PEG3400-Malemide) was purchased from Laysan Bio, Inc. (Arab, AL, USA). All the lipids were stored as chloroform solution under argon at −20°C. Traut’s reagent (2-iminothiolane) was purchased from Thermo Fisher Scientific (Rockford, IL, USA). The reagent was dissolved in double-distilled water at 5 mg/ml and stored in aliquots at −20°C. Ellman’s reagent (5,5'-dithiobis-(2-nitrobenzoic acid) was purchased from Thermo Fisher Scientific and stored as a dry powder at −4°C prior to use. ChromPure mouse and rat IgG whole molecule were purchased from Jackson ImmunoResearch (West Grove, PA, USA). Fluorescein isothiocyanate (FITC) 5’-isomer and triethanolamine (TEA) were from Sigma. 1,1'-dioctadecyl-3,3,3'3'-tetramethylindocarbocyanine perchlorate (DiI) was from Biotium (Hayward, CA). Alexa Fluor® 488-labeled goat anti-mouse, goat anti-rat and anti-fluorescein IgG (H+L) (2 mg/ml) were from Invitrogen.
Synthesis of lipid anchor
Traut’s reagent was used to generate sulfhydryl groups on IgG molecules. Traut’s reagent solution (5 mg/ml in phosphate-buffered saline (PBS), 5.5 µl) and EDTA buffer (50 mM in PBS, 12 µl) were placed to 120 µl of mouse IgG solution (5 mg/ml in PBS). The mixture was incubated for 1h at room temperature (RT) on a shaker and washed through a spin desalting column (Zeba, MWCO 7K, Thermo Scientific) following the manufacturer’s instructions to remove the unreacted Traut’s reagent. The generation of sulfhydryl groups on the modified IgG was quantified using Ellman’s Reagent (Pierce) based on the manufacturer’s protocol. Generally, 40-fold of Traut’s reagent (molar equivalent to IgG) resulted in 1–2 sulfhydryl groups per each IgG as quantified with Ellman reagent. DSPE-PEG-mal (1 mM in PBS, 4 µl, molar ratio DSPE-PEG3400-maleimide:IgG = 1:1) were added to the desalted IgG solution and incubated at RT on a shaker. After 1h, the sample solution was filtered using a centrifugal filter device (Microcon YM-50, 50K, Millipore Co.) at 14000 g for 15 min at 4°C to remove the small molecules and suspended in 600 µl PBS (1 mg/ml IgG). The purified DSPE-PEG-IgG was analyzed by matrix-assisted laser desorption/ionization-time-of-flight mass spectrometry (MALDI-TOF MS). Desalted unmodified IgG or desalted lipid-IgG (1 mg/ml in water) were mixed with sinapinic acid matrix solution (10 mg/mL, 30:70 ACN : H2O, v/v, containing 2% TFA) at 1:1 ratio. One microliter of the prepared samples were then spotted onto MALDI stainless steel plate and air dried before analysis. The samples were analyzed with Voyager DE-STR in positive ion mode (ABSCIEX, Framingham, MA).
Lipid-FITC anchor was synthesized by reacting lipid (DSPE, or DSPE-PEG2000-amine) with FITC under catalysis by TEA. For example, DSPE (7.5 mg) and FITC (7.8 mg) were dissolved into 1.5 ml chloroform and 1.4 µl TEA (molar ratio DSPE:FITC:TEA = 1:2:1), and mixed at 1000 rpm at RT for 2 hours in a dark environment. The reaction mixture was purified by thin layer chromatography (TLC) with an mobile phase of methanol and chloroform (volume ratio methanol: chloroform = 1:3) on a aluminum silica gel plate (pore size 60Å, Z193275, Sigma-Aldrich). The product mass was verified with electrospray mass spectrometry in a negative ion mode.
RBC painting
BALB/c mouse blood was used to prepare modified RBCs. Generally, 200 µl of whole blood was suspended in 1000 µl PBS and spun at 1500 g for 30 sec, repeated 4 times. Finally, the RBCs were suspended in 800 µl PBS. The conjugation of RBC/DSPE-PEG-IgG was prepared by mixing the above RBCs suspensions and various amounts of DSPE-PEG-IgG solution (1 mg IgG/ml) followed by incubation for 15–30 min at 37°C. The mixture was kept for 5 min at room temperature, then washed 3 times in PBS and resuspended to a final RBC concentration of 5×10⁸/ml. An automated cell counter (Countess, Invitrogen) was used to measure the cell concentration. To prepare DiI-painted RBCs, the PBS-washed RBC suspension with or without IgG painting (5×10⁸/ml in PBS, 500 µl) was incubated with the same volume of DiI solution (10 µM in DBPS diluted from 2 mM DiI in ethanol) for 20 min at room temperature under 100 rpm. The mixture was washed with PBS for 3 times and resuspended in 500 µl PBS.
Quantification of IgG incorporation and stability
In order to visualize the incorporated IgG in the RBC membrane, Alexa Fluor® 488 goat anti-mouse IgG (2 mg/ml, 2 µl) was diluted in 200 µl PBS and incubated with the same volume of RBCs (5×10⁸/ml in PBS) for 20 min at RT under 100 rpm followed by washing and suspending in 200 µl PBS. The stained RBCs were visualized by fluorescent microscope (Nikon Eclipse) on a glass slide.
The amount of IgG conjugated to RBCs was quantified with western blot. RBC samples were dissolved in Laemmli sample buffer (Bio-Rad, Hercules, CA, USA). IgG samples at a series of known concentrations were subsequently loaded on the gel and separated with SDS-PAGE. For quantification of the band intensities, the IgG standard curve was prepared and run in parallel with the samples. After transfer to nitrocellulose membrane, the bands were probed with IRDye 800CW goat anti-mouse antibody (Li-COR, Lincoln, NE). The membrane was scanned on a Li-COR Odyssey scanner and the intensity of the antibody bands was quantified using ImageJ software. The density of 50 kDa bands (heavy IgG chain) was used for plotting the calibration curve and for sample concentration calculations.
For flow cytometry analysis, RBCs (5.0×10⁸/ml in PBS, 10 µl) were stained with secondary fluorescent antibody as described above, added to 1 ml of ice cold 0.5% BSA in PBS and analyzed with FACS Calibur (BD Biosciences, San Jose, CA). FlowJo software was used to process all the flow cytometry data. Several groups of RBCs suspensions were used as controls, including single painted RBCs by DiI or fluorescent 2nd Ab, RBC painting only (without labeling), RBC suspension stained by 2nd Ab only (without 1st Ab), and PBS-washed RBC suspension (directly from washed mouse blood). Standard beads (Linear Flow™ Green Flow Cytometry Intensity Calibration Kit, Invitrogen) were used to calibrate the green fluorescence intensity between the measurements.
In vitro stability test of RBC conjugation
The in vitro stability of RBC painting was tested in two media: 10% fetal bovine serum (FBS) supplemented RPMI medium and whole blood. The double-painted RBCs (5×10⁹/ml, 50 µl) were incubated in 500 µl of complete RPMI or whole blood at 37°C under shaking (Thermomixer, Eppendorf) at 500 rpm. The sampling was performed at different time points, up to 24h. The samples were analyzed by fluorescent microscopy and quantified by flow cytometry as described in the previous section.
In vivo injections
All of the animal work described here was reviewed and approved by the UCSD Institute’s Animal Research Committee. For studies involving RBC clearance, BALB/c eight- to twelve-week-old female mice were used. Modified RBCs (equivalent to 20–50 µl blood) were injected into the tail vein in a total volume of up to 100 µl. Blood was collected at different time points starting at 5 min post-injection from the periorbital vein by heparinized capillaries (25 µl volume each time). Ten microliters of blood was washed in PBS 3 times and stained with the fluorescent secondary antibody for flow cytometry analysis. The percentage of the remaining ligand and RBCs was determined using 5 min time point as 100%. Elimination curve of IgG was plotted using Prism (GraphPad) software, fitted whenever possible with bi-exponential decay equation and the ligand half-life was determined.
For histological analysis of RBC uptake, animals were injected with Cy5-dextran (40kDa) as tissue counterstain and sacrificed 24h post-injection. Organs were dissected, placed under cover glass and studied for DiI and Cy5 fluorescence using Olympus IV1000 microscope. In order to study the fate of DSPE-PEG-IgG (rat), organs were fixed, cryosectioned and stained with Alexa 488 goat-anti-rat antibody.
Supplementary Material
Acknowledgements
This study was funded by Department of Defense (Army) IDEA Award BC095376, NIH IMAT CA137721 and NIH CA16488 to D.S.
Footnotes
Authors declare no conflict of interest. Contribution: GS-performed experiments, wrote the manuscript; RM-performed experiments; SK-contributed materials, discussion of data; DS-concept of the study, performed experiments, wrote the manuscript
Contributor Information
Dr. Guixin Shi, Solid Tumor Therapeutics Program, Moores UCSD Cancer Center, 3855 Health Sciences Dr. La Jolla CA, 92093, USA
Dr. Rajesh Mukthavaram, Neuro-Oncology Program, Moores UCSD Cancer Center, 3855 Health Sciences Dr. La Jolla CA, 92093, USA
Santosh Kesari, Neuro-Oncology Program, Moores UCSD Cancer Center, 3855 Health Sciences Dr. La Jolla CA, 92093, USA
Dr. Dmitri Simberg, Email: dsimberg@ucsd.edu, Solid Tumor Therapeutics Program, Moores UCSD Cancer Center, 3855 Health Sciences Dr. La Jolla CA, 92093, USA.
References
- 1.a) Ganguly K, Krasik T, Medinilla S, Bdeir K, Cines DB, Muzykantov VR, Murciano JC. Journal of Pharmacology and Experimental Therapeutics. 2005;312:1106. doi: 10.1124/jpet.104.075770. [DOI] [PubMed] [Google Scholar]; b) Rossi L, Serafini S, Pierige F, Castro M, Ambrosini MI, Knafelz D, Damonte G, Annese V, Latiano A, Bossa F, Magnani M. J Control Release. 2006;116:e43. doi: 10.1016/j.jconrel.2006.09.041. [DOI] [PubMed] [Google Scholar]; c) Cinti C, Taranta M, Naldi I, Grimaldi S. Plos One. 2011;6 doi: 10.1371/journal.pone.0017132. [DOI] [PMC free article] [PubMed] [Google Scholar]
- 2.Zaitsev S, Spitzer D, Murciano JC, Ding BS, Tliba S, Kowalska MA, Bdeir K, Kuo A, Stepanova V, Atkinson JP, Poncz M, Cines DB, Muzykantov VR. J Pharmacol Exp Ther. 2010;332:1022. doi: 10.1124/jpet.109.159194. [DOI] [PMC free article] [PubMed] [Google Scholar]
- 3.Fens MHAM, Mastrobattista E, De Graaff AM, Flesch FM, Ultee A, Rasmussen JT, Molema G, Storm G, Schiffelers RM. Blood. 2008;111:4542. doi: 10.1182/blood-2007-06-094763. [DOI] [PubMed] [Google Scholar]
- 4.Terman DS, Viglianti BL, Zennadi R, Fels D, Boruta RL, Yuan H, Dreher MR, Grant G, Rabbani ZN, Moon E, Lan L, Eble J, Cao Y, Song B, Ashcraft K, Palmer G, Telen MJ, Dewhirst MW. Plos One. 2013;8 doi: 10.1371/journal.pone.0052543. [DOI] [PMC free article] [PubMed] [Google Scholar]
- 5.Taylor RP, Sutherland WM, Reist CJ, Webb DJ, Wright EL, Labuguen RH. P Natl Acad Sci USA. 1991;88:3305. doi: 10.1073/pnas.88.8.3305. [DOI] [PMC free article] [PubMed] [Google Scholar]
- 6.a) Yan J, Vetvicka V, Xia Y, Hanikyrova M, Mayadas TN, Ross GD. Immunopharmacology. 2000;46:39. doi: 10.1016/s0162-3109(99)00157-5. [DOI] [PubMed] [Google Scholar]; b) Friedrich EA, Aulenbacher P, Schlepper-Schafer J, Suss R. Immunol Lett. 1982;4:167. doi: 10.1016/0165-2478(82)90030-x. [DOI] [PubMed] [Google Scholar]; c) Bowring CS, Glass HI, Lewis SM. J Clin Pathol. 1976;29:852. doi: 10.1136/jcp.29.9.852. [DOI] [PMC free article] [PubMed] [Google Scholar]
- 7.Paulick MG, Bertozzi CR. Biochemistry. 2008;47:6991. doi: 10.1021/bi8006324. [DOI] [PMC free article] [PubMed] [Google Scholar]; Dunphy JT, Linder ME. Biochim Biophys Acta. 1998;1436:245. doi: 10.1016/s0005-2760(98)00130-1. [DOI] [PubMed] [Google Scholar]
- 8.Kooyman DL, Byrne GW, Mcclellan S, Nielsen D, Tone M, Waldmann H, Coffman TM, Mccurry KR, Platt JL, Logan JS. Science. 1995;269:89. doi: 10.1126/science.7541557. [DOI] [PubMed] [Google Scholar]
- 9.Medof ME, Nagarajan S, Tykocinski ML. FASEB J. 1996;10:574. doi: 10.1096/fasebj.10.5.8621057. [DOI] [PubMed] [Google Scholar]
- 10.Sloand EM, Mainwaring L, Keyvanfar K, Chen JC, Maciejewski J, Klein HG, Young NS. Blood. 2004;104:3782. doi: 10.1182/blood-2004-02-0645. [DOI] [PubMed] [Google Scholar]
- 11.Rifkin MR, Landsberger FR. Proc Natl Acad Sci U S A. 1990;87:801. doi: 10.1073/pnas.87.2.801. [DOI] [PMC free article] [PubMed] [Google Scholar]
- 12.Vakeva A, Jauhiainen M, Ehnholm C, Lehto T, Meri S. Immunology. 1994;82:28. [PMC free article] [PubMed] [Google Scholar]
- 13.Civenni G, Test ST, Brodbeck U, Butikofer P. Blood. 1998;91:1784. [PubMed] [Google Scholar]
- 14.de Kruif J, Tijmensen M, Goldsein J, Logtenberg T. Nature Medicine. 2000;6:223. doi: 10.1038/72339. [DOI] [PubMed] [Google Scholar]
- 15.Kato K, Itoh C, Yasukouchi T, Nagamune T. Biotechnol Progr. 2004;20:897. doi: 10.1021/bp0342093. [DOI] [PubMed] [Google Scholar]
- 16.Parr MJ, Ansell SM, Choi LS, Cullis PR. Bba-Biomembranes. 1994;1195:21. doi: 10.1016/0005-2736(94)90004-3. [DOI] [PubMed] [Google Scholar]
- 17.Ferrell JE, Lee KJ, Huestis WH. Biochemistry. 1985;24:2857. doi: 10.1021/bi00333a007. [DOI] [PubMed] [Google Scholar]
- 18.Nelson GJ. Biochimica Et Biophysica Acta. 1967;144:221. doi: 10.1016/0005-2760(67)90152-x. [DOI] [PubMed] [Google Scholar]
- 19.Szymanski IO, Odgren PR, Fortier NL, Snyder LM. Blood. 1980;55:48. [PubMed] [Google Scholar]
- 20.Allen TM. Biochim Biophys Acta. 1981;640:385. doi: 10.1016/0005-2736(81)90464-8. [DOI] [PubMed] [Google Scholar]
- 21.a) Smedsrod B, Pertoft H, Gustafson S, Laurent TC. Biochem J. 1990;266:313. doi: 10.1042/bj2660313. [DOI] [PMC free article] [PubMed] [Google Scholar]; b) Taylor PR, Martinez-Pomares L, Stacey M, Lin HH, Brown GD, Gordon S. Annu Rev Immunol. 2005;23:901. doi: 10.1146/annurev.immunol.23.021704.115816. [DOI] [PubMed] [Google Scholar]
- 22.a) Bradley AJ, Murad KL, Regan KL, Scott MD. Bba-Biomembranes. 2002;1561:147. doi: 10.1016/s0005-2736(02)00339-5. [DOI] [PubMed] [Google Scholar]; b) Scott MD, Murad KL, Koumpouras F, Talbot M, Eaton JW. Proc Natl Acad Sci U S A. 1997;94:7566. doi: 10.1073/pnas.94.14.7566. [DOI] [PMC free article] [PubMed] [Google Scholar]
- 23.Gullapalli RR, Demirel MC, Butler PJ. Phys Chem Chem Phys. 2008;10:3548. doi: 10.1039/b716979e. [DOI] [PMC free article] [PubMed] [Google Scholar]
Associated Data
This section collects any data citations, data availability statements, or supplementary materials included in this article.


