Abstract
Inserm is the only French public research institution entirely dedicated to human health. Inserm supports research across the biomedical spectrum in all major disease areas, from fundamental lab-based science to clinical trials. To translate its scientists findings into tangible health benefits Inserm has its own affiliated company, Inserm Transfert, which works with industry. Since 2001, Inserm has set up the on-line file management software for the evaluation of researchers and laboratories, called EVA (www.eva.inserm.fr). EVA includes all grant applications, assessment reports, grading evaluation forms and include an automated bibliometric indicator software that enables to calculate for each researcher of the teams, the number of publications, impact factor of journals, number of citations, citation index, number of Top 1% publications … The indicators take into account research fields, the year of publications, the author position within the participants.
Bibliometrics is now considered as a tool for science policy providing indicators to measure productivity and scientific quality, thereby supplying a basis for evaluating and orienting R&D. It is also a potential tool for evaluation. It is neutral, allows comparative (national & international) assessment and may select papers in the forefront in all fields. For each team bibliometric indicators were calculated for all researchers with permanent positions or long term positions (3 to 5 years). The use of bibliometric indicators requires a great vigilance but according to our experience they without any doubt enrich the committee’s debates. We present the analysis of the data of 600 research teams evaluated in 2007–2008.
Keywords: Academies and Institutes; organization & administration; Bibliometrics; Biomedical Research; organization & administration; statistics & numerical data; Evaluation Studies as Topic; Financing, Organized; statistics & numerical data; France; Health Care Sector; Information Management; Journal Impact Factor; Laboratories; standards; Peer Review, Research; standards; Periodicals as Topic; statistics & numerical data; Policy Making; Publishing; statistics & numerical data; Quality Control; Software
Inserm (Institut National de la Santé de la Recherche Médicale) is a public institution jointly overseen by the Ministry of Health and the Ministry of Research. Inserm is the only French public research institution entirely dedicated to human health. Inserm supports research across the biomedical spectrum in all major disease areas, from fundamental lab-based science to clinical trials. To translate its scientists findings into tangible health benefits Inserm has its own affiliated company, Inserm Transfert, which works with industry.
Today, 85% of Inserm’s research laboratories (339) are located in universities or university hospital centers, the others being on research campuses of the CNRS (Centre National de la Recherche Scientifique) or the Pasteur Institute. 13,000 people (including 6040 researchers and clinicians) work in Inserm’s research units located all over France.
Most of Inserm investment (86% of 652 M ) is in response to research proposals from clinical and non-clinical scientists, which compete for the funds available. Research proposals include tenure positions or laboratory support. We present the data of the use of bibliometric indicators in laboratory assessment.
Inserm laboratories evaluation
National and international recognition of a research institute is highly dependent on the excellence of the science developed within its laboratories. As for many research institutes, Inserm’s laboratories evaluation is based on peer review process.
Assessment procedures include 3 main stages:
Stage 1: a site visit by Scientific committees (including national and international experts and Inserm Head Office representatives).
Stage 2: ranking by Inserm committees based on site visit assessment and anonymous assessments by external international experts (plenary session)
Stage 3: Interview of the Unit leader and ranking by the Scientific Council welcoming international experts (plenary session)
The final decision is made by the Directeur Général.
All referees (internal and external) assess the proposals using the same main criteria:
past scientific activity including publications, transfer of technology, student training. For a second term, the achievement of the previous term’s objectives is also evaluated;
the project over the next four years (originality, relevance, strategy, potential, feasibility, people and team synergy;
the prestige and quality of the scientific project leader and team leader management capability.
Evaluation of large laboratories or Research Centers is performed by assessing each team.
All teams of all laboratories are in competition and subject to a detailed report including scoring (A +, A, B or C.).
Biliometric indicators
Since 2001, Inserm has set up the on-line file management software for the evaluation of researchers and laboratories, called EVA (www.eva.inserm.fr). EVA includes all grant applications, assessment reports, grading evaluation forms and include an automated bibliometric indicator software that enables to calculate for each researcher of the teams, the number of publications, impact factor of journals, number of citations, citation index, number of Top 1% publications … The indicators take into account research fields, the year of publications, the author position within the participants.
Bibliometrics is now considered as a tool for science policy providing indicators to measure productivity and scientific quality, thereby supplying a basis for evaluating and orienting R&D. It is also a potential tool for evaluation (1–3). It is neutral, allows comparative (national & international) assessment and may select papers in the forefront in all fields.
Bibliometric indicators include:
The number of papers: reflects scientific output, as measured by articles, letters and reviews count
The number of article citations: measures the impact on the scientific community.
The number of co-signers: indicates co-operation at national or international level.
The number of publications in the Top 10% : allows to characterize international visibility
H Index: quantify scientific research output.
Position index : measures the implication of the author among the signers.
Co-publications: measures interactions and scientific relationships between networks, teams, institutions and countries.
Number of papers per researcher: measures productivity.
Journal Impact factor: measures the editorial barrier.
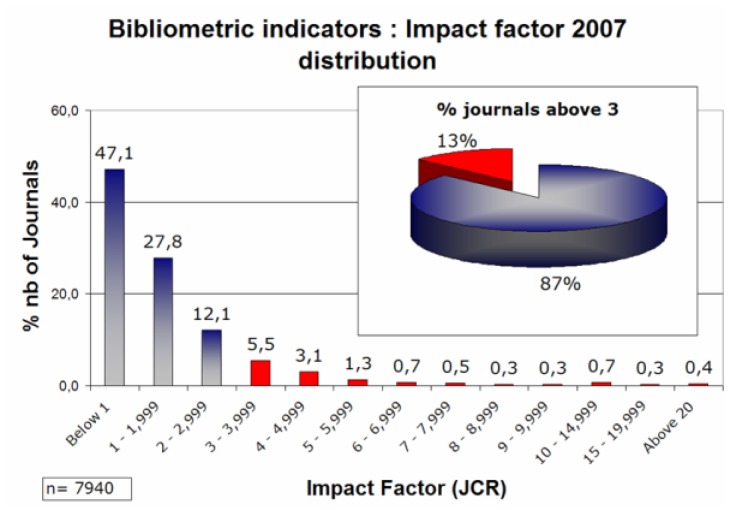
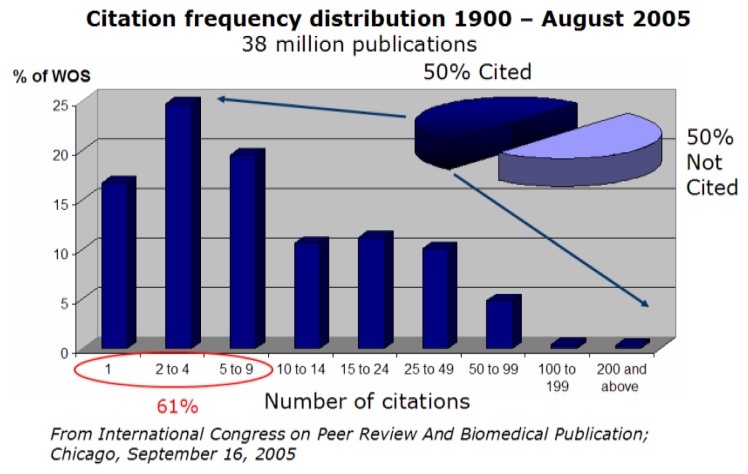
The use of Impact factor as a bibliometric indicator in evaluation is highly criticized but widely used (4–9) of almost 50% of the 7940 scientific journals, that belong to the world’s most highly cited, peer-reviewed journals in approximately 200 disciplines, are below 1 and 13% above 3 (Figure1). If the distribution of the citations of the publications is assessed between 1900 and 2005 (38 millions of publications), 50% of the publications were still not cited in august 2005 ; 61% of the cited publications received less than 10 citations and 1% of total publications (cited and not cited) received more than 100 citations (Figure 2).
Figure 1.
Figure 2.
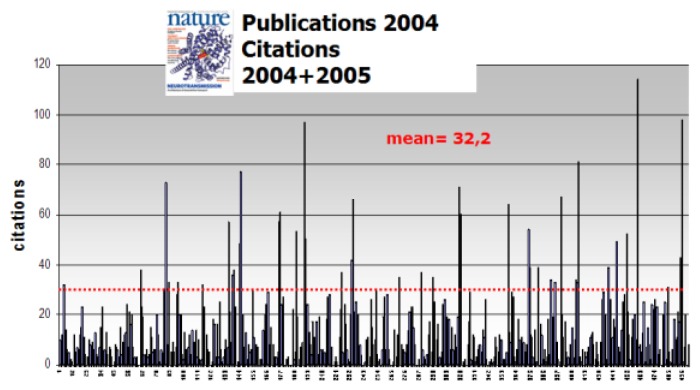
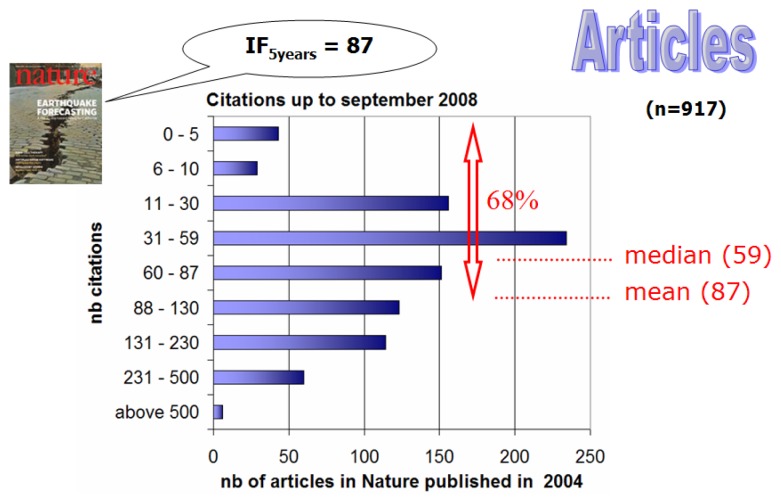
Since journal impact factors are easily available, it is tempting to use them to evaluate research activity (7). However, article citation rates determine the journal impact factor but not vice versa and it should be emphasized that journal impact factors highly depend on the research field: high impact factors are likely found in journals covering large areas of basic research such as genetics or biochemistry. Several publications have shown that journal impact factors correlate poorly with actual citations of individual articles. Only a very low proportion of publications are highly cited, review articles are heavily cited, inflating the impact factor of journals and Impact factor is a function of the number of references per article in the research field (4). Because the publication in a high impact factor journal does not generate more citations than the paper deserves or may receive from its limited readers, choosing journal impact factors to measure quality of the paper is clearly imperfect. As an example, we have chosen publications in Nature in 2004 and recorded citations received through 2004 and 2005. Several publications were still not cited even after one year of publications (figure 3). We further analyse the citations received by 2004 publications in Nature up to September 2008. Publications were divided in articles and reviews according to ISI typing: the mean citation index was of 87 for articles. Almost 70% of the articles were less cited than the mean citation index, 10% received less than 10 citations and few were even not cited after 5 years (Figure 4). It must be noted that ISI typing underestimates the review documents.
Figure 3.
Each bar represents the number of citation receive in 2004 and 2005 by each 2004 publication in Nature
Figure 4.
Publications in Nature in 2004
According to ISI Thompson records, publications in Clinical Medicine represent 21% of world publications, in Geosciences 2,73%, Molecular Biology & Genetics 2,8% and Social Sciences 4,15% between 1996 and 2006. The same data indicate that during the same period publications in Clinical Medicine of Nature represent 6,8%, in Geosciences 12,7%, Molecular Biology & Genetics 15,6% and Social Science 0,5% illustrating a very high specialisation in Molecular Biology & Genetics and Geosciences. It is noteworthy that publications in Nature for Clinical Medicine are cited 23,7 fold more than in all journals of the world, for Molecular Biology & Genetics it is only 5,2 fold more, for Geosciences 5,9 fold more and 8,1 fold more for Social Sciences. These results may suggest a very strong selectivity of publications in clinical medicine.
The availability of publication citations from the Web of Science allows identifying according to ESI thresholds the visibility of each publication. The citation thresholds are available for each scientific field and for each year. Thus, for an individual evaluation the number of publications belonging to the Top1% or Top 10% is a valuable indicator. It is of note that it is the only indicator field and time independent and therefore allows fair ranking.
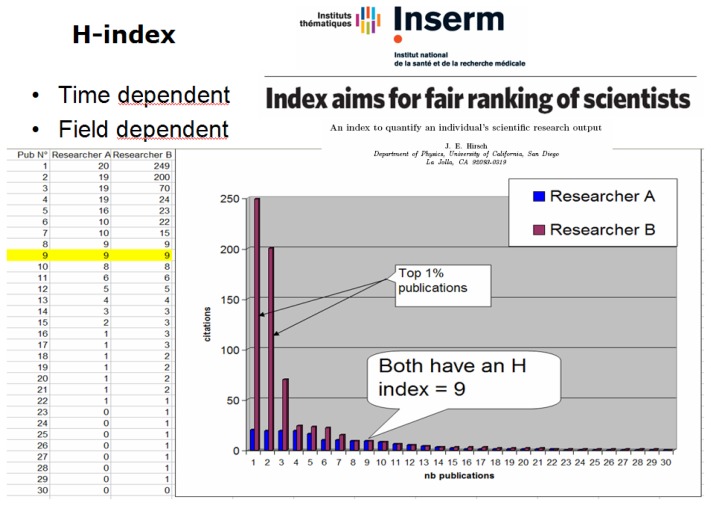
The H index, recently described by J.E. Hirsch (10) is also a valuable index if it is associated to the M index that takes into account the period of research involvement. It gives an indication of a global scientific research visible output. This indicator is time and field dependant. Moreover two researcher may have similar H index, one having no highly cited paper, the second having made several discoveries with a number of Top1% publications (Figure 5).
Figure 5.
h-index for two scientists in the same research field
The mean position index (MPI) gives the implication of the researcher in its output (MPI=1 if the author is first or last among the signer; 0,5 if the author is second or next to the last and 0,25 for all other positions).
Peer review versus bibliometric assessment
In 2004, Inserm evaluation introduced analysis of bibliometric indicators as part of the laboratories assessment. Bibliometric indicators are at the disposal of Inserm committees and we compared Inserm committees and anonymous expert scoring research team output.
We analysed the data of 271 research teams evaluated in 2006 and 401 research teams evaluated in 2007. For each team bibliometric indicators were calculated for all researchers with permanent positions or long term positions (3 to 5 years) as illustrated on Table 1.
Table 1.
2006 Bibliometric indicators of a team (unit) including several researchers – publications are from 2001 to 2006 – citations up to 2006 (Field: immunology)
| CSS2-Team 45 Publication grade B | ||||||||||||||
|---|---|---|---|---|---|---|---|---|---|---|---|---|---|---|
| Unit | researchers | Total Pub | Total Cites | mean Citation Index | corrected MCI | mean position index | mean IF | corrected mean IF | Pub Top1% | Pub Top10% | Pub Top20% | Pub Top50% | below median | Research time (%) |
| SAU | Cre | 5 | 57 | 11,4 | 10,8 | 0,9 | 6,42 | 5,75 | 0 | 0 | 1 | 2 | 2 | 100 |
| SAU | Die | 14 | 583 | 41,6 | 22,4 | 0,5 | 7,33 | 3,84 | 2 | 6 | 3 | 1 | 2 | 100 |
| SAU | Dra | 12 | 52 | 4,3 | 3,0 | 0,6 | 4,28 | 2,80 | 1 | 2 | 2 | 0 | 7 | 50 |
| SAU | Fis | 6 | 139 | 23,2 | 16,3 | 0,4 | 7,22 | 4,29 | 2 | 1 | 0 | 0 | 3 | 100 |
| SAU | Fre | 15 | 61 | 4,1 | 2,5 | 0,7 | 4,15 | 2,72 | 1 | 2 | 2 | 2 | 8 | 50 |
| SAU | Fri | 63 | 621 | 9,9 | 4,0 | 0,5 | 5,59 | 2,50 | 1 | 2 | 9 | 25 | 26 | 50 |
| SAU | Gal | 17 | 504 | 29,6 | 12,4 | 0,3 | 10,06 | 5,71 | 2 | 6 | 1 | 3 | 5 | 100 |
| SAU | Gre | 6 | 309 | 51,5 | 16,5 | 0,3 | 11,57 | 4,87 | 2 | 1 | 0 | 2 | 1 | 50 |
| SAU | Pag | 7 | 76 | 10,9 | 10,4 | 0,9 | 8,33 | 8,10 | 0 | 0 | 1 | 3 | 3 | 50 |
| SAU | Reg | 3 | 23 | 7,7 | 7,0 | 0,7 | 7,75 | 5,59 | 0 | 0 | 1 | 0 | 2 | 100 |
| SAU | Sau | 20 | 314 | 15,7 | 7,4 | 0,6 | 6,56 | 3,59 | 0 | 5 | 2 | 7 | 6 | 100 |
| SAU | Val | 30 | 134 | 4,5 | 1,5 | 0,3 | 2,86 | 0,97 | 0 | 1 | 4 | 11 | 15 | 50 |
| mean | 16,5 | 239,4 | 17,9 | 9,9 | 0,6 | 6,84 | 4,23 | |||||||
| 7 | 22 | 18 | 42 | 56 | ||||||||||
| No duplicates | ||||||||||||||
As depicted on table 1, some researchers (dark yellow) exhibit high mean citation indexes (MCI) but after correction using the position index, the corrected-MCI dropped suggesting a collaborative involvement on highly cited publications. Other (light yellow) published a lot but few publications are within Top10%.
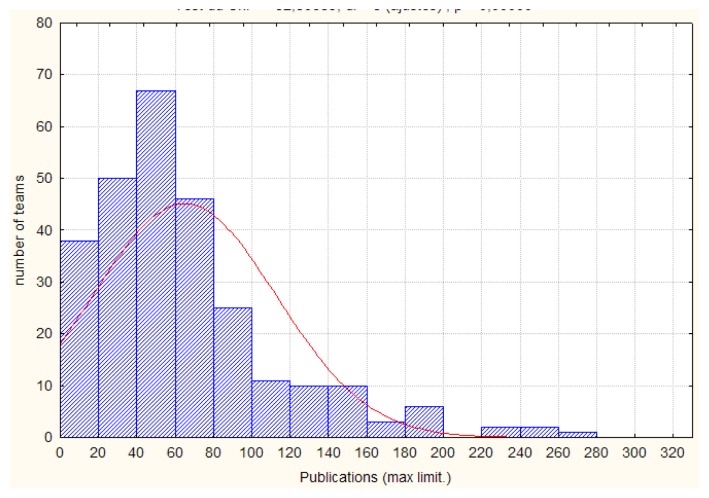
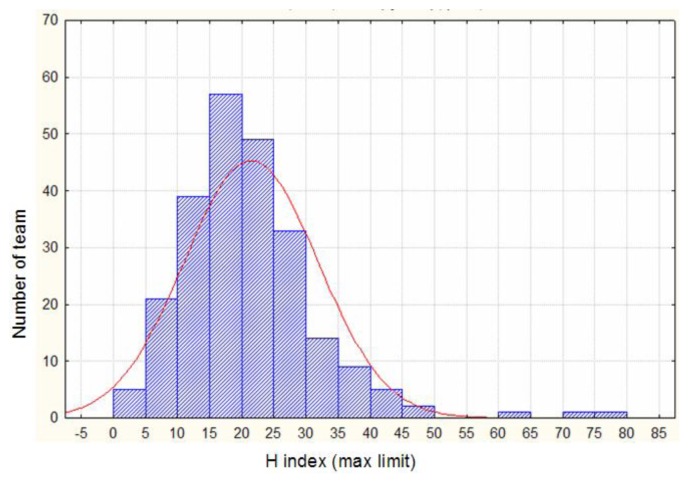
The different indicators were of normal distribution as illustrated by the total number of publications per team (without duplicates, Figure 6) and by the H index for the team leaders (Figure 7). Only three teams were out of the normal distribution with very high number of publications and citations (Figure 5).
Figure 6.
Distribution of number of publications per team (2007)
Figure 7.
Distribution of H index for team leaders (2007)
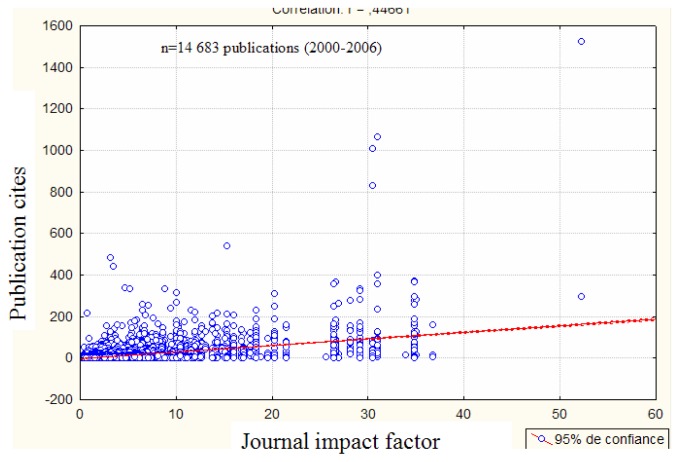
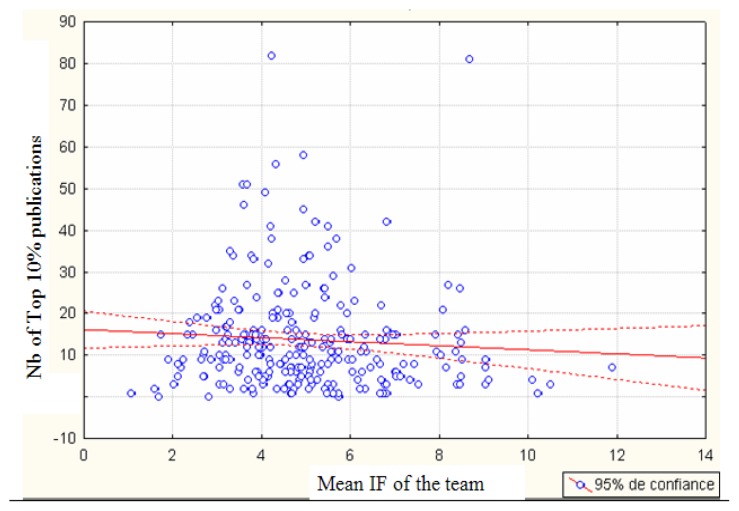
The publications (n=14 683 without duplicates) of all teams received a number of citations irrespective of the journal in which they are published with only a low correlation (r=0,44) between journal impact factor and publication citations (figure 8). We also observed no correlation between the numbers of publications in the Top10% by teams and their mean impact factors (figure 9).
Figure 8.
Citations of publications as a function of journal impact factors
Figure 9.
Number of Top 10% publications by the teams as a function of mean journal impact factor per team.
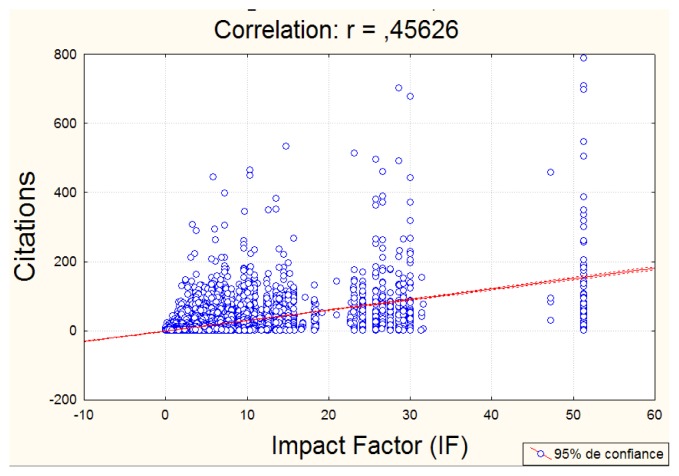
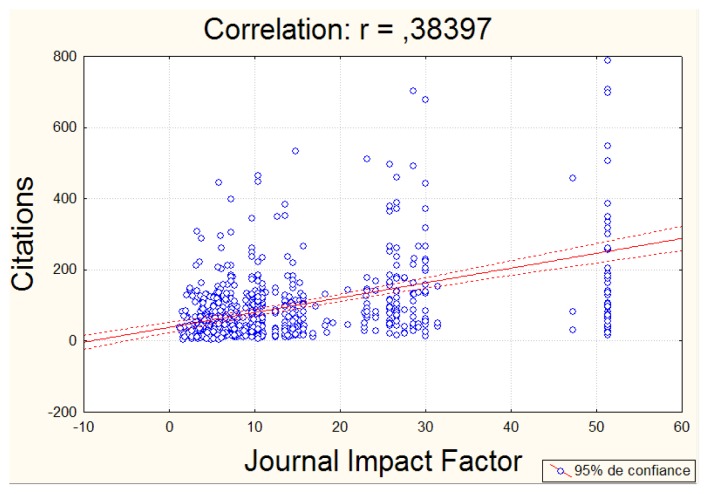
Similarly, for 2008 teams, we found no correlation between journal impact factor and individual publication citations (Figure 10), nor between publications in the Top 1% (n=723) and the impact factors (Figure 11; as the majority of 2007 publications were still not cited in march 2008, 2007 data were removed from the analysis. It is noteworthy that less than half of the Top 1% publications are in generalist journals with an impact factor above 20. In fact both indicators do not target the same information. Citations reflect visibility of the publication whereas journal impact factor measures the strength of the editorial gatekeepers.
Figure 10.
Citations of publications as a function of journal impact factors (18773 publications between 2002 and 2006)
Figure 11.
Citations of publications as a function of journal impact factors (18773 publications between 2002-and 2006)
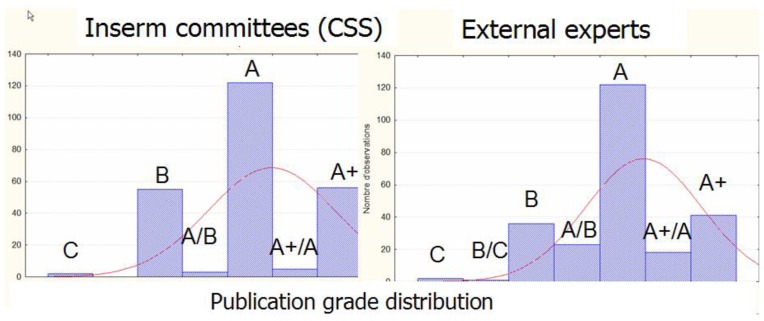
We then compared the scoring for the publications output of each team by Inserm committees and external anonymous experts. As indicated in the figure 12, the general shape of publication grade distribution was close for the two types of reviewers but only 38% of the teams received the same grade. The discrepancy was high in the B grade (only 17% were similar) and lower within grade A+ (35% were similar), among the A grade 50% were similar.
Figure 12.
Comparison of publications output grading by different peer reviewers
We found a very weak correlation between publication scoring and any bibliometric indicator analyzed alone (with a linear correlation coefficient r always below 0,4). A similar low correlation was also reported by others (11). In our study, the linear correlation coefficient r for the number of publications in Nature or Science by a team and the publication grade was 0,204 and the linear correlation coefficient r for Top1+10% publications was 0,309.
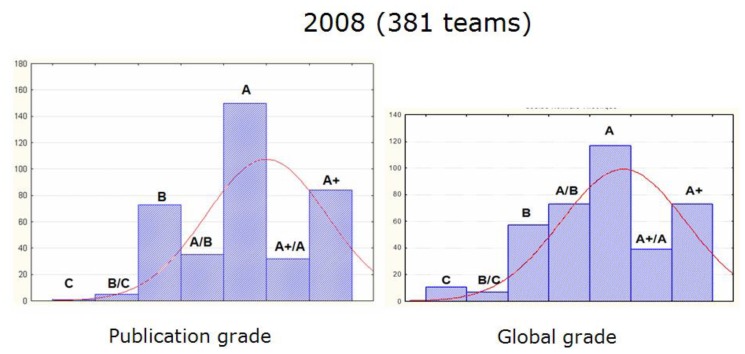
Several authors believe that the global judgment of a team by the committees is highly influenced by its publication output (Figure 13). We first evaluated the correlation between the publication scoring by Inserm scientific committees (CSS) and the global scoring. We found a correlation with a linear correlation coefficient r=0,776.
Figure 13.
Score frequency distribution for team publication output (publication grade) and global grade taking into account all evaluated items (output, project, leader notoriety, student training …)
No correlation between global grade and any bibliometric indicator alone was found.
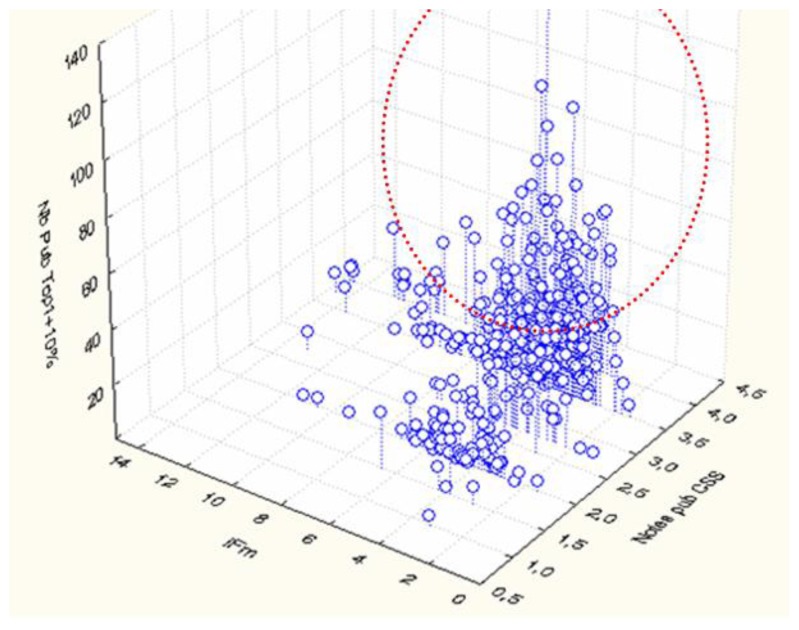
It must be emphasized that analysis of bibliometric indicator can not depend on one bibliometric indicator alone but must take into account several indicators to allow having an overall picture of the team output. If two indicators were analyzed as a function of publication grade we observed that (Figure 14, red circle) the highest grades were obtained by teams having highest impact factor and highest Top (1+10) publications.
Figure 14.
Global score (Notes ) as a function of mean IF values and the number of Top10% publications for each team (each circle represent one team)
In conclusion it should be emphasized that:
Each indicator has its advantages and its limitations, and care must be taken not to consider them as “absolute” indices.
They are complementary
The “convergence” of indicators has to be tested in order to put the information they convey into perspective
The use of bibliometric indicators requires a great vigilance but according to our experience they without any doubt enrich the committee’s debates.
However, despite the number of complaints lodged at peer review most scientists appear to believe in it. The literature is full of reports highlighting reviewers’ potential limitations and biases but researchers believe it is the best system and agree that it is the only way to evaluate them.
References
- 1.Nederhof AJ. Policy impact of bibliometric rankings of research performance of departments and individuals in economics. SCIENTOMETRICS. 2008 Jan;74 (1):163–174. [Google Scholar]
- 2.Junquera B, Mitre M. Value of bibliometric analysis for research policy: A case study of Spanish research into innovation and technology management. SCIENTOMETRICS. 2007 Jun;71(3):443–454. [Google Scholar]
- 3.Jansen D, Wald A, Franke K, Schmoch U, Schubert T. Third party research funding and performance in research. On the effects of institutional conditions on research performance of teams. KOLNER ZEITSCHRIFT FUR SOZIOLOGIE UND SOZIALPSYCHOLOGIE. 2007 Mar;59(1):125. [Google Scholar]
- 4.Simons K. The misused impact factor. SCIENCE. 2008 Oct 10;322(5899):165. doi: 10.1126/science.1165316. [DOI] [PubMed] [Google Scholar]
- 5.Cherubini P. Impact factor fever. SCIENCE. 2008 Oct 10;322(5899):191–191. doi: 10.1126/science.322.5899.191b. [DOI] [PubMed] [Google Scholar]
- 6.Garfield E. The history and meaning of the journal impact factor. JAMA-JOURNAL OF THE AMERICAN MEDICAL ASSOCIATION. 2006 Jan 4;295(1):90–93. doi: 10.1001/jama.295.1.90. [DOI] [PubMed] [Google Scholar]
- 7.Seglen PO. Why the impact factor of journals should not be used for evaluating research. BRITISH MEDICAL JOURNAL. 1997 Feb 15;314(7079):498–502. doi: 10.1136/bmj.314.7079.497. [DOI] [PMC free article] [PubMed] [Google Scholar]
- 8.Opthof T. Sense and nonsense about the impact factor. CARDIOVASCULAR RESEARCH. 1997 Jan;33(1):1–7. doi: 10.1016/s0008-6363(96)00215-5. [DOI] [PubMed] [Google Scholar]
- 9.Moed HF, vanLeeuwen TN. Impact factors can mislead. NATURE. 1996 May 16;381(6579):186–186. doi: 10.1038/381186a0. [DOI] [PubMed] [Google Scholar]
- 10.Hirsch JE. Does the h index have predictive power? PROCEEDINGS OF THE NATIONAL ACADEMY OF SCIENCES OF THE UNITED STATES OF AMERICA. 2007 Dec 4;104(49):19193–19198. doi: 10.1073/pnas.0707962104. [DOI] [PMC free article] [PubMed] [Google Scholar]
- 11.Aksnes DW, Taxt RE. Peer reviews and bibliometric indicators: a comparative study at a Norwegian university. RESEARCH EVALUATION. 2004 Apr;13(1):33–41. [Google Scholar]


