Abstract
Motivation: With the advancement of high-throughput techniques, large-scale profiling of biological systems with multiple experimental perturbations is becoming more prevalent. Pathway analysis incorporates prior biological knowledge to analyze genes/proteins in groups in a biological context. However, the hypotheses under investigation are often confined to a 1D space (i.e. up, down, either or mixed regulation). Here, we develop direction pathway analysis (DPA), which can be applied to test hypothesis in a high-dimensional space for identifying pathways that display distinct responses across multiple perturbations.
Results: Our DPA approach allows for the identification of pathways that display distinct responses across multiple perturbations. To demonstrate the utility and effectiveness, we evaluated DPA under various simulated scenarios and applied it to study insulin action in adipocytes. A major action of insulin in adipocytes is to regulate the movement of proteins from the interior to the cell surface membrane. Quantitative mass spectrometry-based proteomics was used to study this process on a large-scale. The combined dataset comprises four separate treatments. By applying DPA, we identified that several insulin responsive pathways in the plasma membrane trafficking are only partially dependent on the insulin-regulated kinase Akt. We subsequently validated our findings through targeted analysis of key proteins from these pathways using immunoblotting and live cell microscopy. Our results demonstrate that DPA can be applied to dissect pathway networks testing diverse hypotheses and integrating multiple experimental perturbations.
Availability and implementation: The R package ‘directPA’ is distributed from CRAN under GNU General Public License (GPL)-3 and can be downloaded from: http://cran.r-project.org/web/packages/directPA/index.html
Contact: jean.yang@sydney.edu.au
Supplementary Information: Supplementary data are available at Bioinformatics online.
1 INTRODUCTION
Pathway analysis has become a key approach to incorporate prior knowledge for interpreting ‘-omics’ scaled data generated from high-throughput techniques such as microarray, RNA-seq and quantitative mass spectrometry (MS)-based proteomics. It has the advantage of leveraging high dimensionality and limited replicates by organizing genes and proteins into groups and analyzing them in biological meaningful contexts (Nam and Kim, 2008).
To date, numerous pathway analysis approaches have been proposed (Emmert-Streib and Glazko, 2011) and several taxonomies have been described to categorize them (Ackermann and Strimmer, 2009; Goeman and Bühlmann, 2007; Huang et al., 2009; Irizarry et al., 2009). One of the popular categorization approaches is to classify pathway analysis methods as using an over-representation approach or aggregate score approach (Irizarry et al., 2009). The over-representation approach, exemplified by hypergeometric test using Gene Ontology (GO) (Khatri and Drăghici, 2005; Rivals et al., 2007), requires a pre-selected list of differentially expressed (DE) genes to be supplied before the test. It could be sensitive to the cut-off applied to select DE genes (Irizarry et al., 2009). The aggregate score approach, exemplified by gene set enrichment analysis (GSEA) (Mootha et al., 2003; Subramanian et al., 2005), alleviates this requirement by considering statistics associated with all genes for testing pathway differential regulation.
There are several recent extensions on pathway analysis. These include the extensions from univariate to multivariate statistics such as the use of Hotelling’s T2-statistics and N-statistics (Klebanov et al., 2007; Kong et al., 2006) and from single analysis to meta-analysis such as combining results from multiple studies (Shen and Tseng, 2010), different platforms (Poisson et al., 2011) and/or multiple methods (Väremo et al., 2013). Nevertheless, current pathway analysis methodologies are mainly designed for testing hypotheses in a 1D space and focus on identifying pathways that show up, down, either or mixed differential regulations. Due to the growing complexity of large-scale experiments where multiple treatments are applied, for example, to dissect the signalling networks, a novel pathway analysis approach that can incorporate multiple perturbations into a single statistical analysis is desirable.
The broad term experimental perturbations is used to describe any situation in which a cell has been agitated and its reaction quantified. Practically speaking when referring to multiple experimental perturbations, we may be referring to quantifying the effects of a treatment versus control at various cellular levels (DNA, RNA, protein). We could also consider multiple experimental perturbations to refer to various treatment comparisons at the same cellular level.
In this study, we propose direction pathway analysis (DPA) for integrating multiple perturbations in pathway analysis. This method integrates multiple experimental perturbations by coupling coordinate rotation with P-value combination techniques. It extends on traditional pathway analysis in the following aspects:
The method increases statistical power by integrating multiple perturbations for testing in a high-dimensional space.
The method improves biological interpretability by translating a biological question into a direction-specific test, broadening the hypothesis space and allowing many more biological questions to be investigated.
The method is flexible and can be extended to n-dimensions, where n is the number of experimental perturbations.
To demonstrate the effectiveness of P-value combination techniques at answering various alternative hypotheses, we designed and performed a set of simulation studies. These studies offer insight into the selection of an appropriate combination technique for DPA in integrating information on testing pathway enrichment.
To explore the utility of the method, we applied this approach to MS-based proteomics data obtained from adipocytes aiming to identify insulin action pathways under various treatments. Adipocytes are one of the major targets of insulin action in mammals. One of the major pathways downstream of the insulin receptor is the phosphatidylinositol-3-kinase (PI3K)-Akt pathway (Engelman et al., 2006; Manning and Cantley, 2007). To date, the majority of evidence points towards Akt alone being sufficient to elicit the majority of insulin’s intracellular actions (Ng et al., 2008). However, there are PI3K-dependent Akt-independent pathways that are activated by insulin stimulation (Choi et al., 2010) and it is possible that such pathways may also regulate protein trafficking events in response to insulin. To dissect PI3K-Akt pathways and determine the contributions of Akt-independent and Akt-dependent pathways, we used various pharmacological agents to target different signal transduction nodes and subsequently performed plasma membrane purification and SILAC-based (Ong et al., 2002) quantitative proteomic profiling (Ong and Mann, 2005). By analyzing the proteomic profile using DPA, we identified that several pathways were enriched in the plasma membrane following insulin stimulation, and that these trafficking events were strongly dependent on PI3K signalling. However, the translocation of these pathways was not fully blocked in the presence of an Akt inhibitor, suggesting that there are Akt-independent pathways that promote membrane trafficking events in response to insulin. We validated these findings through targeted analysis of several key proteins from these insulin-regulated pathways using immunoblotting and live cell microscopy.
2 MATERIALS AND METHODS
2.1 Direction pathway analysis
In this study, we propose a novel approach, called DPA, for a direction-specific pathway test (Fig. 1). Our approach consists of three main steps:
Rotating a matrix of test statistics such that large values of the test statistics provide evidence against the null hypothesis in favour of the alternative;
Combining the statistics across multiple experimental perturbations for each protein using a P-value combination method; and
Combining the statistics across proteins within a pathway using a P-value combination method.
The novelty of this approach is the concept of P-value rotation for testing pathways in a specific direction and the tandem application of P-value combination methods for integrating information across multiple experimental perturbations of each protein (protein level integration) and multiple proteins within a pathway (pathway level integration).
Fig. 1.
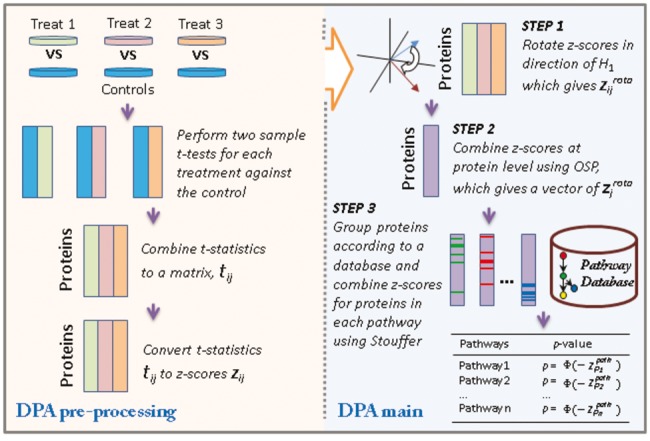
The workflow of DPA. The DPA pre-processing panel summarizes the combination and generation of a z-score matrix from multiple experimental perturbations. The DPA main panel summarizes the application of the rotation and integration steps to test for pathway significance
2.1.1 P-value combination
There are many methodologies for combining information across studies or within pathways and the key discriminating differences between many of these methods are their assumed alternative hypotheses (Tseng et al., 2012). Let  represent test statistics for
  , where n are the number of tests. Assume the null hypothesis that none features measured by these test statistics have changed (
 ,
,  ). Li and Tseng (2011) proposed to classify different alternative hypotheses into two broad classes HA and HB. Alternative hypothesis HA is used to detect a series of tests in which all the tests have changed (
 ). Alternative hypothesis HB is used to detect a series of tests in which any of the tests have changed (
 for at least one j in
  ).
).
For our DPA, we would like to identify pathways that have had any of their proteins changed in all experimental perturbations in the direction of interest. When put in the context of P-value combination, this would then require the tandem use of combination methods that favourable to testing H0 against HA when combining across experimental perturbations and H0 against HB when combining within a pathway, respectively. In our proposed DPA approach, we utilize Stouffer’s method (Stouffer et al., 1949) to combine within pathways. This is defined as
 |
where  is the cumulative distribution function for the standard normal distribution and for independent P-values pj,
  . To combine across experimental perturbations, we will use a one-sided version of Pearson’s method (Pearson, 1934), OSP, defined as
 |
This method is not that proposed by Pearson (1934) but is mentioned in later work (Pearson, 1938).
The combined P-values for Stouffer converge to zero if any one of the pj also converges to zero making it appropriate for testing H0 against the alternative HB. For OSP to converge to zero, all pj must converge to zero, thus making it appropriate for testing H0 against the alternative HA. To demonstrate the behaviour of the P-value combination methods and justify the selection of appropriate ones for our application, further explanation and a set of simulation studies were performed (see Section 1 of Supplementary File).
2.1.2 Rotation and combination
Our DPA takes as input three vectors of test statistics. The left panel of Figure 1 describes how these statistics may be generated and processed before performing the three main steps of DPA (the right panel of Fig. 1). This process is described more formally as follows. Define a matrix of test statistics  , where
  is the test statistic for the ith protein,
  , in one of three experimental perturbations,
  . Let tij correspond to the observed
  . These test statistics have most likely come from multiple two-sample t-tests but could be other statistics such as regression coefficients. We assume that a subset of these proteins belong to pathway
  , and that the
  are independent, which may not be the case in practice. The test statistics
  may not be identically distributed. They can be converted into identically distributed z-scores, zij, which are easier to manipulate by first evaluating their corresponding one-sided probabilities
  . The matrix of z-scores are then defined as
  , where
  .
.
DPA tests if any of the proteins in pathway  have deviated from the null hypothesis in the direction of the alternative hypothesis. A specific example may be written as
| (1) |
testing if any proteins in pathway  have been upregulated in the first perturbation, downregulated in the second perturbation and remain unchanged in the third perturbation. The three steps of rotation, combination at protein level and combination at pathway level are outlined in the right panel of Figure 1 and described in more detail in the following:
- Step 1. The matrix z is rotated such that large values within z provide evidence against the null hypothesis in favour of the alternative hypothesis. This is achieved as follows:
- Represent the direction of the alternative hypothesis using the unit vector
 where each element corresponds to the direction of interest in the experimental perturbation. If considering the example test described in Equation (1) then v would be defined as
  .
. - Represent the direction that we would like to rotate to as
 and calculate the angle between u and v as
  ).
). - Let
 , which is a vector that is orthogonal to u and v.
 - We can then define R as the matrix for a clockwise rotation around the vector a by an angle of θ as

(2) - We define
 as the rotated z-scores.
- Step 2.Now that the z-scores are orientated in the direction of interest, they can be combined across experimental perturbations to provide evidence that each protein is DE in the direction described by the alternative hypothesis H1. The rotated z-scores are combined using OSP for each protein to form the vectors
 and
and  as follows:
These protein significance values can then be converted back to z-scores by evaluating this combined P-value with respect to the upper tail of the normal distribution
(3) 
(4) - Step 3.We can then test if a pathway
 is differentially regulated in the direction described by the alternative hypothesis H1 using Stouffer’s method. The z-scores can be combined for each pathway as follows:
Significance can be calculated for each pathway by evaluating this combined z-score with respect to the upper tail of the normal distribution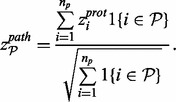
(5) 
(6)
2.2 Methods for quantifying insulin action in plasma membrane trafficking
We collected data generated from our previous study (Prior et al., 2011) and performed new proteomic profiling experiment in this study with additional treatments (Fig. 2). In the previous experiment, cultured 3T3-L1 fibroblasts were left unlabelled (‘light’), SILAC labelled with 13C6-arginine and 2H4-lysine (‘medium’) or 13C6-15N4-arginine and 13C6-15N2-lysine (‘heavy’). The cells cultured with 13C6-arginine and 2H4-lysine were stimulated with 100 nM insulin for 20 min and the cells cultured with 13C6-15N4-arginine and 13C6-15N2-lysine were treated with 100 nM wortmannin, a PI3K inhibitor, for 20 min before insulin stimulation. The unlabelled cell culture was left unstimulated to establish basal condition. In this study, a second set of plasma membrane proteomic profiling experiments were performed with a similar procedure as described earlier in text except that the ‘light’ cells were treated with 10 uM MK-2206, an Akt inhibitor (Tan et al., 2011), for 30 min before the stimulation of insulin (100 nM) for 20 min, ‘Medium’ cells were left unstimulated as basal condition and ‘Heavy’ cells were treated with 0.1% DMSO for 30 min before the addition of 100 nM insulin for 20 min. After establishing multiple treatments, cell lysates were mixed with ratio 1:1:1 in both sets of experiments, and subcellular fractionation were performed to enrich plasma membrane fraction. MS-based profiling was conducted using a LTQ-FT Ultra mass spectrometer and an Orbitrap Velos mass spectrometer (Thermo Fisher Scientific). The combined dataset was quantified using MaxQuant (Cox and Mann, 2008) and 997 proteins were quantified in all treatments.
Fig. 2.
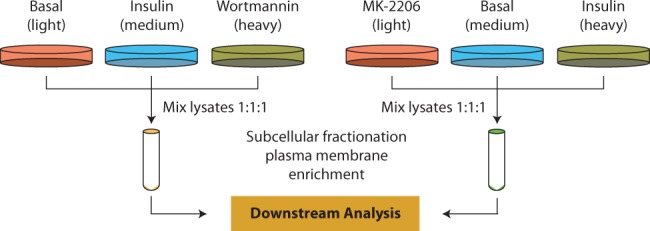
MS-based plasma membrane proteomic profiling and analysis. Two sets of SILAC-based quantitative proteomics were performed to quantify plasma membrane proteome level in basal condition, insulin stimulation, prior inhibition of PI3K using Wortmannin followed by insulin stimulation and prior inhibition of Akt using MK-2206 followed by insulin stimulation
For DPA analysis validation, key proteins prioritized by DPA were selected for immunoblotting and live cell microscopy. The extended experimental procedures can be found in Section 2 of Supplementary File.
3 RESULTS
3.1 Direction pathway analysis on insulin action in plasma membrane proteome trafficking
The PI3K-Akt pathway serves as a crucial channel for insulin-regulated processes in adipocytes. This pathway contains two key nodes; the lipid kinase PI3K (Engelman et al., 2006) and the protein kinase Akt (Manning and Cantley, 2007). Akt has been reported to phosphorylate numerous substrates to elicit the control over the numerous cellular processes regulated by insulin. While much of insulin’s actions are attributed to the combined action of the PI3K/Akt axis, little work has been done to establish the role of PI3K and/or Akt independent pathways in these processes.
DPA could be applied as an exploratory tool for dissecting the relative requirement for PI3K and Akt in the insulin response in pathways associated with plasma membrane proteome. To this end, we performed large-scale plasma membrane proteome quantification using a quantitative MS-based protoemics approach with SILAC labelling and subcellular fractionation. The PI3K and Akt nodes were pharmacologically inhibited using wortmannin (Arcaro and Wymann, 1993) or MK-2206 (Tan et al., 2011), respectively, before insulin stimulation, and the protein abundance on the cell plasma membrane were quantified according to the peak intensity from SILAC label. Let the test statistics  ,
,  and
and  represent the comparisons of basal condition to the treatment of (i) insulin alone; (ii) wortmannin before insulin; and (iii) MK-2206 before insulin, respectively, for the ith protein. With these panels of perturbations, we are interested in testing the following three scenarios described by Tests 1, 2 and 3:
- Test 1. A pathway
 enriched within the plasma membrane after insulin stimulation (‘>’) and this enrichment is reduced to a negative level by prior inhibition of PI3K (‘<’) but remain unaffected by Akt. These are PI3K-dependent, Akt-independent events.
with
(7) 
- Test 2. A pathway
 enriched within the plasma membrane after insulin stimulation and this enrichment is reduced to a negative level by prior inhibition of PI3K but only to the unstimulated level by Akt (‘
 ’). These are PI3K-dependent, partially Akt-dependent events.
with
(8)  .
. - Test 3. A pathway
 enriched within the plasma membrane after insulin stimulation and this enrichment is reduced to a negative level by prior inhibition of PI3K or Akt. These are PI3K-dependent, Akt-dependent events.
with
(9)  .
.
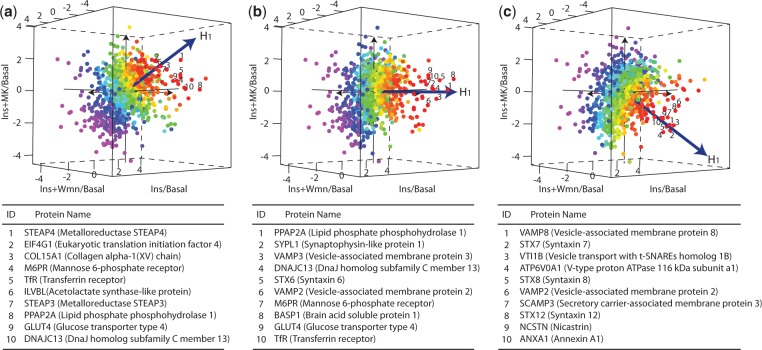
Note that by ‘reduced to a negative level’ we mean the inhibition not only blocks the insulin simulation but also removes any residual insulin effect compared with the unstimulated condition. Therefore, this effect is denoted as ‘<’. The hypotheses under testing in the aforementioned three scenarios are visualized in Figure 3.
Fig. 3.
Projections of plasma membrane proteome using DPA. A total of 997 proteins with quantitation in all treatments are coloured by their statistical significance calculated from OSP across perturbations on the tested directions. The red proteins are the most significant and purple are the least significant proteins. Plots (a–c) are the scatter plots of plasma membrane proteome from testing in the directions described by tests 1, 2 and 3, respectively. The top-10 proteins ranked on each direction are further listed below the scatter plots
At the individual protein level, DPA prioritizes proteins based on the z-score calculated from OSP across conditions (Fig. 3). The most significant proteins from the tests are coloured in red, whereas the least significant ones are in purple. The top ranked proteins are listed under the panel of each tested directions (Fig. 3). These proteins include Syntaxins (Syntaxin-6, Syntaxin-7, Syntaxin-8 and Syntaxin-12) and vesicle-associated membrane proteins (VAMP2, VAMP3 and VAMP8) from the family of SNARE proteins, as well as several other proteins known to localize with intracellular glucose transporter vesicles including GLUT4 itself and the transferrin receptor (TfR). Also highly ranked are the lipid phosphate phosphohydrolase 2 (PPAP2A) and lipid phosphate phosphohydrolase 3 (PPAP2B), which regulate the glycerolipid synthesis and have been reported to be involved in signal transduction at the plasma membrane (Nanjundan and Possmayer, 2001).
Interestingly, many pathways associated with vesicle trafficking and lipolysis are highly enriched described by Test 2 (Table 1). These include Proteolytic cleavage of SNARE complex proteins, clathrin derived vesicle budding, golgi associated vesicle biogenesis, membrane trafficking and lysosome vesicle biogenesis which are primarily associated with insulin-dependent glucose transport, the primary action of insulin in adipocytes. Two pathways, Sphingolipid metabolism and Triglyceride biosynthesis, are associated with lipolysis, a process that is also known to be regulated by the PI3K-Akt pathway in response to insulin stimulation. These results indicate that protein molecules from these pathways are enriched within the plasma membrane with insulin stimulation, and while the inhibition of PI3K using wortmannin significantly abolished their enrichment, the inhibition of Akt using MK-2206 only had a partial effect. This implies that while insulin actions are largely dependent on the canonical activation of PI3K and Akt, there may exist a PI3K-dependent, but Akt-independent branch of the insulin signalling that plays a significant but less dominant role in insulin-regulated protein trafficking. The complete list of pathways analysis results on the three tested directions is included in the Supplementary Table.
Table 1.
Significant pathways from Test 2 in insulin stimulated plasma membrane trafficking in adipocytes
| Pathway | Size | Probability | Rank | Associated functions |
|---|---|---|---|---|
| Proteolytic cleavage of SNARE complex proteins | 7 |  |
1 | Traffic and transport |
| Clathrin derived vesicle budding | 17 |  |
2 | Traffic and transport |
| Golgi associated vesicle biogenesis | 15 |  |
3 | Traffic and transport |
| Sphingolipid metabolism | 7 |  |
4 | Lipolysis |
| Membrane trafficking | 21 |  |
5 | Traffic and transport |
| Lysosome vesicle biogenesis | 9 | 0.003 | 6 | Traffic and transport |
| Triglyceride biosynthesis | 7 | 0.034 | 10 | Lipolysis |
Note: The size column indicates the number of identified and quantified proteins of a given pathway, and the rank column shows the rank of each pathway.
To experimentally validate the PI3K-dependent and partial Akt-dependent effect suggested by PDA analysis of plasma membrane proteome, several key proteins from these enriched pathways were selected for immunoblotting and live cell imaging.
3.2 Validating PI3K-dependent and partial Akt-dependent regulations
Using DPA, we discovered that many pathways associated with vesicle trafficking and glucose translocation in adipocytes are regulated by insulin in a PI3K-dependent and partially Akt-dependent manner. Here, we select several key proteins from these pathways to validate the results from DPA analysis.
3.2.1 Immunoblotting of trafficking proteins
Immunoblotting analysis demonstrated that the cytosolic protein tubulin was absent from the plasma membrane fraction, whereas a known plasma membrane protein cadherin was highly enriched (Fig. 4b). This confirms that the plasma membrane isolation method resulted in a pure membrane fraction. Compared with the loading control of 14-3-3, insulin treatment led to increased phosphorylation of Akt at pThr308 and its downstream substrates pThr642 AS160 and pSer246 PRAS40 (Fig. 4a). Pretreatment of cells with either the PI3K inhibitor wortmannin or the Akt inhibitor MK-2206 completely abolished Akt phosphorylation and its activity as demonstrated by complete diminution of substrate phosphorylation (Fig. 4a). These data indicate that these inhibitors completely block PI3K or Akt activity.
Fig. 4.
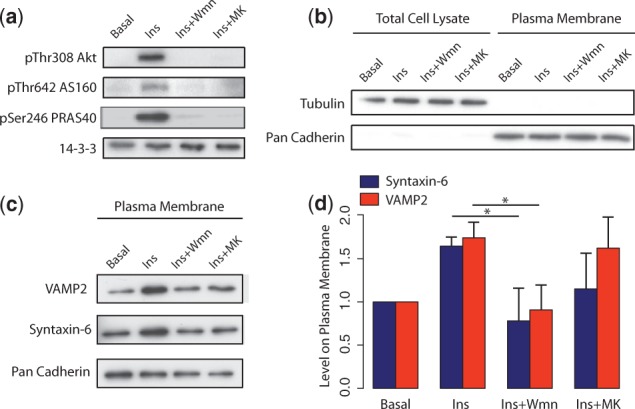
Immunoblotting of vesicle trafficking proteins. (a) Insulin stimulation and inhibitor efficacy control panel. (b) Plasma membrane isolation control panel. (c) Immunoblotting of Syntaxin-6 and VAMP2 proteins in plasma membrane fraction. (d) Bar graph represents densitometry quantification of the immunoblots normalized to that of cadherin. The entire experiments were repeated three times and the error bars represent the standard deviations in three experiments. 
To validate our observation from DPA results that many insulin-responsive trafficking events are PI3K-dependent, but partial Akt-dependent (Fig. 3), we chose two key vesicle trafficking proteins, Syntaxin-6 and VAMP2, for immunoblotting. Syntaxin-6 and VAMP2 are members of the SNARE family of proteins and are known to regulate GLUT4 trafficking in 3T3-L1 adipocytes (Perera et al., 2003; Zhao et al., 2009). As expected, insulin treatment increased plasma membrane levels of both Syntaxin-6 and VAMP2, and wortmannin treatment abolished the effect of insulin (Fig. 4c and d). In agreement with the DPA results from proteomics experiments, Syntaxin-6 and VAMP2 had higher levels at the plasma membrane when treated with the MK-2206 compared with wortmannin (Fig. 4c and d).
3.2.2 Live cell microscopy of transporter proteins
We next sought to further validate this phenomenon by using live cell microscopy. In adipocytes, one of the most physiologically important insulin responsive trafficking events is the translocation of the insulin-responsive glucose transporter type 4 (GLUT4) to the plasma membrane. The TfR has also been reported to traffick to the plasma membrane in an insulin-responsive manner. Both of two proteins ranked highly in our DPA results (Fig. 3a and b). Given an incomplete inhibition of the SNARE protein trafficking (e.g. Syntaxin-6 and VAMP2) to the plasma membrane in the presence of MK-2206, we next determined whether this pattern also held true for GLUT4 and TfR translocation events. We made use of a dual colour GLUT4 construct and TfR constructs (Burchfield et al., 2012) as read outs for GLUT4 and TfR translocation, respectively.
In the time course live cell microscopy experiment, insulin robustly increased GLUT4 and TfR plasma membrane levels (Fig. 5). Wortmannin completely inhibited insulin mediated GLUT4 translocation to the plasma membrane, whereas MK-2206 exhibited only partial inhibition (Fig. 5c). A similar trend was also observed for TfR translocation to the plasma membrane (Fig. 5d).
Fig. 5.
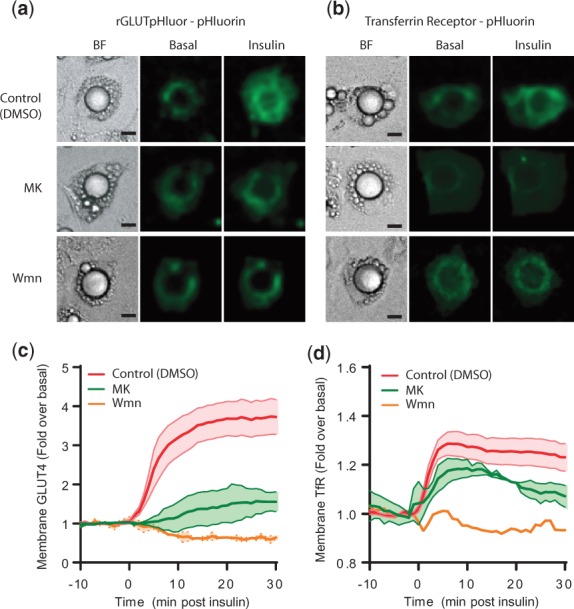
Microscopy of GLUT4 and TfR. (a and b) are images of 3T3-L1 adipocytes expressing either (a) rGLUTpHluor or (b) TfR-pH pre-treated with either DMSO (control), wortmannin, of MK-2206 before the insulin stimulation. Individual cells are shown before and 20 min after stimulation with insulin. Scale bar equals to 10 μm. (c and d). Time course of insulin stimulated changes in the PM levels of (c) GLUT4 and (d) TfR-pH pre-treated with either MK-2206, wortmannin or DMSO (control). Data represent the mean ± standard error from 3–5 experiments
4 CONCLUSION
In this study, we developed DPA for detecting biologically relevant pathways under multiple experimental perturbations. This method tests a hypothesis by rotating the test statistics and combining across both proteins and multiple experimental perturbations using P-value combination. Compared with traditional pathway analysis, DPA allows many more biological questions formulated as an alternative hypothesis and tested directly. We subsequently applied DPA to identify pathways that are significantly enriched at the plasma membrane in response to insulin stimulation and differentially inhibited by different inhibitors with the goal of dissecting insulin-regulated processes and their dependence on PI3K and Akt kinases. By examining a specific alternative hypothesis, we identified several key regulatory pathways to be plasma membrane enriched in a PI3K-dependent and partial Akt-dependent way. We then validated the key proteins in these pathways using immunoblotting and live cell microscopy techniques. Collectively, this study demonstrates the usefulness of the proposed DPA approach to aid the analysis of global datasets generated from experiments consisting of multiple perturbations. In this case, DPA helped identify and dissect the key signalling nodes of insulin regulation in adipocytes.
Funding: Australian Research Council (ARC) grants (FT0991918 and DP0984267 to Y.Y.) and by an National Health and Medical Research Council (NHMRC) program grant (to D.E.J.). D.E.J. is also recipient of an NHMRC Senior Principal Research. D.F. is a Sir Henry Wellcome Post-Doctoral Fellow of the Wellcome Trust.
Conflict of Interest: none declared.
Supplementary Material
REFERENCES
- Ackermann M, Strimmer K. A general modular framework for gene set enrichment analysis. BMC Bioinformatics. 2009;10:47. doi: 10.1186/1471-2105-10-47. [DOI] [PMC free article] [PubMed] [Google Scholar]
- Arcaro A, Wymann M. Wortmannin is a potent phosphatidylinositol 3-kinase inhibitor: the role of phosphatidylinositol 3, 4, 5-trisphosphate in neutrophil responses. Biochem. J. 1993;296(Pt. 2):297. doi: 10.1042/bj2960297. [DOI] [PMC free article] [PubMed] [Google Scholar]
- Burchfield J, et al. Novel systems for dynamically assessing insulin action in live cells reveals heterogeneity in the insulin response. Traffic. 2012;14:259–273. doi: 10.1111/tra.12035. [DOI] [PubMed] [Google Scholar]
- Choi SM, et al. Insulin regulates adipocyte lipolysis via an akt-independent signaling pathway. Mol. Cell. Biol. 2010;30:5009–5020. doi: 10.1128/MCB.00797-10. [DOI] [PMC free article] [PubMed] [Google Scholar]
- Cox J, Mann M. Maxquant enables high peptide identification rates, individualized ppb-range mass accuracies and proteome-wide protein quantification. Nat. Biotechnol. 2008;26:1367–1372. doi: 10.1038/nbt.1511. [DOI] [PubMed] [Google Scholar]
- Emmert-Streib F, Glazko G. Pathway analysis of expression data: deciphering functional building blocks of complex diseases. PLoS Comput. Biol. 2011;7:e1002053. doi: 10.1371/journal.pcbi.1002053. [DOI] [PMC free article] [PubMed] [Google Scholar]
- Engelman J, et al. The evolution of phosphatidylinositol 3-kinases as regulators of growth and metabolism. Nat. Rev. Genet. 2006;7:606–619. doi: 10.1038/nrg1879. [DOI] [PubMed] [Google Scholar]
- Goeman J, Bühlmann P. Analyzing gene expression data in terms of gene sets: methodological issues. Bioinformatics. 2007;23:980–987. doi: 10.1093/bioinformatics/btm051. [DOI] [PubMed] [Google Scholar]
- Huang D, et al. Bioinformatics enrichment tools: paths toward the comprehensive functional analysis of large gene lists. Nucleic Acids Res. 2009;37:1–13. doi: 10.1093/nar/gkn923. [DOI] [PMC free article] [PubMed] [Google Scholar]
- Irizarry R, et al. Gene set enrichment analysis made simple. Stat. Methods Med. Res. 2009;18:565–575. doi: 10.1177/0962280209351908. [DOI] [PMC free article] [PubMed] [Google Scholar]
- Khatri P, Drăghici S. Ontological analysis of gene expression data: current tools, limitations, and open problems. Bioinformatics. 2005;21:3587–3595. doi: 10.1093/bioinformatics/bti565. [DOI] [PMC free article] [PubMed] [Google Scholar]
- Klebanov L, et al. A multivariate extension of the gene set enrichment analysis. J. Bioinform. Comput. Biol. 2007;5:1139–1153. doi: 10.1142/s0219720007003041. [DOI] [PubMed] [Google Scholar]
- Kong S, et al. A multivariate approach for integrating genome-wide expression data and biological knowledge. Bioinformatics. 2006;22:2373–2380. doi: 10.1093/bioinformatics/btl401. [DOI] [PMC free article] [PubMed] [Google Scholar]
- Li J, Tseng G. An adaptively weighted statistic for detecting differential gene expression when combining multiple transcriptomic studies. Ann. Appl. Stat. 2011;5:994–1019. [Google Scholar]
- Manning B, Cantley L. Akt/pkb signaling: navigating downstream. Cell. 2007;129:1261. doi: 10.1016/j.cell.2007.06.009. [DOI] [PMC free article] [PubMed] [Google Scholar]
- Mootha V, et al. Pgc-1α-responsive genes involved in oxidative phosphorylation are coordinately downregulated in human diabetes. Nat. Genet. 2003;34:267–273. doi: 10.1038/ng1180. [DOI] [PubMed] [Google Scholar]
- Nam D, Kim S. Gene-set approach for expression pattern analysis. Brief. Bioinform. 2008;9:189–197. doi: 10.1093/bib/bbn001. [DOI] [PubMed] [Google Scholar]
- Nanjundan M, Possmayer F. Pulmonary lipid phosphate phosphohydrolase in plasma membrane signalling platforms. Biochem. J. 2001;358(Pt. 3):637. doi: 10.1042/0264-6021:3580637. [DOI] [PMC free article] [PubMed] [Google Scholar]
- Ng Y, et al. Rapid activation of akt2 is sufficient to stimulate glut4 translocation in 3t3-l1 adipocytes. Cell Metabol. 2008;7:348–356. doi: 10.1016/j.cmet.2008.02.008. [DOI] [PubMed] [Google Scholar]
- Ong S, Mann M. Mass spectrometry–based proteomics turns quantitative. Nat. Chem. Biol. 2005;1:252–262. doi: 10.1038/nchembio736. [DOI] [PubMed] [Google Scholar]
- Ong S, et al. Stable isotope labeling by amino acids in cell culture, silac, as a simple and accurate approach to expression proteomics. Mol. Cell. Proteomics. 2002;1:376–386. doi: 10.1074/mcp.m200025-mcp200. [DOI] [PubMed] [Google Scholar]
- Pearson E. The probability integral transformation for testing goodness of fit and combining independent tests of significance. Biometrika. 1938;30:134–148. [Google Scholar]
- Pearson K. On a new method of determining “goodness of fit”. Biometrika. 1934;26:425–442. [Google Scholar]
- Perera H, et al. Syntaxin 6 regulates glut4 trafficking in 3t3-l1 adipocytes. Mol. Biol. Cell. 2003;14:2946–2958. doi: 10.1091/mbc.E02-11-0722. [DOI] [PMC free article] [PubMed] [Google Scholar]
- Poisson L, et al. Integrative set enrichment testing for multiple omics platforms. BMC Bioinformatics. 2011;12:459. doi: 10.1186/1471-2105-12-459. [DOI] [PMC free article] [PubMed] [Google Scholar]
- Prior M, et al. Quantitative proteomic analysis of the adipocyte plasma membrane. J. Proteome Res. 2011;10:4970–4982. doi: 10.1021/pr200446r. [DOI] [PubMed] [Google Scholar]
- Rivals I, et al. Enrichment or depletion of a go category within a class of genes: which test? Bioinformatics. 2007;23:401–407. doi: 10.1093/bioinformatics/btl633. [DOI] [PubMed] [Google Scholar]
- Shen K, Tseng G. Meta-analysis for pathway enrichment analysis when combining multiple genomic studies. Bioinformatics. 2010;26:1316–1323. doi: 10.1093/bioinformatics/btq148. [DOI] [PMC free article] [PubMed] [Google Scholar]
- Stouffer S, et al. The American Soldier: Adjustment During Army Life. (Studies in Social Psychology in World War II, Vol. 1.) 1st edn. Princeton University Press; 1949. [Google Scholar]
- Subramanian A, et al. Gene set enrichment analysis: a knowledge-based approach for interpreting genome-wide expression profiles. Proc. Natl Acad. Sci. USA. 2005;102:15545–15550. doi: 10.1073/pnas.0506580102. [DOI] [PMC free article] [PubMed] [Google Scholar]
- Tan S, et al. Next-generation akt inhibitors provide greater specificity: effects on glucose metabolism in adipocytes. Biochem. J. 2011;435:539–544. doi: 10.1042/BJ20110040. [DOI] [PubMed] [Google Scholar]
- Tseng GC, et al. Comprehensive literature review and statistical considerations for microarray meta-analysis. Nucleic Acids Res. 2012;40:3785–3799. doi: 10.1093/nar/gkr1265. [DOI] [PMC free article] [PubMed] [Google Scholar]
- Väremo L, et al. Enriching the gene set analysis of genome-wide data by incorporating directionality of gene expression and combining statistical hypotheses and methods. Nucleic Acids Res. 2013;41:4378–4391. doi: 10.1093/nar/gkt111. [DOI] [PMC free article] [PubMed] [Google Scholar]
- Zhao P, et al. Variations in the requirement for v-snares in glut4 trafficking in adipocytes. J. Cell Sci. 2009;122:3472–3480. doi: 10.1242/jcs.047449. [DOI] [PubMed] [Google Scholar]
Associated Data
This section collects any data citations, data availability statements, or supplementary materials included in this article.


