
Figure 1.
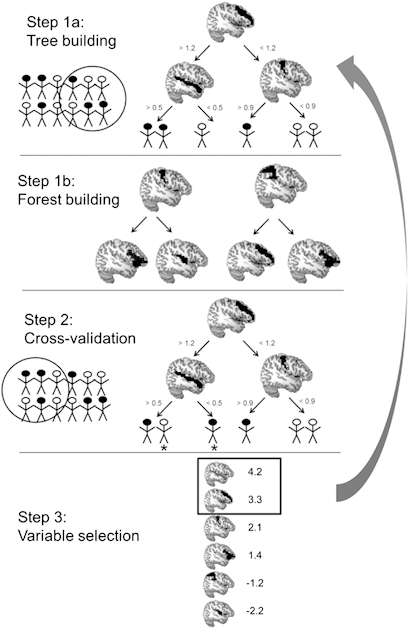
Random forest procedure. Step 1a is to build a decision tree based on a bootstrapped sample of participants (filled circles represent responders and open circles represent non-responders) and a random sample of predictor variables (eg, average activation in anatomically defined brain regions, arbitrary data shown). The random forest algorithm determines the optimal split point for each variable in order to correctly classify this subset of participants. Step 1b is to repeat this process hundreds or thousands of times to generate a forest of trees. In step 2, each tree classifies the participants that were not used in its original construction; each tree then ‘votes' for the classification of these participants, and these votes are aggregated to provide the predicted status of each participant and thereby determine accuracy. Figures marked with an asterisk (*) indicate inaccurately classified participants in this example. Step 3 is the identification of the most important variables for prediction. Brain regions are ranked in terms of their variable importance scores: only those with greater importance than the absolute value of the most negative importance rating are selected for the final model (arbitrary data shown). The variables selected for inclusion are then used as the sole input variables for another iteration of steps 1 and 2, generating the final model.