

Abstract
Background
Approximately 68 brands of azithromycin capsule formulations are available in Pakistan; however, published data on their bioequivalence in the Pakistani population are not available.
Objective
Upon instructions from and approval of the Ministry of Health, Pakistan, this study was designed to evaluate the bioequivalence of a locally manufactured azithromycin capsule formulation with a reference formulation from a multinational manufacturer. This study compared dissolution profiles, relative bioavailability, and other pharmacokinetic parameters of the 2 formulations.
Methods
A single oral 500-mg dose of the 2 formulations was administered to 12 healthy adult Pakistani male volunteers under fasting conditions in a randomized, open-label, 2-period crossover study. The trial included collection of blood samples over 48 hours and a 2-week washout period. Azithromycin serum concentrations were quantified using a validated RP-HPLC/ultraviolet (UV) detection method. These results were used to determine the intended pharmacokinetic parameters. As mandated by the US Food and Drug Administration and the European Medicine Agency, the test and reference formulations were considered bioequivalent if the 90% CIs of the geometric mean ratios for the log-transformed values of their pharmacokinetic parameters were within the predetermined range of 0.8 to 1.25.
Results
When subjected to a simple model independent approach of dissolution profile comparison, f1 (difference) and f2 (similarity factor) were found to be 5.47 and 70.04, respectively. Similarly, the 2 azithromycin capsule formulations were well tolerated by all volunteers. Low %CV of the pharmacokinetic parameters at a sample size of 12 and significance level of 0.05 contributed to acceptable (>0.8) power of the test. The 90% CIs for the ratios of Cmax, AUC0–48, Tmax, t1/2, and mean residence time, respectively, were 0.83–0.93, 0.85–1.10, 0.86–1.08, 0.92–1.17, and 0.92–1.16.
Conclusion
This single-dose study found that test and reference formulations met the regulatory criteria for bioequivalence in these fasted, healthy male Pakistani volunteers.
Key Words: azithromycin, bioequivalence, RP-HPLC/UV detection method, human serum, pharmacokinetics, quantification
Introduction
Azithromycin, the prototype of the azalide subclass of macrolides,1 has certain characteristics, including greater acid stability, which may enable superior absorption,2,3 greater tissue penetration, and a significantly longer t1/2, enabling once-daily dosing.2,4,5 It exhibits antibacterial activity against a number of gram-positive organisms, such as Staphylococcus aureus, Streptococcus agalactiae, Str. pyogenes, and Str. Pneumoniae, and gram-negative Haemophilus influenzae, Moraxella catarrhalis, and Chlamydia trachomatis.6
Bioequivalence is a term used in pharmacokinetics that describes the expected in vivo biological equivalence of 2 proprietary preparations of a drug. The US Food and Drug Administration (FDA) defines bioequivalence as “the absence of a significant difference in the rate and extent to which the active ingredient(s) in pharmaceutical equivalents or pharmaceutical alternatives become(s) available at the site of drug action when administered at the same molar dose under similar conditions in an appropriately designed study.”7 The need for bioequivalence studies became apparent after reports of digoxin,8 triamterene,9 and phenytoin10 toxicities resulting from minor changes in their formulations. Several approaches are considered for conducting bioequivalence studies, including both in vivo and in vitro methods; however, the pharmacokinetic approach is the most commonly used method. The reason might be that the primary aim of bioequivalence studies is to assess the rate and extent of drug absorption, which can be readily assessed by key pharmacokinetic parameters such as Cmax, Tmax, AUC, mean residence time (MRT), area under moment curve (AUMC), and t1/2.11,12
In Pakistan, most pharmaceutical products are manufactured at local pharmaceutical companies. These products are significantly more economical than that of multinational competitors. Local manufacturers may adversely modify a formulation by incorporating low-grade, less-expensive excipients to reduce production costs without affecting profit. Approximately 68 brands of azithromycin capsule formulations are available in Pakistan13; however, published data regarding their bioequivalence in the Pakistani population are not available. This study was designed, upon the instructions and approval of the Ministry of Health (MoH), Pakistan, to compare the bioequivalence of an azithromycin capsule formulation manufactured locally in the Khyber Pakhtunkhwa province with that of a reference formulation from a multinational manufacturer. This study compared their relative bioavailability and other pharmacokinetic parameters as recommended by the US FDA14 and the European Medicine Agency15 (EMEA) in healthy male Pakistani volunteers.
Methods
Formulations
The reference formulation⁎ and the test formulation† of azithromycin were 250-mg capsules. Of the 68 brands of the azithromycin capsule formulations available in Pakistan, only 5 are manufactured in the Khyber Pakhtunkhwa province. Thus, the test formulation was randomly selected from these 5 brands using a computer-based random number table after assigning them numbers from 1 to 5.
Assay and in Vitro Dissolution Studies
Five hundred capsules (50 strips) of the specified batches of the formulations were purchased locally, and the strips were numbered from 1 to 50. Out of the 50 strips, 20 strips were randomly selected using a computer-generated, random sample table. One capsule from each strip was selected and assayed for the active ingredient using the reversed phase high-performance liquid chromatography/ultraviolet (RP-HPLC/UV) detection method.
To evaluate the pharmaceutical equivalence of the test and reference products, dissolution test was performed using the US Pharmacopeia (USP) dissolution apparatus-II, paddle method according to the official monograph.16 Samples collected at various time intervals were analyzed using the RP-HPLC/UV detection method described later, and a simple model independent approach using the difference factor (f1) and the similarity factor (f2) was adopted to compare dissolution profiles. The f1 calculates the percent difference between the 2 curves at each time point and is the measure of the relative error between the 2 curves, whereas the f2 is a logarithmic reciprocal square root transformation of the sum of squared error and is the measure of the similarity in the percent of dissolution between the 2 curves. These factors were calculated using the following equations, respectively17,18:
where n is the number of time points, Rt is the dissolution value of the reference product at time t, and Tt is the dissolution value of the test product at time t.
where m is any time point and wj is an optional weight factor.
The specific procedure used to determine f1 and f2 began with determining the dissolution profile of the products (12 units each). The same procedure was adopted for the selection of the capsules as specified for the assay; however, 12 strips were randomly selected in this case. Using the mean dissolution values from both curves at each time interval, f1 and f2 were calculated using the aforementioned equations. For curves to be considered similar, f1 values should be close to 0, and f2 values should be close to 100. Generally, f1 values up to 15 (0–15) and f2 values ≥50 (50–100) ensure sameness or equivalence of the 2 curves and, thus, of the performance of the 2 products.17,18
Volunteers
This study was conducted according to the principles of the Declaration of Helsinki and its amendments.19 The study protocol was approved by the Ethical Committee of the Department of Pharmacy, University of Peshawar, Pakistan. The study objectives and the effects of drugs used in the study were explained to volunteers at the start of the study, and informed consent was obtained. Study volunteers were also compensated financially.
Healthy adult male volunteers (students of the Department of Pharmacy, University of Peshawar, Pakistan) aged ≥18 years were recruited for this study using the convenience sampling (sometimes known as grab or opportunity sampling) approach, a nonprobability sampling that involves the sample being drawn from the part of the population that is close at hand. A detailed medical history was obtained and a clinical examination was performed for all volunteers at the beginning of the study under the supervision of a qualified physician. In addition, 12-lead electrocardiography, complete blood count, blood pressure, blood sugar level, liver function tests, lipid profile, and renal function tests were also carried out in all study volunteers.
Persons with any systemic pathology such as diabetes mellitus; gastrointestinal, renal, hepatic, or cardiovascular disease; or recent surgery were not eligible for the study. Persons with abnormal clinical laboratory test values were also excluded. Similarly, persons with a history of allergic responses to any class of drugs were excluded from the study. Volunteers were prohibited from participation if they took any medicines or followed nonstandard diets at least 2 weeks before the start of the trial. An initial group of 16 healthy male volunteers were selected after providing informed consent. Each gave a medical history and underwent clinical examination and biochemical investigations. Four volunteers showed high liver function test values and were excluded from the study. The remaining 12 volunteers met all inclusion criteria. Demographic characteristics are shown in Table I.
Table I.
Demographic characteristics for volunteers enrolled in the study. Data are given as mean (SD); range.
| No. of Subjects | Demographic Characteristics |
||
|---|---|---|---|
| Age, y | Weight, kg | Height, in | |
| 12 | 25 (4); 20–30 | 66 (8); 55–74 | 65 (3); 61–69 |
Study Design and Drug Administration
Various bioequivalence parameters of the 2 products were assessed under fasting conditions in a randomized, open-labeled, balanced, 2-period, 2-treatment, 2-sequence, single-dose, crossover study with a 2-week washout period at the Department of Pharmacy, University of Peshawar, Pakistan.
Using a computer-based random number table, volunteers were randomly divided into 2 groups (group 1 and group 2), each consisting of 6 patients. During the first study period, patients in group 1 received a single oral 500-mg dose of the reference formulation, whereas patients from group 2 received the test formulation. In the second study period, the order was reversed. The scheme of the studies for the respective drugs is summarized in Table II. A nonblind approach was applied; both volunteers and investigators were aware of the formulations given to each group. For pharmacokinetic studies, capsules were also randomly selected using the same procedure as specified for the dissolution studies; however, 2 capsules were taken from each strip in this case.
Table II.
Study design for the bioequivalence evaluation of test⁎ and reference† azithromycin capsule formulations.
| Study Period | Group | Azithromycin Formulation Administered |
|---|---|---|
| First | 1 | Two capsules (500-mg dose) of azithromycin reference formulation |
| 2 | Two capsules (500-mg dose) of azithromycin test formulation | |
| 2-Week wash-out period | ||
| Second | 1 | Two capsules (500-mg dose) of azithromycin test formulation |
| 2 | Two capsules (500-mg dose) of azithromycin reference formulation |
Trademark: Ezill (Dr. Raza Pharma Pvt Ltd, Peshawar, Pakistan). Batch number 295, expiration 09/2011.
Trademark: Azomax (Novartis Pharma [Pakistan] Ltd, Karachi, Pakistan). Batch number J0003, expiration 05/2011.
All volunteers fasted for 8 hours before administration of the dose with 200 mL of water. They were not permitted to take any food for another 4 hours after ingestion of the dose; however, they ate a uniform breakfast, lunch, and dinner 4, 8, and 12 hours after drug administration, respectively.
Tolerability Assessment
Tolerability in volunteers was assessed before medication administration and every 2 hours during the study through physical examination, monitoring vital signs (temperature, blood pressure, heart rate, and respiratory rate) and interviewing them about adverse events that may be associated with the use of azithromycin (eg, headache, nausea, vomiting, abdominal cramps/pain, loose and/or bloody stools, allergic reactions, hearing problems, eye or vision problems, speaking and swallowing problems, and muscular weakness) under the supervision of a qualified physician.
Sample Collection and Processing
Venous blood samples (5 mL) were collected at 0 hour (ie, just before dosing) and at 0.5, 1, 2, 3, 4, 6, 8, 12, 24, and 48 hours following the administration of azithromycin capsules in gel and clot-activator tubes. After clotting, the serum was separated from the blood by centrifugation at 5000 rpm for 10 minutes at 0°C and stored at –80°C until analysis.
Analysis of Samples
Samples were analyzed by a validated RP-HPLC/UV detection method, discussed below.
Azithromycin standard was provided by Saydon Pharmaceuticals Pvt Ltd, Peshawar, Pakistan and roxithromycin was provided by Bryon Pharmaceuticals Pvt Ltd, Peshawar, Pakistan. HPLC-grade solvents such as triethylamine, acetonitrile, diethyl ether, and methanol and all other chemicals and reagents such as sodium hydroxide (NaOH) and potassium dihydrogen phosphate were purchased from Sigma-Aldrich (Oslo, Norway). Ultrapure water was prepared using a Millipore ultrapure water system (Billerica, Massachusetts). All these reagents and chemicals were used without further purification.
To prepare azithromycin and roxithromycin (internal standard) stock solutions, weighed amounts of each were dissolved in acetonitrile. Internal standard solution (to give a final concentration of 1.0 μg/mL), to be added to all standard solutions and serum samples, was then prepared by dilution of the corresponding stock solution with acetonitrile. Similarly, standard solutions of azithromycin in the range of 0.02 to 2.0 μg/mL (11 concentration levels), each containing 1.0 μg/mL of internal standard solution, were also prepared by dilution of the azithromycin stock solution. Similarly, standard solution containing 1.0 μg/mL each of azithromycin and internal standard (1:1 mixtures) was also prepared.
Liquid–liquid extraction was adopted for the sample preparation. At the time of analysis, the samples were thawed at room temperature and roxithromycin solution (1 μg/mL) used as the internal standard was vertex-mixed with 500 μL sample. These samples were then extracted with diethyl ether (3 × 5 mL). The organic layer was evaporated at approximately 60°C under a steam of nitrogen gas, the residues were dissolved again in mobile phase (500 μL), and 20 μL samples injected into the HPLC system.
Chromatographic separation of the samples was carried out on a Perkin Elmer (Norwalk, Connecticut) HPLC system equipped with a Series 200 pump, vacuum degasser, Peltier column oven, and UV-Vis detector and Rheodyne 7725i manual injector. The data were then analyzed on Perkin Elmer Totalchrom chromatography workstation (version 6.3.1.), interfaced with the HPLC hardware through network chromatography interface (NCI) 900. Analytes were separated using Kromasil 100 RP18 (250 × 4.6 mm, 5 μm; Thames Restek, Saunderton, United Kingdom) analytical column protected by a Bondapak RP18 (30 × 4.6 mm, 10 μm; Merck kGaA, Darmstadt, Germany) precolumn guard cartridge.
Analyses were performed at ambient temperature using acetonitrile-50 mM potassium dihydrogen phosphate buffer pH 7.00 (60:40 v/v) containing triethylamine (0.6 mL/L) as isocratic mobile phase pumped at a flow rate of 1.5 mL/min. The injection volume was kept at 20 μL, and the eluents were monitored at 205 nm. As noted, roxithromycin (at the level of 1.0 μg/mL) was used as the internal standard.
The chromatographic method was validated according to international guidelines, with emphasis on linearity within the expected concentration range, sensitivity, recovery, and precision.20
Sample concentrations, C, were calculated using the following formula:
where and are peak areas of the analyte in serum samples and 1:1 mixture, respectively; and are peak areas of the internal standard in serum samples and 1:1 mixture, respectively; is the concentration of analyte in the 1:1 mixture; and is the dilution factor.
Pharmacokinetics and Statistical Analyses
Serum concentrations of azithromycin at various time intervals following oral administration of the 2 products were determined for each volunteer and mean values were calculated. A noncompartment model, as proposed by Shargel and Yu,12 was used to access the following pharmacokinetic parameters: Cmax, Tmax, AUC0–t, AUMC, MRT, and t1/2. Cmax and Tmax were obtained directly from the concentration–time curve; AUC0–t was calculated using the linear trapezoidal method, and AUMC and MRT were also calculated using same data. Elimination rate constant (ke) was calculated by applying a log-linear regression analysis to at least the last 3 quantifiable azithromycin concentrations, and then t1/2 was calculated as 0.693/ke.12 All of these pharmacokinetic parameters were determined using the statistical package PK Solutions 2.0 (SummitPK, Montrose, Colorado).
Pharmacokinetic data for the 2 formulations were log-transformed before statistical analysis, which was based on the 90% CIs for the ratio of the geometric means for these log-transformed pharmacokinetic parameters of the 2 formulations (test/reference). If the 90% CIs for the ratios of Tmax, Cmax, and AUC0–48 values of the test and reference formulations fell within the range of 0.8 to 1.25, then these were considered bioequivalent, as recommended by the US FDA14 and the EMEA.15 The lower boundary (LB) and higher boundary (HB) of 90% CIs were calculated using the following equations21:
where MD is the mean difference and SD refers to the standard deviation of the transformed metric; n is the number of patients in the study; and t-value is 1.7959 for 12 patients.
The unpaired, or independent, samples t test was taken into account to test the null hypothesis of the bioequivalence at the 0.05 significance level using the statistical package Minitab 15.0 (Minitab Inc, State College, Pennsylvania). In addition to the appropriate 90% CIs for the comparison of the 2 formulations, summary statistics such as median, range (minimum and maximum values), and %CV were also calculated for pharmacokinetic parameters of interest.
Results
Assay and in vitro Dissolution Studies
The mean (SD) percentage of the active ingredient in the test and reference formulations was found to be 99% (2%) and 98% (1%), respectively.
Azithromycin mean in vitro drug release (dissolution) profiles of the test and reference capsule formulations were determined (Figure 1), and the data were subjected to a simple model independent approach of dissolution profile comparison. The f1 and the f2 were found to be 5.47 and 70.04, respectively (Table III).
Figure 1.
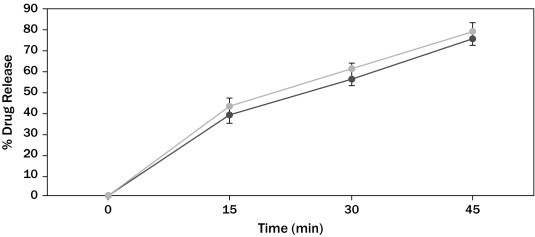
Azithromycin in vitro drug release profile of test (■) and reference (•) formulations. Each point represents mean (SD) of 12 capsules.
Table III.
Comparison of the dissolution profile of 2 azithromycin capsule formulations (n = 12, where n is the number of capsules tested of each formulation).
| Time (min) | Mean % Release |
Difference Factor (f1) | Similarity Factor (f2) | |
|---|---|---|---|---|
| Test Formulation | Reference Formulation | |||
| 0 | 0 | 0 | 5.47 | 70.04 |
| 15 | 39 | 43 | ||
| 30 | 56.6 | 61 | ||
| 45 | 76 | 79 | ||
f1 calculates the percent (%) difference between the 2 curves at each time point and is the measure of the relative error between the 2 curves; f2 is a logarithmic reciprocal square root transformation of the sum of squared error and is the measure of the similarity in the percent (%) dissolution between the 2 curves.
Tolerability
Both test and reference azithromycin capsule formulations were well tolerated by all patients in this study. No unexpected incidents occurred that influenced study outcomes, and all volunteers continued to study end and were discharged in good health.
Validation of the Analytical Method
The HPLC method developed for the quantification of azithromycin was linear in the range of 0.02 to 2 μg/mL. The correlation coefficients (r2) of all standard curves were more than 0.997 for serum samples (Figure 2). The lower limit of quantification was 20 ng/mL, and limit of detection was 5 ng/mL for azithromycin in serum. The mean percent recovery (n = 5 [where n is the number of samples tested]) was found to be >97% at the 2 nominal concentration levels. Results of the analysis repeatability and intermediate precision (intraday and interday reproducibility) reveal complete harmony among the repeated analyses and intraday and interday studies, as shown in Table IV.
Figure 2.
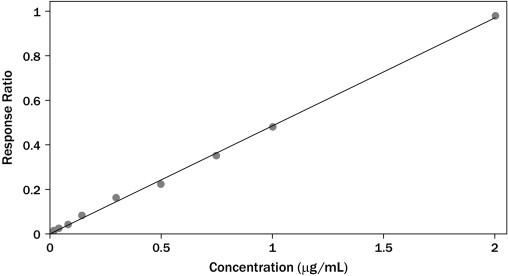
Calibration curve for azithromycin spiked in serum samples (y = 0.097x + 0.008; r2 = 0.997 [as in Table IV]). Each point is a mean of triplicate injections.
Table IV.
Recovery, precision, sensitivity, calibration range, and linearity of the developed method.
| Validation Parameters | Azithromycin Mean (SD); %RSD⁎ |
|---|---|
| Recovery | |
| 0.5 μg/mL† | 97 (1.58)‡; 1.63 |
| 1.0 μg/mL† | 98.4 (0.98)‡; 0.98 |
| Precision | |
| Repeatability | |
| Analysis repeatability | |
| 0.5 μg/mL§ | 0.491 (0.005)∥; 0.94 |
| Intermediate precision | |
| Intra-day reproducibility | |
| 0.25 μg/mL¶ | 0.247 (0.002)∥; 1.17 |
| 0.5 μg/mL¶ | 0.495 (0.005)∥; 1.01 |
| Inter-days reproducibility | |
| 0.25 μg/mL¶ | 0.245 (0.005∥; 2.04 |
| 0.5 μg/mL¶ | 0.491 (0.008)∥; 1.55 |
| Sensitivity | |
| Lower limit of quantification | 20 ng/mL |
| Limit of detection | 5 ng/mL |
| Calibration range | 0.02–2 μg/mL |
| Linearity | y = 0.097x + 0.008, r2 = 0.997 |
Percent (%) residual SD.
n = 5.
percent (%) of recovery.
n = 10.
quantity recovered in μg/mL.
n = 3.
Pharmacokinetics and Statistical Analyses
Azithromycin mean plasma concentration–time profiles after administration of the test and reference formulations in twelve Pakistani healthy volunteers are shown in Figure 3. Mean (SD) values of various pharmacokinetic parameters for the test and reference formulations, respectively, were Cmax, 0.34 (0.03) and 0.38 (0.04) μg/mL; AUC0-48, 2.75 (0.46) and 2.85 (0.48) μg·h/mL; AUMC, 36.90 (11.02) and 36.57 (9.14) μg·h/mL; t1/2, 9.20 (1.63) and 8.79 (1.02) h; Tmax, 2.83 (0.39) and 2.91 (0.29) h; MRT, 13.27 (2.35) and 12.68 (1.48) h. Similarly, the 90% CIs for the ratios of Cmax, AUC0–48, Tmax, MRT, and t1/2 for the 2 formulations, respectively, were 0.83–0.93, 0.85–1.10, 0.92–1.17, 0.86–1.08, 0.85–1.1, and 0.92–1.16, which, along with summary statistics such as median, range, and %CV, are given in Table V.
Figure 3.

Serum concentration versus time profile of azithromycin after 500-mg oral dose of test (⧫) and reference (•) formulations. Each point represents mean (SD).
Table V.
Pharmacokinetic parameters and 90% CIs* for the ratios of the geometric means of their log-transformed values for the 2 azithromycin capsule formulations (n = 12, where n is the number of volunteers).
| Pharmacokinetic Parameters | Test Formulation | Reference Formulation | P | T/R Point Estimate |
|---|---|---|---|---|
| Cmax (µg/mL) | ||||
| Mean (SD) | 0.34 (0.03) | 0.38 (0.04) | 0.06 | 0.88 |
| Range | 0.31–0.40 | 0.31–0.47 | 0.83–0.93* | |
| Median | 0.34 | 0.39 | ||
| %CV | 8.99 | 14.21 | ||
| Tmax (h) | ||||
| Mean (SD) | 2.83 (0.39) | 2.91 (0.29) | 0.56 | 0.97 |
| Range | 2.00–3.00 | 2.00–3.00 | 0.86–1.08* | |
| Median | 3.00 | 3.00 | ||
| %CV | 13.74 | 9.90 | ||
| AUC0–48 (h·µg/mL) | ||||
| Mean (SD) | 2.75 (0.46) | 2.85 (0.48) | 0.61 | 0.96 |
| Range | 2.00–3.76 | 2.14–3.55 | 0.85–1.10* | |
| Median | 2.72 | 2.87 | ||
| %CV | 16.74 | 16.26 | ||
| t1/2 (h) | ||||
| Mean (SD) | 9.20 (1.63) | 8.79 (1.02) | 0.47 | 1.05 |
| Range | 5.96–12.03 | 6.83–10.70 | 0.92–1.17* | |
| Median | 8.70 | 8.81 | ||
| MRT (h) | ||||
| Mean (SD) | 13.27 (2.35) | 12.68 (1.48) | 0.47 | 1.05 |
| Range | 8.60–17.35 | 9.85–15.5 | 0.92–1.16* | |
| Median | 12.55 | 12.70 | ||
| AUMC (h·µg/mL) | ||||
| Mean (SD) | 36.90 (11.02) | 36.57 (9.14) | 0.94 | – |
| Range | 23.98–61.34 | 21.08–50.82 | – | |
| Median | 33.31 | 36.76 |
AUMC = area under moment curve; CV = coefficient of variation; MRT = mean residence time; T/R = test/reference.
Discussion
Aspects of this study design, such as use of a single dose; recruitment of healthy volunteers from the Department of Pharmacy, University of Peshawar, Pakistan; fasting; and standardized meals limit generalizability of these results beyond the population studied and the study conditions; however, these were consistent with the regulatory guidelines14,15 to bring uniformity in the testing conditions for the 2 formulations.
Azithromycin was measurable from the second sampling time (0.5 hour) in almost all volunteers, assuming that both capsule formulations were readily absorbed from the gastrointestinal tract. All the calculated values for the pharmacokinetic parameters such as Cmax, Tmax, AUC0–48, AUMC, t1/2, and MRT were well within the range of previously reported values.22–28 Low variability (%CV) of the pharmacokinetic parameters Cmax, Tmax, and AUC0–48 at sample size of 12 and significance level of 0.05 contributed to acceptable (>0.8) power of the test. The mean values for Cmax, Tmax, AUC0–48, AUMC, MRT, and t1/2 of the 2 formulations did not differ significantly (P ≥ 0.05), suggesting that the serum profiles generated by the test formulation were not significantly different from those produced by the reference formulation.
The 90% CIs for the ratios of various pharmacokinetic parameters for the test and reference formulations were within the acceptable interval of 0.8–1.25 proposed by the regulatory authorities for bioequivalence.14,15 Similarly, the in vitro dissolution studies found that the formulations were pharmaceutically equivalent with respect to dosage form.
Conclusions
This single-dose study found that the test and reference azithromycin formulations met regulatory criteria for bioequivalence in the fasting healthy Pakistani male volunteers in this study. No statistically significant differences were found among in vitro dissolution profiles and relative bioavailability and various other pharmacokinetic parameters. The 90% CIs for the ratios of various pharmacokinetic parameters were also found to be within the proposed acceptance limits for bioequivalence. It was concluded, therefore, that the 2 azithromycin capsule formulations may be prescribed interchangeably.
Acknowledgments
All authors contributed equally to this study, which was sponsored by the MoH, Islamabad, the health regulatory authority of Pakistan. The Department of Pharmacy, University of Peshawar, Pakistan, was selected by MoH, Islamabad, to design and perform the bioequivalence study and to determine whether the azithromycin capsule formulations could be used interchangeably in the Pakistani population. The manufacturers and the sponsor were not involved in the planning, execution, or analysis of data or in the preparation and submission of this article. The authors have indicated that they have no other conflicts of interest regarding the content of this article.
Footnotes
Trademark: Azomax (Novartis Pharma [Pakistan] Ltd, Karachi, Pakistan). Batch number J0003, expiration 05/2011.
Trademark: Ezill (Dr. Raza Pharma Pvt Ltd, Peshawar, Pakistan). Batch number 295, expiration 09/2011.
References
- 1.Bright G., Nagel A., Bordner J. Synthesis, in vitro and in vivo activity of novel 9-deoxo-9a-AZA-9a-homoerythromycin A derivatives; a new class of macrolide antibiotics, the azalides. J Antibiot (Tokyo) 1988;41:1029–1047. doi: 10.7164/antibiotics.41.1029. [DOI] [PubMed] [Google Scholar]
- 2.Maskell J., Sefton A., Williams J. Comparative in-vitro activity of azithromycin and erythromycin against Gram-positive cocci, Haemophilus influenzae and anaerobes. J Antimicrob Chemother. 1990;25(Suppl A):19–24. doi: 10.1093/jac/25.suppl_a.19. [DOI] [PubMed] [Google Scholar]
- 3.Fiese E., Steffen S. Comparison of the acid stability of azithromycin and erythromycin A. J Antimicrob Chemother. 1990;25(Suppl A):39–47. doi: 10.1093/jac/25.suppl_a.39. [DOI] [PubMed] [Google Scholar]
- 4.Girard A., Girard D., English A. Pharmacokinetic and in vivo studies with azithromycin (CP-62,993), a new macrolide with an extended half-life and excellent tissue distribution. Antimicrob Agents Chemother. 1987;31:1948–1954. doi: 10.1128/aac.31.12.1948. [DOI] [PMC free article] [PubMed] [Google Scholar]
- 5.Foulds G., Shepard R., Johnson R. The pharmacokinetics of azithromycin in human serum and tissues. J Antimicrob Chemother. 1990;25(Suppl A):73–82. doi: 10.1093/jac/25.suppl_a.73. [DOI] [PubMed] [Google Scholar]
- 6.Retsema J., Girard A., Schelkly W. Spectrum and mode of action of azithromycin (CP-62,993), a new 15-membered-ring macrolide with improved potency against gram-negative organisms. Antimicrob Agents Chemother. 1987;31:1939–1947. doi: 10.1128/aac.31.12.1939. [DOI] [PMC free article] [PubMed] [Google Scholar]
- 7.Chen M., Shah V., Patnaik R. Bioavailability and bioequivalence: an FDA regulatory overview. Pharm Res. 2001;18:1645–1650. doi: 10.1023/a:1013319408893. [DOI] [PubMed] [Google Scholar]
- 8.Bramanti G., Mura P., Liguori A., Ceccarelli L. Pharmaceutical availability of digoxin tablets. Int J Pharmaceut. 1989;49:241–247. [Google Scholar]
- 9.Jackson K., Young D., Pant S. Drug-excipient interactions and their affect on absorption. Pharm Sci Technolo Today. 2000;3:336–345. doi: 10.1016/s1461-5347(00)00301-1. [DOI] [PubMed] [Google Scholar]
- 10.Tyrer J., Eadie M., Sutherland J., Hooper W. Outbreak of anticonvulsant intoxication in an Australian city. Br Med J. 1970;4:271–273. doi: 10.1136/bmj.4.5730.271. [DOI] [PMC free article] [PubMed] [Google Scholar]
- 11.Chow S.C., Liu J.P. 3rd ed. Chapman & Hall/CRC; Boca Raton, Fl: 2008. Design and Analysis of Bioavailability and Bioequivalence Studies. [Google Scholar]
- 12.Shargel L., Yu A.B.C. Appleton & Lange Norwalk; Stamford, Conn: 1999. Applied Biopharmaceutics and Pharmacokinetics. [Google Scholar]
- 13.Pharma Professional Services Azomax (Novartis Pharma [Pakistan]) http://www.druginfosys.com/AlterBrandResult.aspx?Code=2902 2010. Accessed January 15, 2010.
- 14.Food and Drug Administration (FDA) United States Department of Health and Human Services, FDA, Center for Drug Evaluation and Research (CDER); Rockville, Md: 2003. Guidance for industry: bioavailability and bioequivalence studies for orally administered drug products — general considerations. Revision 1. [Google Scholar]
- 15.European Medicines Agency (EMEA) Guideline on the investigation of bioequivalence [CPMP/EWP/QWP/1401/98] http://www.ema.europa.eu/docs/en_GB/document_library/Scientific_guideline/2009/09/WC500003011.pdf London, UK; 2008. Accessed April 14, 2011.
- 16.Costa P. An alternative method to the evaluation of similarity factor in dissolution testing. Int J Pharm. 2001;220:77–83. doi: 10.1016/s0378-5173(01)00651-2. [DOI] [PubMed] [Google Scholar]
- 17.Shah V., Tsong Y., Sathe P., Liu J. In vitro dissolution profile comparison—statistics and analysis of the similarity factor, f2. Pharm Res. 1998;15:889–896. doi: 10.1023/a:1011976615750. [DOI] [PubMed] [Google Scholar]
- 18.Liu J., Ma M., Chow S. Statistical evaluation of similarity factor f2 as a criterion for assessment of similarity between dissolution profiles. Drug Inform J. 1997;31:1255–1271. [Google Scholar]
- 19.World Medical Association WMA declaration of Helsinki – ethical principles for medical research involving human subjects; 2008. http://www.wma.net/en/30publications/10policies/b3/ [updated 2008; cited 2010] Accessed April 14, 2011.
- 20.Epshtein N. Validation of HPLC techniques for pharmaceutical analysis. Pharm Chemistry J. 2004;38:212–228. [Google Scholar]
- 21.Balthasar J.P. Bioequivalence and bioequivalency testing. Am J Pharm Educat. 1999;63:194–198. [Google Scholar]
- 22.Boonleang J., Panrat K., Tantana C. Bioavailability and pharmacokinetic comparison between generic and branded azithromycin capsule: a randomized, double-blind, 2-way crossover in healthy male Thai volunteers. Clin Ther. 2007;29:703–710. doi: 10.1016/j.clinthera.2007.04.010. [DOI] [PubMed] [Google Scholar]
- 23.Barrett B., Bo ek-Dohalský V., Fejt P. Validated HPLC–MS–MS method for determination of azithromycin in human plasma. Anal Bioanal Chem. 2005;383:210–217. doi: 10.1007/s00216-005-0018-5. [DOI] [PubMed] [Google Scholar]
- 24.Fang A., Palmer J., Chiu A. Pharmacokinetics of azithromycin in plasma and sinus mucosal tissue following administration of extended-release or immediate-release formulations in adult patients with chronic rhinosinusitis. Int J Antimicrob Agents. 2009;34:67–71. doi: 10.1016/j.ijantimicag.2009.01.014. [DOI] [PubMed] [Google Scholar]
- 25.Ehnhage A., Rautiainen M., Fang A., Sanchez S. Pharmacokinetics of azithromycin in serum and sinus fluid after administration of extended-release and immediate-release formulations in patients with acute bacterial sinusitis. Int J Antimicrob Agents. 2008;31:561–566. doi: 10.1016/j.ijantimicag.2008.01.027. [DOI] [PubMed] [Google Scholar]
- 26.Piñeyro-López A., Pineyro-Garza E., Torres-Alanís O. Bioavailability of two oral formulations of azithromycin 500 mg: a randomized, open-label, two-period crossover comparison in healthy Mexican adult subjects. Clin Ther. 2005;27:1607–1611. doi: 10.1016/j.clinthera.2005.10.002. [DOI] [PubMed] [Google Scholar]
- 27.Solans A., Izquierdo I., Donado E. Pharmacokinetic and safety profile of rupatadine when coadministered with azithromycin at steady-state levels: a randomized, open-label, two-way, crossover, Phase I study. Clin Ther. 2008;30:1639–1650. doi: 10.1016/j.clinthera.2008.09.002. [DOI] [PubMed] [Google Scholar]
- 28.Ren J., Jiang X.H., Li K. Bioequivalence of two formulations of a single oral dose of 500-mg azithromycin granules: a randomized, open-label, two-period crossover study in healthy Han Chinese volunteers. Curr Ther Res. 2007;68:369–377. doi: 10.1016/j.curtheres.2007.10.005. [DOI] [PMC free article] [PubMed] [Google Scholar]