

Summary
Background
Type 1 diabetes (T1D) results from autoimmune targeting of the pancreatic beta cells, likely mediated by effector memory T cells (Tems). CD2, a T cell surface protein highly expressed on Tems, is targeted by the fusion protein alefacept, depleting Tems and central memory T cells (Tcms). We hypothesized that alefacept would arrest autoimmunity and preserve residual beta cells in newly diagnosed T1D.
Methods
The T1DAL study is a phase II, double-blind, placebo-controlled trial that randomised T1D patients 12-35 years old within 100 days of diagnosis, 33 to alefacept (two 12-week courses of 15 mg IM per week, separated by a 12-week pause) and 16 to placebo, at 14 US sites. The primary endpoint was the change from baseline in mean 2-hour C-peptide area under the curve (AUC) at 12 months. This trial is registered with ClinicalTrials.gov, number NCT00965458.
Findings
The mean 2-hour C-peptide AUC at 12 months increased by 0.015 nmol/L (95% CI -0.080 to 0.110 nmol/L) in the alefacept group and decreased by 0.115 nmol/L (95% CI -0.278 to 0.047) in the placebo group, which was not significant (p=0.065). However, key secondary endpoints were met: the mean 4-hour C-peptide AUC was significantly higher (p=0.019), and daily insulin use and the rate of hypoglycemic events were significantly lower (p=0.02 and p<0.001, respectively) at 12 months in the alefacept vs. placebo groups. Safety and tolerability were comparable between groups. There was targeted depletion of Tems and Tcms, with sparing of naïve and regulatory T cells (Tregs).
Interpretation
At 12 months, alefacept preserved the 4-hour C-peptide AUC, lowered insulin use, and reduced hypoglycemic events, suggesting a signal of efficacy. Depletion of memory T cells with sparing of Tregs may be a useful strategy to preserve beta cell function in new-onset T1D.
Introduction
Type 1 diabetes (T1D) is a T cell-mediated autoimmune disorder that targets the insulin-secreting beta cells in the islets of Langerhans.(1) Disease onset usually occurs in childhood or adolescence, and T1D patients require lifelong therapy with exogenous insulin and are at substantial risk for increased morbidity and mortality. At diagnosis, significant islet function remains, and in the absence of active destruction residual beta cells may be salvageable.(1) Even modest endogenous insulin production may significantly improve long-term outcomes.(2)
Although trials in the 1980s and 1990s suggested that non-specific immune suppressants (e.g. cyclosporine) may slow progression or even reverse T1D while on therapy, the risks of life-long immune therapy outweighed the benefits.(3-5) Over the past two decades, more-selective immunomodulatory agents with lower risk profiles have been developed, but while effective in certain autoimmune diseases, to date trials of these agents in T1D have shown either no efficacy or efficacy of limited duration or only in a subgroup of patients.(6-12)
In T1D, effector T cells are directly involved in beta cell destruction.(1) CD2 is a surface protein expressed on most human T cells, but expression is highest on effector memory (Tem) and central memory (Tcm) T cells, and most prominently on highly pathogenic “armed” effector T cells.(13, 14) The endogenous ligand in humans is CD58 (LFA3), found primarily on antigen presenting cells. Alefacept (LFA3-Ig) is a dimeric fusion protein that was the first biologic FDA-approved for moderate to severe plaque psoriasis.(15) Clinical response in psoriasis is improved with repeated courses, resulting in a proportion of patients achieving sustained remissions even following drug discontinuation.(16-19) The mechanism of action includes blocking T cell costimulation and granzyme-induced T cell depletion mediated by NK cells and monocytes.(20) From psoriasis clinical trials, alefacept primarily depletes Tems and to a lesser extent Tcms, consistent with expression of CD2;(14, 21, 22) effects on regulatory T cells (Tregs) have not been studied.
In the T1DAL (Inducing Remission in New-Onset Type 1 Diabetes with Alefacept) trial we tested the hypothesis that treating patients with newly diagnosed T1D with alefacept will target pathogenic effector T cells, arrest further beta cell destruction, and stabilize endogenous insulin production.
Methods
Study design and patients
This is a phase II, multicenter, randomized, placebo-controlled, double-blind clinical trial in which participants with newly diagnosed T1D received two 12-week courses of alefacept separated by a 12-week pause, or matching placebo, with the primary endpoint at 12 months and continued follow-up to 24 months. The protocol and consent documents were approved by independent institutional review boards. All participants or parents provided written informed consent, and those younger than 18 years provided assent. An independent data and safety monitoring board (DSMB) conducted regular safety reviews. The study is registered with ClinicalTrials.gov, number NCT00965458.
Screening, enrollment, and subsequent study visits occurred at 14 participating clinical centers in the USA. For the first 10 subjects, enrollment was confined to subjects 16-35 years of age. The age was subsequently lowered to 12 following review by the DSMB. Eligible participants were 12-35 years of age at time of screening; <100 days from diagnosis at the time of enrollment; positive for at least one diabetes-associated autoantibody (microassayed insulin if duration of insulin therapy was <10 days; glutamic acid decarboxylase-65 (GAD-65); tyrosine phosphatase-related islet antigen 2 (IA-2); zinc transporter 8 (ZnT8); or islet-cell (ICA) autoantibodies); and peak stimulated C-peptide of > 0.2 nmol/L during a mixed meal tolerance test (MMTT). Exclusion criteria included any serological or clinical evidence of infection; a positive PPD test; past infection with hepatitis B, C or HIV, or clinically active infection with EBV, CMV, or tuberculosis; significant past cardiac disease or malignancy; leukopenia, lymphopenia, thrombocytopenia, or anemia; history of bone marrow transplantation or autoimmune disease associated with lymphopenia; known hypersensitivity to human monoclonal antibodies; liver or renal dysfunction; ongoing use of diabetes medications other than insulin, or past or current treatment with immune modulators; inoculation with a live vaccine within 6 weeks before enrollment; and females who were lactating, pregnant, or unwilling to defer pregnancy.
Randomisation and enrollment
Eligible subjects were randomly assigned 2:1 to alefacept or placebo. The site-stratified randomisation scheme was computer generated at the data coordinating center using permuted-blocks of size 3. Site personnel randomised subjects via an interactive web-based system, which sent the treatment assignments directly to the unmasked site pharmacists. All subjects and site personnel, including the independent diabetes educators, remained masked throughout the study. Site personnel were masked to total lymphocyte, CD4 and CD8 counts on lab reports unless CD4 counts decreased to < 250 cells/μL.
Procedures
Participants were brought into the sites' outpatient clinical trial centers to receive the first dose of 15 mg alefacept (Amevive®) or equivalent volume of placebo (saline) intramuscularly and observed for 30 min. The participants returned to study sites for weekly injections (alefacept 15 mg or placebo) for a further 11 doses. After a 12-week pause, participants returned weekly for an additional 12 doses of alefacept or placebo. The total dosing period was 36 weeks.
Patients underwent a 4-hour MMTT at screening and 52 weeks and a 2-hour MMTT at 24 weeks. All subjects received intensive diabetes management with the goal to achieve ADA HbA1c and glycemic targets for age.
Laboratory tests
Biochemical autoantibody titers were assayed at the Barbara Davis Center (Aurora, CO) using radioimmunobinding assays, and ICA was measured at the University of Florida. C-peptide and HbA1c were measured at the Northwest Lipid Research Laboratory (Seattle, WA). Chemistries, hematology, and viral load and serology were performed at a central lab (ICON Central Labs, Farmingdale, NY); total lymphocyte, CD4+, and CD8+ counts were determined real-time on a FACS Canto II flow cytometer (BD Biosciences, San Jose, CA).
Immunophenotyping
PBMCs were frozen for batched analysis after the month-12 endpoint. Multicolor flow cytometry was conducted at the Benaroya Research Institute (Seattle, WA) on an LSR II flow cytometer (BD Biosciences, San Jose, CA), and manual sequential gating was done in Flowjo (TreeStar Inc., Ashland, OR). Details of antibody panel configurations and definitions of T cell subpopulations are given in supplementary table 1.
Outcomes
The primary endpoint analysis was the change in the mean 2-hour C-peptide area under the curve (AUC) from baseline to 12 months, adjusted for the baseline C-peptide response. Pre-specified secondary outcomes included the change in mean 4-hr C-peptide AUC from baseline to 12 months; changes of mean C-peptide AUC over time to month 12; insulin use at month 12; hypoglycemic events; HbA1c levels at month 12; and frequency and severity of adverse events in the alefacept vs. placebo groups.
Statistical analysis
All randomised subjects who received any dose of study treatment (n=49) were used in the intention to treat (ITT) analysis for the primary endpoint. Seven subjects in the ITT population did not have an MMTT at month 12 (3 alefacept, 4 placebo). Per protocol, missing month-12 (but not month-6) 2-hour C-peptide AUC data were imputed as described in the Supplementary Methods. For the primary inferential analysis on the primary endpoint, C-peptide AUC values were transformed to ln(AUC+1). To compare treatment groups, an analysis of covariance model was fit with change from baseline as the outcome and baseline ln(AUC+1) value as a covariate. Means and summary statistics are presented on the untransformed scale. Adjusted means were based on models fit to untransformed AUC values.
Sensitivity analyses for the 2-hour C-peptide AUC and secondary analyses on the 4-hour C-peptide AUC were performed using the methods described for the primary endpoint (see Supplementary Methods); missing 4-hour C-peptide AUC values were imputed as for the primary endpoint. Secondary inferential analyses on HbA1c and insulin-use were based on ANCOVA models at each time point with adjustment for baseline levels. Fisher's exact test was used to compare the number of subjects who were insulin independent and who had a hypoglycemic event at month 12. Flow cytometry data were log-transformed, analyzed by repeated measures ANOVA, and P-values calculated to compare the differences of least square means between treatment groups at every visit. For any secondary and exploratory analyses, corrections were not made for multiple comparisons. SAS version 9.2 was used for all data analyses.
Power and sample size
The 12-month geometric mean 2-hour C-peptide AUC in the control group was assumed to be 0.384 nmol/L.(23) After transformation, the ln(AUC+1) value in the control group is ln(0.384+1) = 0.325 with root mean square error (RMSE) = 0.154. It was assumed the RMSE will be the same in the control and active arms. With 2:1 randomization and a two-sided t-test with a significance level of 5%, a sample size of 66 provided 85% power to detect a 50% improvement of alefacept over control, allowing for a loss of 10%. Enrollment was halted at 49 after the manufacturer voluntarily withdrew alefacept from the US market.(24) Under the same assumptions, power dropped to 80% to detect a 55% improvement.
Role of the funding source
The Immune Tolerance Network, supported in part by National Institute of Allergy and Infectious Disease (NIAID) and the National Institute for Diabetes and Digestive and Kidney Disease (NIDDK) of the US National Institutes of Health (NIH) and Juvenile Diabetes Research Foundation (JDRF), was responsible for study design, data collection, analysis, and decision to submit the manuscript. Astellas Pharma Global Development, Inc. (Northbrook, IL) provided drug for this study and was not involved in the development, design or implementation of the trial or the interpretation of the results. The writing team had full access to all of the data and had final responsibility for submission of the manuscript for publication.
Results
Enrollment, randomization, and retention
Between March 2011 and March 2012, 73 subjects were screened, assessed for eligibility and enrolled into the trial (figure 1). Final enrolment was curtailed at 49 because of a voluntary withdrawal of alefacept by the manufacturer in December 2011.(24) Demographic and baseline characteristics were comparable between the alefacept and placebo groups (table 1), with the exception of peak and 2-hour AUC C-peptide, which trended higher in the alefacept group (p=0.086 and 0.076, respectively). The last patient completed the 12-month follow-up in March 2013.
Figure 1. Alefacept trial profile.
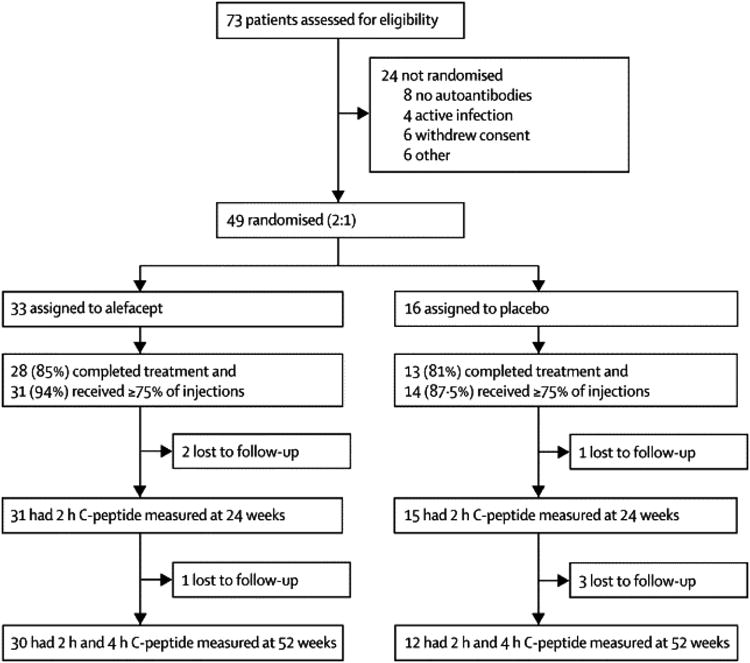
Table 1. Baseline demographics and laboratory characteristics of T1DAL participants.
| Alefacept (N = 33) n (%) |
Placebo (N = 16) n (%) |
|
|---|---|---|
| Age (years) | ||
| n | 33 | 16 |
| Mean (SD) | 20.30 (6.410) | 19.50 (6.154) |
| Median | 18.0 | 17.5 |
| Min, Max | 12.0, 34.0 | 13.0, 32.0 |
| Age Group | ||
| 12-15 | 6 (18.2) | 6 (37.5) |
| 16-35 | 27 (81.8) | 10 (62.5) |
| Female | 16 (48.5) | 4 (25.0) |
| Primary Race | ||
| White | 32 (97.0) | 16 |
| Other | 1 (3.0) | 0 |
| Ethnicity | ||
| Not Hispanic or Latino | 30 (90.9) | 15 (93.8) |
| Hispanic/Unknown | 3 (9.1) | 1 (6.3) |
| Height (cm) | ||
| n | 30 | 14 |
| Mean (SD) | 170.65 (12.505) | 175.13 (11.325) |
| Median | 170.6 | 174.1 |
| Min, Max | 144.3, 191.5 | 152.0, 190.3 |
| Weight (kg) | ||
| n | 33 | 16 |
| Mean (SD) | 69.16 (20.891) | 68.46 (14.992) |
| Median | 65.3 | 67.0 |
| Min, Max | 38.3, 123.0 | 37.7, 92.1 |
| BMI (kg/m2) | ||
| n | 30 | 14 |
| Mean (SD) | 23.47 (4.970) | 22.05 (4.204) |
| Median | 22.5 | 20.6 |
| Min, Max | 15.6, 37.4 | 16.3, 32.3 |
| 2-Hour C-peptide AUC (nmol/L) | ||
| n | 33 | 16 |
| Mean (SD) | 0.85 (0.425) | 0.64 (0.223) |
| Median | 0.7 | 0.6 |
| Min, Max | 0.3, 1.9 | 0.2, 1.1 |
| 4-Hour Peak C-peptide (nmol/L) | ||
| n | 33 | 16 |
| Mean (SD) | 1.13 (0.542) | 0.88 (0.302) |
| Median | 1.0 | 0.9 |
| Min, Max | 0.3, 2.5 | 0.3, 1.7 |
| HbA1c (%) | ||
| n | 33 | 16 |
| Mean (SD) | 7.18 (1.464) | 7.13 (1.506) |
| Median | 7.2 | 6.3 |
| Min, Max | 4.8, 12.2 | 5.7, 11.4 |
| Insulin Use (Units/kg/day) | ||
| n | 32 | 14 |
| Mean (SD) | 0.33 (0.196) | 0.29 (0.174) |
| Median | 0.3 | 0.3 |
| Min, Max | 0.0, 0.8 | 0.0, 0.7 |
Primary efficacy outcome
The alefacept group had a mean increase of 0.015 nmol/L (95% CI -0.080 to 0.110) in the 2-hr C-peptide AUC at 12 months whereas the placebo group had a mean decrease of 0.115 nmol/L (95% CI -0.278 to 0.047; figure 2A). After adjustment for baseline C-peptide, the difference between treatment groups was not significant (p=0.065). Secondary analyses included gender and age as covariates (no significant effect) and three sensitivity analyses performed on the primary endpoint: no imputation, observed data only (N=42, p=0.183); optimistic imputation (p=0.018); and conservative imputation (p=0.208, see Supplemental Methods).
Figure 2. Population means of change in stimulated C-peptide AUC mean from baseline to 12 months for alefacept and placebo treated subjects.
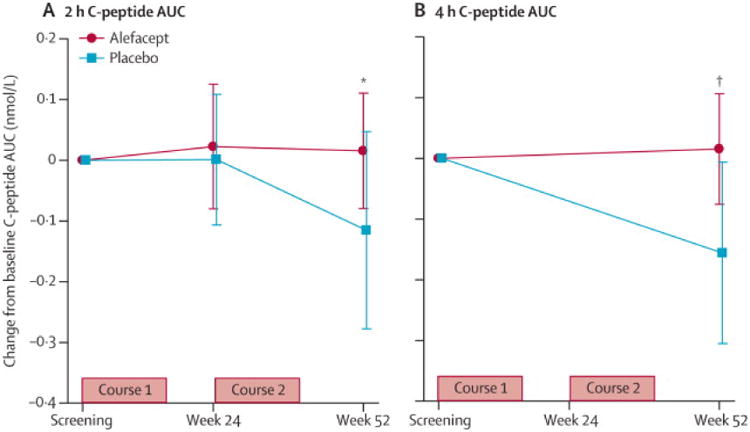
(A) 2-hour AUCs (primary endpoint). (B) 4-hour AUCs (secondary endpoint). Bars represent 95% confidence intervals. P values were calculated using an analysis of covariance with baseline ln(AUC+1) value as a covariate.
Secondary efficacy outcomes
Analysis of the change in mean 4-hr C-peptide AUC from baseline to month 12 (figure 2B) revealed that the alefacept group had a mean increase of +0.015 nmol/L (95% CI -0.076 to 0.106) versus a decrease of -0.156 nmol/L (95% CI -0.305 to -0.006) in the placebo group, which was significant after adjusting for baseline (p=0.019). Both groups achieved good glycemic control, with mean HbA1c levels at 12 months for the alefacept group of 6.9% and for the placebo group 7.2% (p=0.75; figure 3A). Insulin use at 12 months was higher in the placebo vs. alefacept group (0.48 vs. 0.36 units/kg/day, respectively, p=0.02).
Figure 3. HbA1c levels and exogenous insulin use in the alefacept and placebo groups.
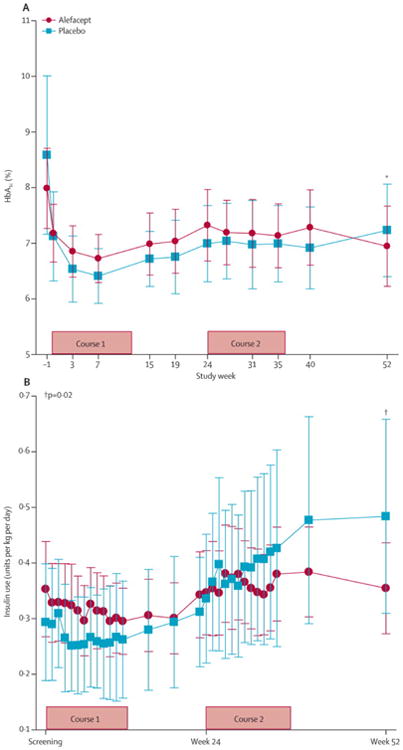
(A) HbA1c levels (%). (B) Exogenous insulin use (units/kg/day). Bars represent the 95% confidence intervals. Lines connect the mean values across visits for each treatment arm. P values for the change from baseline for both HbA1c and insulin use at week 52 were calculated using an analysis of covariance with baseline level as a covariate.
Additionally, within the alefacept group, insulin use at 12 months did not increase significantly from baseline (+0.02 units/kg/day, p=0.41), whereas in the placebo group insulin use increased at 12 months (+0.17 units/kg/day, p=0.02; figure 3B). In the alefacept group, 28/33 participants reported 359 major hypoglycemic events (defined as blood glucose < 55 mg/dL), which was significantly fewer than in the placebo group, in which 15/16 subjects reported 277 events (mean of 10.9 versus 17.3 events/subject/year, respectively; p<0.001; table 2).
Table 2. Adverse events by grade and type in the T1DAL trial.
| Alefacept | Placebo | Total | ||||
|---|---|---|---|---|---|---|
| Subjects [1,
2] (N = 33) n (%) |
Events [3] n (%) |
Subjects [1,
2] (N = 16) n (%) |
Events [3] n (%) |
Subjects [1,
2] (N = 49) n (%) |
Events [3] n (%) |
|
| Serious Adverse Events | 0 | 0 | 0 | 0 | 0 | 0 |
| SAEs Related to Study Drug | 0 | 0 | 0 | 0 | 0 | 0 |
| Adverse Events | 33 | 751 | 16 | 433 | 49 | 1184 |
| AEs Related to Study Drug | 29 (87.9) | 266 (35.4) | 15 (93.8) | 139 (32.1) | 44 (89.8) | 405 (34.2) |
| AEs by Severity | ||||||
| Grade 1 | 31 (93.9) | 316 (42.1) | 15 (93.8) | 134 (30.9) | 46 (93.9) | 450 (38.0) |
| Grade 2 | 30 (90.9) | 395 (52.6) | 16 | 279 (64.4) | 46 (93.9) | 674 (56.9) |
| Grade 3 | 13 (39.4) | 35 (4.7) | 9 (56.3) | 18 (4.2) | 22 (44.9) | 53 (4.5) |
| Grade 4 | 3 (9.1) | 3 (0.4) | 2 (12.5) | 2 (0.5) | 5 (10.2) | 5 (0.4) |
| Grade 5 | 0 | 0 | 0 | 0 | 0 | 0 |
| Injection Reactions | 6 (18.2) | 18 (2.4) | 4 (25.0) | 8 (1.8) | 10 (20.4) | 26 (2.2) |
| Hypersensitivity Reactions | - | - | - | - | 1 (2.0) | 1 (<0.1) |
| Lymphopenia | - | - | - | - | 3 (6.1) | 8 (0.7) |
| Infection with EBV, CMV, or TB | 1 (3.0) | - | 1 (6.3) | - | 2 (4.1) | 3 (0.3) |
| Infection | 25 (75.8) | 89 (11.9) | 11 (68.8) | 35 (8.1) | 36 (73.5) | 124 (10.5) |
| Asymptomatic Hepatic Injury | 6 (18.2) | 8 (1.1) | 3 (18.8) | 5 (1.2) | 9 (18.4) | 13 (1.1) |
| Major Hypoglycemic Event | 28 (84.8) | 359 (47.8) | 15 (93.8) | 277 (64.0) | 43 (87.8) | 636 (53.7) |
| Pregnancy | - | - | - | - | 1 (2.0) | 1 (<0.1) |
| Deaths | 0 | 0 | 0 | |||
Percentages for the number of subjects with AEs/SAEs are based on the number of subjects randomized (N).
Subjects who experienced one or more adverse event(s) are counted only once.
Percentages for the number of AEs are based on the total number of AEs.
Safety
The study is ongoing and remains masked at the subject level. There were no serious AEs and all subjects experienced at least one AE. In the alefacept group, 29 (87.9%) subjects experienced an AE related to study drug versus 15 (93.8%) in the placebo group (table 2). In the alefacept group, 14 (42.4%) subjects experienced grade 3 or 4 AEs compared to 9 (56.3%) subjects in the placebo group; there were no deaths. Injection site reactions, infections, and asymptomatic hepatic injury (elevated transaminases) were similar between the alefacept and placebo groups. Two subjects had suspected EBV infection or reactivation, leading to treatment interruption in one case and discontinuation in the other; treatment assignments were not unmasked. There were no other opportunistic infections. No patients experienced cytokine release syndrome or required hospitalization. In the alefacept group, 5 subjects (15.2%) had transient declines in CD4 counts to <250 cells/μL, resulting in temporary dose holding in 2 subjects; this was not observed in the placebo group.
Additional efficacy analyses
Pre-specified exploratory outcomes were the percent of patients who were exogenous insulin-free for ≥ 3 months with HbA1c < 6.5% at week 52 (35.5% in alefacept group versus 25.0% in the placebo group, p=0.720) and the proportion of subjects who achieved a persistent reduction (≥ 3 months) in insulin dose to <0.5 units/kg/day at week 52 (48.3% in the alefacept group and 27.3% in the placebo group, p=0.297). A post hoc analysis was the percent of patients who achieved glycemic control as defined by the ADA (<7.5% for subjects 13-19 years and <7.0% for subjects >19 years): at 12 months, 65.5% in the alefacept group vs. 58.3% in the placebo group (p=0.730).
Mechanistic results
At baseline (prior to treatment), CD2 expression intensity was highest on the CD4+ and CD8+ Tem population, intermediate on the Tcm population, and lowest on the naive T (Tn) and Treg populations (figure 4).
Figure 4. CD2 expression levels on lymphocyte subpopulations.
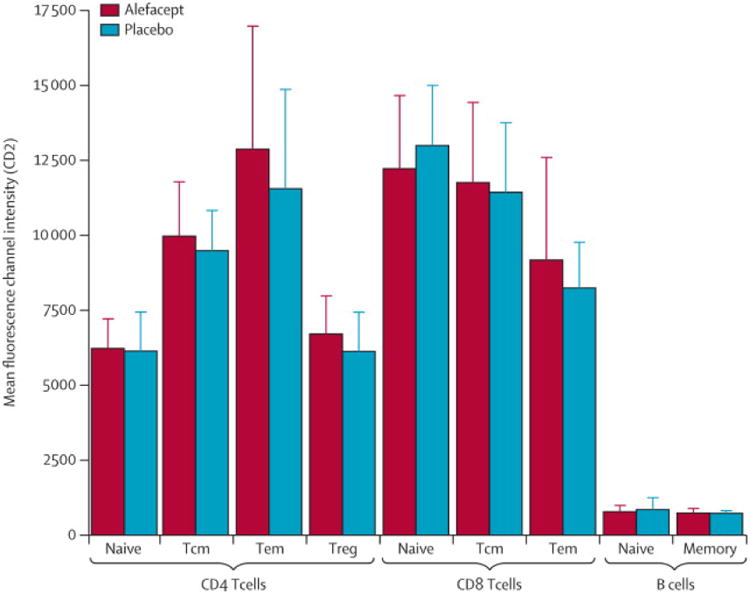
Frozen PBCMs collected at baseline were analyzed for the mean fluorescence intensity (MFI) of CD2 by flow cytometry. Lymphocyte subpopulations were defined as follows: CD4 naïve (Tn): CD3+CD4+FoxP3−CD127hiCCR7+CD45RA+; CD4 central memory (Tcm): CD3+CD4+FoxP3−CD127hiCCR7+CD45RA−; CD4 effector memory (Tem): CD3+CD4+FoxP3−CD127hiCCR7−CD45RA−; regulatory T cells (Treg): CD3+CD4+FoxP3+CD127lo; CD8 Tn: CD3+CD8+CCR7+CD45RA+; CD8 Tcm: CD3+CD8+CCR7+CD45RA−; CD8 Tem: CD3+CD8+CCR7−CD45RA−; Naïve B cells: CD19+CD27−; Memory B cells: CD19+CD27+. Values are mean±SD.
Total white blood counts remained relatively unchanged (figure 5A) but total lymphocytes, CD4+ and CD8+ T cells counts showed modest declines during the first and second course of treatment in the alefacept group, which largely rebounded to baseline levels by 52 weeks (figure 5B-D). In the CD4+ T cell compartment, the percentage of Tn cells increased from baseline by approximately 25% at week 11 in the alefacept group and remained elevated at all later time-points (p=0.0003 for overall difference; figure 6A1). In contrast, CD4+ Tcm cells decreased by ∼25-30% (p<0.0001; figure 6A2) and CD4+ Tem cells decreased by 40-60% (p=0.0002; figure 6A3) at all time-points post-baseline in the alefacept group. In comparison, CD8+ Tn cells decreased ∼25% only at week 11 (p=0.034; figure 6B1), Tcm cells decreased ∼35% at all time-points post-baseline (p=0.0003 for overall difference; figure 6B2), and Tem cells (defined as CD45RO+CCR7− or CD45RA+CCR7−) did not change (figure 6B3 and data not shown) in the alefacept group. Importantly, alefacept treatment did not alter the frequency of Tregs at any time point compared to placebo (figure 6C).
Figure 5. Absolute cell counts.
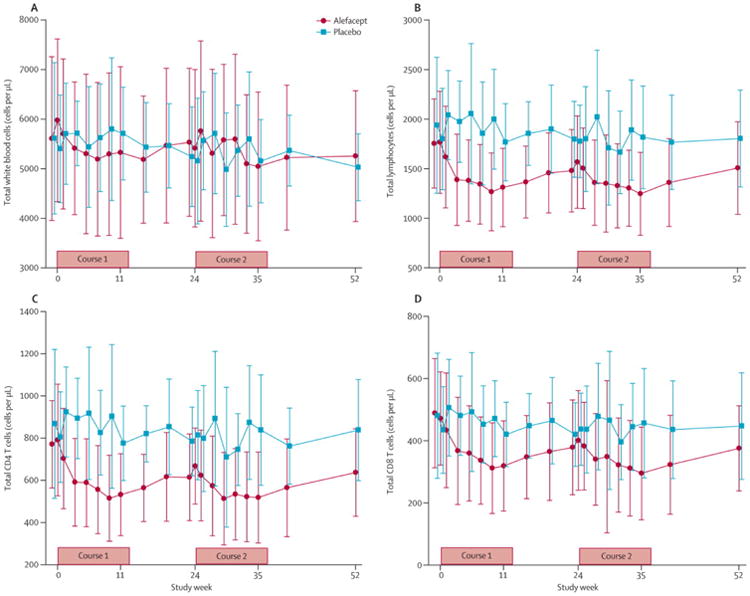
(A) White blood cells (WBC). (B) Total lymphocytes. (C) CD4 T cells. (D) CD8 T cells. Whole blood was analyzed real-time by flow cytometry in a central clinical laboratory. Data (cells/μL) are mean±SD.
Figure 6. Change in lymphocyte populations over time.

Frozen PBMCs collected at baseline and weeks 11, 24, 35, and 52 were analyzed by flow cytometry. Percents of subpopulations (defined in figure 4) from parent populations were determined and standardized to baseline values. (A1-3) CD4+ naïve (Tn), central memory (Tcm), and effector memory (Tem) cells. (B1-3) CD8+ Tn, Tcm, and Tem cells. (C) CD4+ Treg. Antibody panels and gating strategies are detailed in supplementary tables 1 and 2. Values are mean±SD.
The changes in T cell subsets were also reflected in the ratios of Treg to naïve and memory cells (figures 7A and B). Importantly, alefacept treatment resulted in significant increases in the Treg/CD4+ Tcm and Treg/CD4+ Tem ratios at all time-points post-baseline (p=0.0007 and 0.0001 for overall difference; figures 7A2 and 7A3), as well as an increased Treg/CD8+ Tcm ratio (p=0.0003; figure 7B2). Thus, with the exception of CD8 Tem, the cells that were most affected by alefacept were those that expressed higher levels of CD2 (Tcms and Tems) with sparing of Tn and Treg populations.
Figure 7. Ratios of Treg to naïve and memory T cells.

Relative numbers of Treg and CD4+ and CD8+ Tn, Tcm, and Tem cells (subpopulations as defined in figure 4) were determined by flow cytometry (using the gating strategies described in supplementary table 2), and the ratios of Treg to the indicated T cell subpopulations calculated. (A1-3) Treg/CD4 Tn, Treg/CD4 Tcm, and Treg/CD4 Tem. (B1-3) Treg/CD8 Tn, Treg/CD8 Tcm, and Treg/CD8 Tem. Values are mean±SD.
Discussion
Alefacept targets memory CD4+ and CD8+ T cells, which are believed to be important in beta cell destruction in T1D. Although we did not meet our primary endpoint at 12 months in the T1DAL trial we did meet three secondary endpoints, suggesting that a memory T cell-targeting agent such as alefacept may be able to assist in preserving residual beta cells present at the time of initial diagnosis.
Failure to meet the primary endpoint (2-hour C-peptide AUC at 12 months) may have resulted, in part, from reduced power after the planned enrolment target of 66 subjects was curtailed at 49 following voluntary withdrawal of alefacept by the manufacturer.(24) In contrast to the 2-hour AUC, the 4-hour C-peptide AUC was significantly different at 12 months between the treatment groups. This may reflect the ability of the 4-hour test interval to provide more complete data on the insulin response after a mixed meal, allowing for better discrimination between treatment groups. It is unclear if the 2- or 4-hour C-peptide AUC provides more relevant data for T1D intervention trials,(25) but the 4-hour AUC was chosen as the primary endpoint in the AbATE study.(11) In addition to the 4-hour C-peptide AUC data, our finding that insulin use and hypoglycemic events were also reduced support the notion that alefacept treatment may have resulted in relative preservation of islet function at 12 months compared to placebo. However, because of the significant variability in the rate of beta cell decline during the first year after diagnosis,(26) longer-term follow-up to 24 months will help better assess these findings.
The drug was generally well tolerated. In ∼15% of alefacept-treated patients there were transient reductions in CD4 counts to <250 cells/μL. Compared to placebo, there were no significant differences in injection site reactions, infections or other AEs and, importantly, no cytokine release syndrome or immune complex reactions seen with other biologic agents.(11, 27) This safety profile is similar to the much larger experience for this drug in psoriasis.(19)
CD2 expression levels at baseline were highest on Tems, followed by Tcms, and then Tns and Tregs. Depletion of these T cell subsets with alefacept correlated with CD2 intensity, with the exception of CD8 Tems. Thus, Tregs and CD8+ and CD4+ Tns were largely spared during alefacept therapy, whereas by week 11, CD4+ Tem and Tcm populations decreased 25-50% and remained decreased through 52 weeks. CD8+ Tcms were also significantly decreased but CD8+ Tems were unchanged, which was unexpected. In contrast to our results, alefacept treatment decreased CD8+ Tems in psoriasis;(14, 20) differences in the study population (T1D vs. psoriasis, younger vs. older subjects) may play a role. We observed more variability in CD8+ Tem responses in alefacept-treated subjects compared to CD4+ Tem responses (see figures 6A3 and 6B3) and it is possible that CD8+ Tem depletion was limited to clinical responders; a responder analysis is planned once all subjects have reached the month-24 endpoint. Finally, in addition to facilitating depletion, alefacept is thought to impair CD2-mediated costimulation of T cells(14, 15, 20) and it is possible that CD8+ Tems were functionally inhibited. Additional analyses are required to better understand the effects of alefacept on CD8+ Tems in T1D.
Although a positive effect on preserving beta cell function by alefacept may be explained by depletion of highly pathogenic effector and memory T cells, an important additional finding in this trial was that Tregs were spared with alefacept. Thus combined with the decline in most memory T cell subpopulations, the proportions of Treg per memory T cell were improved. It is possible that the memory populations have been brought under an absolute or functional threshold and are now susceptible to endogenous regulation. By targeting the most pathogenic T cells, while sparing Tregs, alefacept may to contribute to reestablishing a state of immune tolerance, which could explain the observation that a proportion of psoriasis patients treated with alefacept go into long-term off-therapy remission.(16-18)
The T1DAL trial is the first demonstration, to our knowledge, that it is possible to specifically and effectively deplete memory T cells in new-onset T1D, including CD4 Tem cells. This could not be achieved in a recent study evaluating antithymocyte globulin (ATG) in new-onset T1D: despite robust depletion of Tn and Tcm populations, Tem cells were resistant to depletion.(27) Further, Tregs were also strongly depleted by ATG therapy, leading to an unfavorable Treg/Tem ratio.27 In T1DAL we have observed the reverse: depletion of Tems and Tcms, preservation of Tregs, and an improvement in the Treg/memory T cell ratios. Therapies that result in a favorable Treg/Teff balance are effective in mitigating autoimmunity and result in long-term protection from disease in preclinical models of T1D.(28, 29) We propose that a targeted depletion of memory T cells, including Tems, is an important goal in immune interventions for T1D and that an increase in the Treg/memory T cell ratio may be a useful biomarker of treatment response.
The T1DAL trial is an ongoing study with further evaluation of endogenous insulin production planned at 18 and 24 months as well as other secondary and exploratory endpoints. These ongoing evaluations will assist in determining to what extent targeting effector and memory T cells can contribute to arresting diabetes autoimmunity and preserving residual beta cell mass in newly diagnosed T1D.
Supplementary Material
Supplementary Figure 1: Population means of stimulated C-peptide AUC mean from baseline to 12 months for alefacept and placebo treated subjects. (A) 2-hour AUCs (primary endpoint). (B) 4-hour AUCs (secondary endpoint). Bars represent 95% confidence intervals. P values were calculated after adjustment for baseline using an analysis of covariance with baseline ln(AUC+1) value as a covariate.
Supplementary Figure 2: Calculated absolute counts of T and B cell populations. Relative numbers of T and B cells (populations as defined in figure 4) were determined by flow cytometry (using the gating strategies described in supplementary table 2), and absolute counts were calculated based on total counts determined for CD3+, CD4+, and CD8+ parent populations (see figure 5). (A) CD4 non-Treg cells (CD4+FoxP3−CD127+). (B) Treg (CD4+FoxP3+CD127−). (C) B cells (CD19+). (D) CD4 Tn cells. (E) CD4 Tcm cells. (F) CD4 Tem cells. (G) CD8 Tn cells. (H) CD8 Tcm cells. (I) CD8 Tem cells. Values (cells/μL) are mean±SD.
Acknowledgments
The trial was conducted by the Immune Tolerance Network (ITN) and sponsored by the National Institute of Allergy and Infectious Diseases (NIAID). Additional funding was provided by the Juvenile Diabetes Research Foundation (JDRF) and the National Institute of Diabetes and Digestive and Kidney Diseases (NIDDK). At Indiana University this project was in part supported by the Indiana Clinical and Translational Sciences Institute, funded in part by Grant Number TR000006 from the National Institutes of Health, National Center for Advancing Translational Sciences, Clinical and Translational Sciences Award; at UCSF by Grant Numbers UL1 RR024131 and UL1 TR000004 from the National Center for Research Resources and the National Center for Advancing Translational Sciences, National Institutes of Health; at CHOP by Grants UL1RR024134 and UL1TR000003 from the National Center for Research Resources and the National Center for Advancing Translational Sciences; at University of Iowa by Grant Number UL1 TR000442-06 from the National Center for Advancing Translational Sciences, and the National Institutes of Health; the contents are solely the responsibility of the authors and do not necessarily represent the official views of the NIH.
Astellas Pharma US, Inc. (Northbrook, IL, USA) provided alefacept (Amevive®) and gave input regarding dosage and safety, but had no direct involvement with study design, conduct, or management; data collection, analysis or interpretation; or manuscript preparation. There are no agreements concerning confidentiality of the data between the sponsor and the authors or the institutions named in the credit lines. The authors provided Astellas a copy of the original manuscript prior to submission.
Bayer HealthCare LLC, Diabetes Care (Tarrytown, NY, USA) provided blood glucose monitoring supplies through an Investigator Sponsored Research Grant.
Panel: Research in context
Systematic review
We searched the PubMed database for articles published up to August 1, 2013 with the search terms “immune intervention” AND “type 1 diabetes”, and “alefacept”. Three agents evaluated in a series of recent randomized trials with adequate sample size showed some degree of preservation of beta cell function in type 1 diabetes, as assessed by change in C-peptide secretion in response to a mixed meal tolerance test over time. These trials used anti-CD3, anti-CD20, and abatacept.(7-11) Several recent trials, notably with anti-IL-1 therapies and with antithymocyte globulin, have failed to show clinical benefit.(12, 27) So far, there have been no randomized, placebo-controlled trials of alefacept or other CD2-targeting therapies in patients with new-onset T1D.
Interpretation
Alefacept is the first targeted biologic agent evaluated in new-onset T1D that significantly depleted effector and central memory T cells while preserving regulatory T cells. Although the primary endpoint was not met, several key secondary endpoints were significantly different between treatment arms, suggesting that alefacept may preserve beta cell function during the first 12 months after diagnosis. Thus, targeting memory cells may be a useful strategy in T1D, but longer follow-up is required to confirm the preliminary signal of efficacy observed at 12 months in the T1DAL trial.
Contributors
The T1DAL Trial Study Group
ITN San Francisco: Mario Ehlers, Carol Soppe, Preeti Chugha, Audrey Plough, Tanya Cope, Judith Evind, Melissa Johnson, Maureen Sharkey, Tracy Strickroth. ITN Bethesda: Sudeepta Aggarwal, Michael Howell, Deborah Phippard, Noha Lim, Tracia Debnam, Winnie Felix, Nancy Skeeter.
National Institute of Allergy and Infectious Diseases (NIAID), Bethesda: Peggy Lund-Fitzgibbon, Steve Adah, James McNamara.
Rho Federal Systems Division, Chapel Hill: Ashley Pinckney, Lynette Keyes-Elstein, LaSonia Morgan.
Indiana University and Riley Children's Hospital, Indianapolis: Mark Rigby, Linda DiMeglio, Carmella Evans-Molina, Stephanie Woerner, Jennifer Terrell, LeeAnn Ford, Maria Spall, Vanessa Patrick, Christy Kruse.
Barbara Davis Center, Aurora: Peter Gottlieb, Aaron Michaels, Mara Schwartz, Amy Wallace, Jenna Lungaro, Heather Maurer, Joseph Daniels, Aaron Blau.
Benaroya Research Institute: Carla Greenbaum, Jennifer Bollyky, Srinath Sanda, Marli McCulloch-Olson, Marissa St. Marie, Alice Long.
Children's Hospital of Philadelphia, Philadelphia: Steven Willi, Olena Kucheruk, David Langdon, Pantea Minnock.
Children's Hospital Los Angeles, Los Angeles: Roshanak Monzavi, Mary Halvorson, Jamie Wood.
Children's Mercy Hospital, Kansas City: Wayne Moore, SueEllen Weigel.
Creighton University, Omaha: Marc Rendell, Kayla Zebrowski, Lisa Kuechenmeister, Michael Ulen, Al Rizzo, Vega Were.
Emory University, Atlanta: Eric Felner, Stephanie Meisner, Nicholas Raviele, Greg Smallwood, Sol Jacobs, Milton Brown, Cheryl Stone.
Massachusetts General Hospital, Boston: Nicole Sherry, Chhanda Som, Sarah Dean.
University of Arizona, Tucson: Kurt Griffin, Chetan Patel, Carol Stuehm, Oscar Furet.
University of California, San Francisco: Stephen Gitelman, Stephen Rosenthal, Saleh Adi, Rebecca Wesch, Christine Torok, Karen Ko, Maria Wertz, Kathleen Breen.
University of Iowa, Iowa City: Eva Tsalikian, Michael Tansey, Julie Coffey, Sarah Salamati, Joanne Cabbage.
University of North Carolina, Chapel Hill: Jean Dostou, Gail Fuller, Joseph Largay, Nina Jain.
University of Minnesota, Minneapolis: Antoinette Moran, Brandon Nathan, John Wagner Carrie Gibson, Christine Kwong, Jennifer Smith, Anne Street, Janice Leschyshyn.
University of Texas Southwestern, Dallas: Philip Raskin, Soma Abraham, M. Lourdes Pruneda, Jamie Arthur, Stefani Fernandez.
Vanderbilt University: William Russell, Faith Brendle.
Footnotes
Author contributions: MRR served as study chair and wrote the first draft of the manuscript. Other members of the writing group included MRE, AP, LK-E, JM, MH and DP. All authors were involved in the conduct of the trial, and the collection and review of the study data. The writing group had full access to all of the data and made the decision to publish the paper. The authors reviewed and commented on various versions of the paper, and the suggested revisions.
Dualities: PR reports receiving research funds, payable to the University of Texas, Southwester, from Andromeda Biotech Ltd.
No other potential conflicts of interest relevant to this article were reported.
Publisher's Disclaimer: This is a PDF file of an unedited manuscript that has been accepted for publication. As a service to our customers we are providing this early version of the manuscript. The manuscript will undergo copyediting, typesetting, and review of the resulting proof before it is published in its final citable form. Please note that during the production process errors may be discovered which could affect the content, and all legal disclaimers that apply to the journal pertain.
Contributor Information
Prof Mark R Rigby, Indiana University and Riley Hospital for Children at Indiana University Health, Indianapolis, Indianapolis, IN, USA.
Prof Linda A DiMeglio, Indiana University and Riley Hospital for Children at Indiana University Health, Indianapolis, Indianapolis, IN, USA.
Marc S Rendell, Creighton Diabetes Center, Omaha, NE, USA.
Prof Eric I Felner, Emory University, Atlanta, GA, USA.
Prof Jean M Dostou, University of North Carolina, Durham, NC, USA.
Prof Stephen E Gitelman, University of California San Francisco, San Francisco, CA, USA.
Chetanbabu M Patel, University of Arizona, Tucson, AZ, USA.
Prof Kurt J Griffin, University of Arizona, Tucson, AZ, USA.
Prof Eva Tsalikian, University of Iowa, Iowa City, Iowa, USA.
Prof Peter A Gottlieb, Barbara Davis Center, University of Colorado, Aurora, CO, USA.
Carla J Greenbaum, Benaroya Research Institute, Seattle, WA.
Nicole A Sherry, Massachusetts General Hospital, Boston, MA.
Wayne V Moore, Children's Mercy Hospital, Kansas City, MO, USA.
Roshanak Monzavi, Children's Hospital Los Angeles, Los Angeles, CA, USA.
Steven M Willi, Children's Hospital of Philadelphia, Philadelphia, PA, USA.
Prof Philip Raskin, The University of Texas, Southwestern Medical Center, Dallas, TX, USA.
Prof Antoinette Moran, University of Minnesota, Minneapolis, MN, USA.
Prof William E Russell, Vanderbilt University Medical Center, Nashville, Tennessee, USA.
Ashley Pinckney, Rho Federal Systems Division, Chapel Hill, NC, USA.
Lynette Keyes-Elstein, Rho Federal Systems Division, Chapel Hill, NC, USA.
Michael Howell, Immune Tolerance Network, Bethesda, MD, USA.
Sudeepta Aggarwal, Immune Tolerance Network, Bethesda, MD, USA.
Noha Lim, Immune Tolerance Network, Bethesda, MD, USA.
Deborah Phippard, Immune Tolerance Network, Bethesda, MD, USA.
Gerald T Nepom, Benaroya Research Institute, Seattle, WA.
James McNamara, National Institutes of Allergy and Infectious Diseases, Bethesda, MD.
Mario R Ehlers, Immune Tolerance Network, San Francisco, CA, USA.
References
- 1.Bluestone JA, Herold K, Eisenbarth G. Genetics, pathogenesis and clinical interventions in type 1 diabetes. Nature. 2010;464(7293):1293–300. doi: 10.1038/nature08933. Epub 2010/05/01. [DOI] [PMC free article] [PubMed] [Google Scholar]
- 2.Steffes MW, Sibley S, Jackson M, Thomas W. Beta-cell function and the development of diabetes-related complications in the diabetes control and complications trial. Diabetes Care. 2003;26(3):832–6. doi: 10.2337/diacare.26.3.832. Epub 2003/03/01. [DOI] [PubMed] [Google Scholar]
- 3.Feutren G, Papoz L, Assan R, Vialettes B, Karsenty G, Vexiau P, et al. Cyclosporin increases the rate and length of remissions in insulin-dependent diabetes of recent onset. Results of a multicentre double-blind trial. Lancet. 1986;2(8499):119–24. doi: 10.1016/s0140-6736(86)91943-4. Epub 1986/07/19. [DOI] [PubMed] [Google Scholar]
- 4.Cook JJ, Hudson I, Harrison LC, Dean B, Colman PG, Werther GA, et al. Double-blind controlled trial of azathioprine in children with newly diagnosed type I diabetes. Diabetes. 1989;38(6):779–83. doi: 10.2337/diab.38.6.779. [DOI] [PubMed] [Google Scholar]
- 5.Chase HP, Butler-Simon N, Garg SK, Hayward A, Klingensmith GJ, Hamman RF, et al. Cyclosporine A for the treatment of new-onset insulin-dependent diabetes mellitus. Pediatrics. 1990;85(3):241–5. [PubMed] [Google Scholar]
- 6.Chatenoud L. Immune therapies of autoimmune diseases: are we approaching a real cure? Curr Opin Immunol. 2006;18(6):710–7. doi: 10.1016/j.coi.2006.09.004. Epub 2006/10/03. [DOI] [PubMed] [Google Scholar]
- 7.Pescovitz MD, Greenbaum CJ, Krause-Steinrauf H, Becker DJ, Gitelman SE, Goland R, et al. Rituximab, B-lymphocyte depletion, and preservation of beta-cell function. N Engl J Med. 2009;361(22):2143–52. doi: 10.1056/NEJMoa0904452. Epub 2009/11/27. [DOI] [PMC free article] [PubMed] [Google Scholar]
- 8.Orban T, Bundy B, Becker DJ, DiMeglio LA, Gitelman SE, Goland R, et al. Co-stimulation modulation with abatacept in patients with recent-onset type 1 diabetes: a randomised, double-blind, placebo-controlled trial. Lancet. 2011;378(9789):412–9. doi: 10.1016/S0140-6736(11)60886-6. Epub 2011/07/02. [DOI] [PMC free article] [PubMed] [Google Scholar]
- 9.Keymeulen B, Vandemeulebroucke E, Ziegler AG, Mathieu C, Kaufman L, Hale G, et al. Insulin needs after CD3-antibody therapy in new-onset type 1 diabetes. N Engl J Med. 2005;352(25):2598–608. doi: 10.1056/NEJMoa043980. Epub 2005/06/24. [DOI] [PubMed] [Google Scholar]
- 10.Sherry N, Hagopian W, Ludvigsson J, Jain SM, Wahlen J, Ferry RJ, Jr, et al. Teplizumab for treatment of type 1 diabetes (Protege study): 1-year results from a randomised, placebo-controlled trial. Lancet. 2011;378(9790):487–97. doi: 10.1016/S0140-6736(11)60931-8. Epub 2011/07/02. [DOI] [PMC free article] [PubMed] [Google Scholar]
- 11.Herold KC, Gitelman SE, Ehlers MR, Gottlieb PA, Greenbaum CJ, Hagopian W, et al. Teplizumab (anti-CD3 mAb) treatment preserves C-peptide responses in patients with new-onset type 1 diabetes in a randomized controlled trial: Metabolic and immunologic features at baseline identify a subgroup of responders. Diabetes. 2013 doi: 10.2337/db13-0345. (published online July 8). Epub 2013/07/10. [DOI] [PMC free article] [PubMed] [Google Scholar]
- 12.Moran A, Bundy B, Becker DJ, DiMeglio LA, Gitelman SE, Goland R, et al. Interleukin-1 antagonism in type 1 diabetes of recent onset: two multicentre, randomised, double-blind, placebo-controlled trials. Lancet. 2013;381(9881):1905–15. doi: 10.1016/S0140-6736(13)60023-9. Epub 2013/04/09. [DOI] [PMC free article] [PubMed] [Google Scholar]
- 13.Weaver TA, Charafeddine AH, Agarwal A, Turner AP, Russell M, Leopardi FV, et al. Alefacept promotes co-stimulation blockade based allograft survival in nonhuman primates. Nat Med. 2009;15(7):746–9. doi: 10.1038/nm.1993. Epub 2009/07/09. [DOI] [PMC free article] [PubMed] [Google Scholar]
- 14.Chamian F, Lin SL, Lee E, Kikuchi T, Gilleaudeau P, Sullivan-Whalen M, et al. Alefacept (anti-CD2) causes a selective reduction in circulating effector memory T cells (Tem) and relative preservation of central memory T cells (Tcm) in psoriasis. J Transl Med. 2007;5:27. doi: 10.1186/1479-5876-5-27. Epub 2007/06/09. [DOI] [PMC free article] [PubMed] [Google Scholar]
- 15.Krueger GG. Selective targeting of T cell subsets: focus on alefacept - a remittive therapy for psoriasis. Expert Opin Biol Ther. 2002;2(4):431–41. doi: 10.1517/14712598.2.4.431. Epub 2002/04/17. [DOI] [PubMed] [Google Scholar]
- 16.Gordon KB, Langley RG. Remittive effects of intramuscular alefacept in psoriasis. J Drugs Dermatol. 2003;2(6):624–8. Epub 2004/01/09. [PubMed] [Google Scholar]
- 17.Gottlieb AB, Casale TB, Frankel E, Goffe B, Lowe N, Ochs HD, et al. CD4+ T-cell-directed antibody responses are maintained in patients with psoriasis receiving alefacept: results of a randomized study. J Am Acad Dermatol. 2003;49(5):816–25. doi: 10.1016/s0190-9622(03)01836-x. Epub 2003/10/25. [DOI] [PubMed] [Google Scholar]
- 18.Krueger GG, Ellis CN. Alefacept therapy produces remission for patients with chronic plaque psoriasis. Br J Dermatol. 2003;148(4):784–8. doi: 10.1046/j.1365-2133.2003.05239.x. Epub 2003/05/20. [DOI] [PubMed] [Google Scholar]
- 19.Krueger GG, Callis KP. Development and use of alefacept to treat psoriasis. J Am Acad Dermatol. 2003;49(2 Suppl):S87–97. doi: 10.1016/mjd.2003.552. Epub 2003/08/02. [DOI] [PubMed] [Google Scholar]
- 20.Ellis CN, Krueger GG. Treatment of chronic plaque psoriasis by selective targeting of memory effector T lymphocytes. N Engl J Med. 2001;345(4):248–55. doi: 10.1056/NEJM200107263450403. Epub 2001/07/28. [DOI] [PubMed] [Google Scholar]
- 21.Chamian F, Lowes MA, Lin SL, Lee E, Kikuchi T, Gilleaudeau P, et al. Alefacept reduces infiltrating T cells, activated dendritic cells, and inflammatory genes in psoriasis vulgaris. Proc Natl Acad Sci U S A. 2005;102(6):2075–80. doi: 10.1073/pnas.0409569102. Epub 2005/01/27. [DOI] [PMC free article] [PubMed] [Google Scholar]
- 22.Gordon KB, Vaishnaw AK, O'Gorman J, Haney J, Menter A. Treatment of psoriasis with alefacept: correlation of clinical improvement with reductions of memory T-cell counts. Arch Dermatol. 2003;139(12):1563–70. doi: 10.1001/archderm.139.12.1563. Epub 2003/12/17. [DOI] [PubMed] [Google Scholar]
- 23.Lachin JM, McGee PL, Greenbaum CJ, Palmer J, Pescovitz MD, Gottlieb P, et al. Sample size requirements for studies of treatment effects on beta-cell function in newly diagnosed type 1 diabetes. PloS one. 2011;6(11):e26471. doi: 10.1371/journal.pone.0026471. Epub 2011/11/22. [DOI] [PMC free article] [PubMed] [Google Scholar]
- 24.Astellas Pharma US; 2011. Voluntary US market Discontinuation of Amevive (alefacept) http://wwwamevivecom/Physician%20letterpdf: [Google Scholar]
- 25.Steele C, Hagopian WA, Gitelman S, Masharani U, Cavaghan M, Rother KI, et al. Insulin secretion in type 1 diabetes. Diabetes. 2004;53(2):426–33. doi: 10.2337/diabetes.53.2.426. Epub 2004/01/30. [DOI] [PubMed] [Google Scholar]
- 26.Greenbaum CJ, Beam CA, Boulware D, Gitelman SE, Gottlieb PA, Herold KC, et al. Fall in C-peptide during first 2 years from diagnosis: evidence of at least two distinct phases from composite Type 1 Diabetes TrialNet data. Diabetes. 2012;61(8):2066–73. doi: 10.2337/db11-1538. Epub 2012/06/13. [DOI] [PMC free article] [PubMed] [Google Scholar]
- 27.Gitelman SE, Gottlieb PA, Rigby MR, et al. Antithymocyte globulin therapy for patients with recent-onset type 1 diabetes: a randomized double-blind phase 2 trial. Lancet Diabetes & Endocrinology. 2013 In press. [Google Scholar]
- 28.Mordes JP, Bortell R, Doukas J, Rigby M, Whalen B, Zipris D, et al. The BB/Wor rat and the balance hypothesis of autoimmunity. Diabetes Metab Rev. 1996;12(2):103–9. doi: 10.1002/(SICI)1099-0895(199607)12:2<103::AID-DMR161>3.0.CO;2-2. Epub 1996/07/01. [DOI] [PubMed] [Google Scholar]
- 29.Bour-Jordan H, Bluestone JA. Regulating the regulators: costimulatory signals control the homeostasis and function of regulatory T cells. Immunol Rev. 2009;229(1):41–66. doi: 10.1111/j.1600-065X.2009.00775.x. Epub 2009/05/12. [DOI] [PMC free article] [PubMed] [Google Scholar]
Associated Data
This section collects any data citations, data availability statements, or supplementary materials included in this article.
Supplementary Materials
Supplementary Figure 1: Population means of stimulated C-peptide AUC mean from baseline to 12 months for alefacept and placebo treated subjects. (A) 2-hour AUCs (primary endpoint). (B) 4-hour AUCs (secondary endpoint). Bars represent 95% confidence intervals. P values were calculated after adjustment for baseline using an analysis of covariance with baseline ln(AUC+1) value as a covariate.
Supplementary Figure 2: Calculated absolute counts of T and B cell populations. Relative numbers of T and B cells (populations as defined in figure 4) were determined by flow cytometry (using the gating strategies described in supplementary table 2), and absolute counts were calculated based on total counts determined for CD3+, CD4+, and CD8+ parent populations (see figure 5). (A) CD4 non-Treg cells (CD4+FoxP3−CD127+). (B) Treg (CD4+FoxP3+CD127−). (C) B cells (CD19+). (D) CD4 Tn cells. (E) CD4 Tcm cells. (F) CD4 Tem cells. (G) CD8 Tn cells. (H) CD8 Tcm cells. (I) CD8 Tem cells. Values (cells/μL) are mean±SD.