Abstract
Genomic imprinting is an allele-specific gene expression system important for mammalian development and function 1. The molecular basis of genomic imprinting is allele-specific DNA methylation 1,2. While it is well known that the de novo DNA methyltransferases Dnmt3a/b are responsible for the establishment of genomic imprinting 3, how the methylation mark is erased during primordial germ cell (PGC) reprogramming remains a mystery. Tet1 is one of the ten-eleven translocation family proteins, which have the capacity to oxidize 5-methylcytosine (5mC) 4-6, specifically expressed in reprogramming PGCs 7. Here we report that Tet1 plays a critical role in the erasure of genomic imprinting. We show that despite their identical genotype, progenies derived from mating between Tet1-KO males and wild-type females exhibit a number of variable phenotypes including placental, fetal and postnatal growth defects, and early embryonic lethality. These defects are, at least in part, caused by the dysregulation of imprinted genes, such as Peg10 and Peg3, which exhibit aberrant hypermethylation in the paternal allele of differential methylated regions (DMRs). RNA-seq reveals extensive dysregulation of imprinted genes in the next generation due to paternal loss function of Tet1. Genome-wide DNA methylation analysis of E13.5 PGCs and sperms of Tet1-KO mice revealed hypermethylation of DMRs of imprinted genes in sperm, which can be traced back to PGCs. Analysis of the DNA methylation dynamics in reprogramming PGCs suggests that Tet1 functions to wipe out remaining methylation, including imprinted genes, at the late reprogramming stage. We further provide evidence supporting Tet1's role in the erasure of paternal imprints in female germline. Thus, our study establishes a critical function of Tet1 in genomic imprinting erasure.
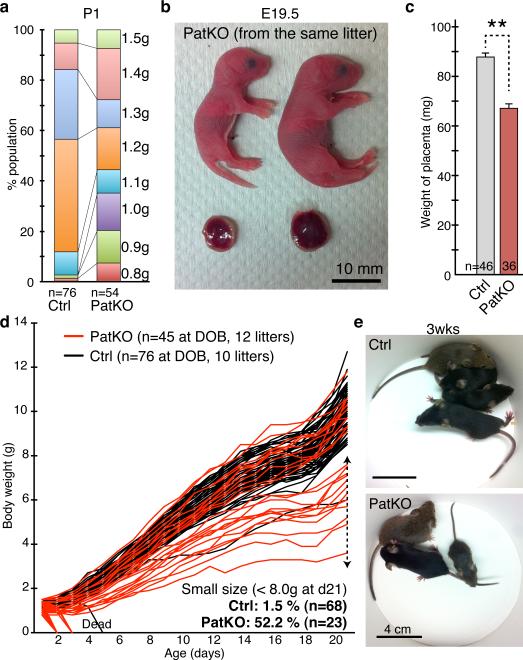
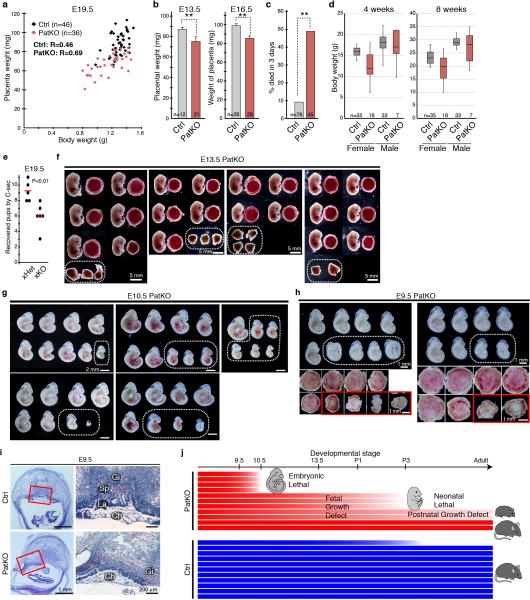
The dynamic expression pattern of Tet1 in PGCs makes it a primary candidate for imprinting erasure 7. To test this possibility, we generated paternal KO (PatKO; progenies from Tet1−/− male × wild-type female) mouse and analyzed the effect of paternal Tet1 functional loss on the development of the next generation based on the idea that imprinting defects affect the next generation 1,2. Unlike the meiotic defects in the oocytes of Tet1-KO females 7, Tet1-KO testis is morphologically and functionally normal, which makes the generation of PatKO possible. We found that Tet1-PatKO pups exhibit great variability in body sizes when compared to that of controls (Ctrl; progenies from Tet1+/− male × wild-type female) (Fig. 1a, b). In addition, the PatKO placental sizes are significantly smaller than that of controls (Fig. 1c). The placental size positively correlates to the body size (R=0.69) of PatKO pups, suggesting that the growth retardation of the embryos is likely caused by the developmental failure of the placenta, which is already noticeable at E13.5 and E16.5 (Extended Data Fig. 1a, b). Additionally, we found that about half of PatKO pups die within three days of birth (Extended Data Fig. 1c). Moreover, about half of survived pups showed marked growth retardation (Fig. 1d, e). This unusually large variation in body size persists to adulthood (Extended Data Fig. 1d).
Figure 1. Tet1 paternal KO results in fetal and postnatal growth defects.
a, Increased variation of body weight at birth in Tet1-PatKO pups. Note that pups with weight <1.2g or >1.3g account for the majority of the population in Tet1-PatKO while most of the control pups are between 1.2-1.3g at birth. b, Representative image of PatKO pups from the same litter showing big variation in body and placental sizes. Embryos and their placentae were recovered by C-section at the day of birth (E19.5). c, Average placental weights at E19.5. Error bars indicate S.E.M. **P<0.01. d. Growth curves of individual pup. The lines that dropped to zero indicate the mice were found dead at the time indicated. e. Representative image of three-week old litters from Ctrl and PatKO.
Extended Data Figure 1. Tet1 paternal KO mice exhibit various phenotypes, including fetal and postnatal growth defects, and neonatal and embryonic lethality.
a, Scatter plot of body and placental sizes for each pup. b, Average placental weight of E13.5 and E16.5 embryos. Error bar, S.E.M. **P<0.01. c, Percentage of pups that die within 3 days of birth. **P<0.01. d, Box plot presentation of body weights of 4- and 8-week old Ctrl and PatKO mice. Note that PatKO mice exhibited a larger variation and smaller body weight compared to the control mice. e, Mating scores of xHet (Tet1+/− male × wild-type female) and xHomo (Tet1−/− male × wild-type female). Black dots indicate the numbers of pups for each litter recovered by C-section at E19.5. Red lines indicate the mean litter size. f, The embryos and placentae at E13.5 recovered from three litters of Tet1-PatKO. The dotted circles indicate the residues of absorbed embryos. g, E10.5 PatKO embryos recovered from five litters. Dotted circle indicates morphologically abnormal embryos. h, Top, E9.5 PatKO embryos recovered from two litters. Dotted circles indicate small embryos whose placentae are morphologically abnormal. Bottom, placentae corresponding to the embryos on the top panels. Red rectangles indicate morphologically abnormal placentae. i, Representative images of hematoxylin and eosin staining of E9.5 placentae. Red rectangles indicate the enlarged regions shown at the right panels. Gi, Trophoblastgiant cells; Sp, Spongioblast; La; Labyrinthine zone; Ch, Chorionic plate. j, Schematic representation of Tet1-PatKO phenotypes. Each bar represents an individual mouse. About 40% of PatKO exhibit early embryonic lethality. About half of the remaining mice die neonatally, and about half of the survived mice show postnatal growth defects. In contrast, abnormality is rarely observed in control, except at the neonatal stage (less than 10%).
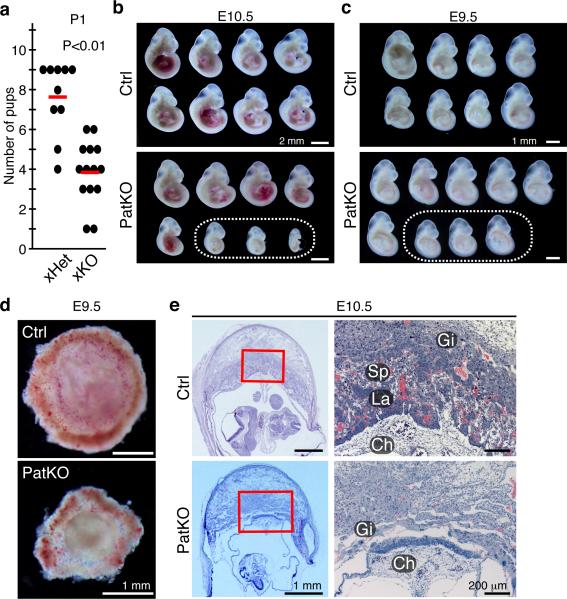
In addition to growth defects, we found that the litter size of PatKO is also greatly reduced compared to the control crosses (Fig. 2a, Extended Data Fig. 1e). To examine potential embryonic developmental defects of Tet1-PatKO pups, we dissected embryos at E13.5 and noticed some absorbed embryos in utero (36.4%, n=33 from 4 litters of PatKO; 2.8%, n=36 from 5 litters of control) (Extended Data Fig. 1f). Although no absorbed embryos were observed at E10.5, about 33.3 % (n=48 from 6 litters) of PatKO embryos exhibited developmental abnormalities, particularly in posterior parts, and no clear somites were observed (Fig. 2b, Extended Data Fig. 1g). Although all of the E9.5 PatKO embryos analyzed were morphologically normal, some of them were smaller and had abnormal placentae (34.6 %, n=26 from 3 litters) (Fig. 2c, d, Extended Data Fig. 1h). Histological analysis of E9.5 and E10.5 PatKO placentae revealed a lack of chorionic plate extension and a defect in labyrinthine zone development (Fig. 2e, Extended Data Fig. 1i). Since the frequency of placental abnormality at E9.5 is similar to the frequency of embryo absorption at E13.5, it is likely that the placental defect is one of the major causes of embryonic lethality and reduced litter size of PatKO embryos. Collectively, the above analyses revealed that loss function of Tet1 in the paternal germ line results in a set of phenotypes that include: 1) early embryonic lethality, 2) placental and embryonic growth defects, and 3) postnatal growth retardation (Extended Data Fig. 1j).
Figure 2. Early embryonic lethality caused by placental defects in Tet1 paternal KO mice.
a, Mating scores of xHet (Tet1+/− male × wild-type female) and xHomo (Tet1−/− male × wild-type female). Black dots indicate the numbers of pups in each litter at the day of birth. Red lines indicate the mean litter size. b, E10.5 embryos recovered from a single litter of Ctrl and PatKO. The dotted circle indicates morphologically abnormal embryos. c, E9.5 embryos recovered from a single litter of Ctrl and PatKO. The dotted circle indicates small embryos whose placentae were morphologically abnormal. d, Representative images of E9.5 placentae. e, Representative images of hematoxylin and eosin staining of E10.5 placentae. Red rectangles indicate the enlarged regions shown at the right panels. Gi, Trophoblastgiant cells; Sp, Spongioblast; La; Labyrinthine zone; Ch, Chorionic plate.
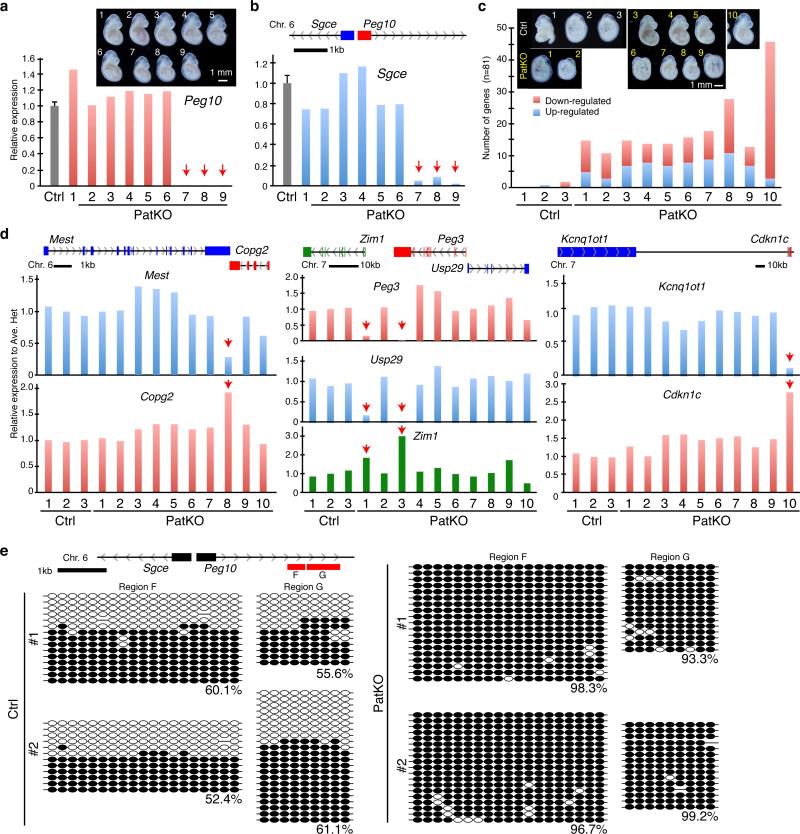
Previous studies have established a critical function of some imprinted genes in embryonic and placental development 1,8. The phenotypic similarity between Tet1-PatKO and Peg10-KO prompted us to examine whether paternal functional loss of Tet1 results in dysregulation of Peg10 in the PatKO embryos 9. RT-qPCR analysis revealed loss of Peg10 expression in 33.3% of PatKO E9.5 embryos (n=30 from 4 litters) (Fig. 3a). In contrast, all the embryos from controls have normal Peg10 expression (n=13 from 2 litters) (data not shown). Sgce, a neighboring imprinted gene of Peg10, was simultaneously down-regulated in Peg10-dysregulated PatKO embryos (Fig. 3b), suggesting co-regulation of these two imprinted genes.
Figure 3. Tet1 paternal KO embryos and placentae exhibit imprinting defects.
a, b, RT-qPCR analysis of Peg10 (a) and Sgce (b) of E9.5 embryos from a single litter. The pup number corresponds to that in the inserted image in panel a. Arrows indicate the samples showing marked reduction in Peg10 and Sgce expression. The average value of Ctrl embryos (n=13) is set as 1. Error bar, S.E.M. Genomic location of Peg10 and Sgce genes is indicated at the top of the panel b. c, Number of up- and down-regulated imprinted genes in each of the PatKO embryos compared to the average FPKM (fragments per kilobase of exon per million fragments mapped) value of Ctrl embryos analyzed by RNA-seq (cutoff FC>1.5). A total of 81 autosomal imprinted genes expressed in embryos (FPKM > 0.4) are used in this analysis. The pup number corresponds to the inserted images. d, Relative expression level of imprinted genes at E9.5 embryos analyzed by RNA-seq. Arrows indicate the samples showing marked changes in expression levels. The average FPKM value of three Ctrl embryos is set as 1. The genomic locations of each gene are indicated at the top of the diagrams. The pup number corresponds to the inserted images in panel c. e, Bisulfite sequencing analysis of Peg10-DMR of E9.5 embryos. Analyzed region is indicated at the top of the diagram. Each CpG is represented by a circle with methylation and non-methylation represented by open and filled circles, respectively. The percentages of DNA methylation are indicated.
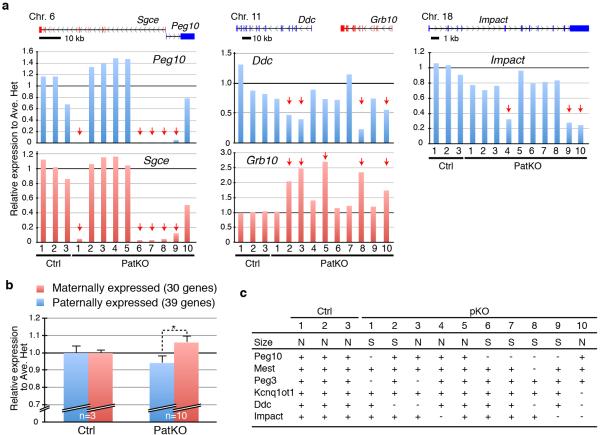
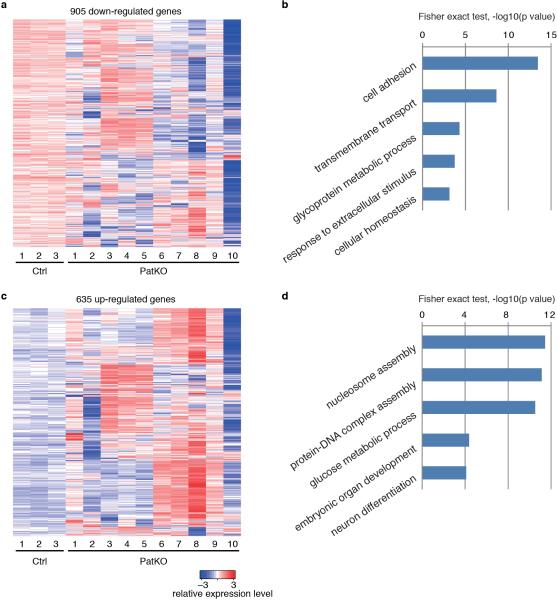
To reveal additional imprinted genes affected by Tet1 deletion, we performed RNA-seq analysis on 10 PatKO and 3 control E9.5 embryos (Supplementary Table 1). We found that 11-46 out of 81 expressed imprinted genes were dysregulated (FC >1.5) in each PatKO embryo analyzed (Fig. 3c, and Supplementary Table 2). The dysregulated genes include imprinting gene clusters such as Mest-Copg2, Peg10-Sgce, Zim1-Peg3-Usp29, Kcnq1ot1-Cdkn1c, Ddc-Grb10, and Impact (Fig. 3d and Extended Data Fig. 2a, c). Interestingly, we observed up-regulation of maternally expressed genes and down-regulation of paternally expressed genes in individual Tet1-PatKO embryos (Extended Data Fig. 2b and Supplementary Table 2), suggesting that maternalization of the paternal allele of imprinted gene expression pattern is a common phenomenon in Tet1-PatKO embryos. In addition to imprinted genes, RNA-seq also identified 1540 genes whose expression were markedly altered (905 up- and 635 down-regulated, FC>1.5) in at least two of the ten PatKO embryos analyzed (Extended Data Fig. 3, and Supplementary Table 3). Considering the fact that the PatKO and half of Ctrl embryos have the same heterozygous Tet1 genotype, many of the gene expression changes are likely caused by either the changes in imprinted gene expression or the consequences of the phenotypes, and not simply an effect of the genotype.
Extended Data Figure 2. Dysregulation of imprinted genes in Tet1 paternal KO embryos.
a, Relative expression levels of imprinted genes in E9.5 embryos analyzed by RNA-seq. The averaged FPKM (fragments per kb of exon per million fragments mapped) value of three Ctrl embryos is set as 1. Arrows indicate dysregulated embryos. The location of each gene is indicated in the diagram on top of the panel. b, Relative average expression change of maternally and paternally imprinted genes. The imprinted genes that are highly expressed in E9.5 embryos (FPKM>1.0) are used in this analysis. Error bars indicate S.E.M. *P<0.05. c, Summary of imprinted genes dysregulated in PatKO embryos. N, normal size; S, small size; +, normal expression; -, down-regulated.
Extended Data Figure 3. Perturbation of gene expression in Tet1 PatKO embryos.
a, Heat map representation of markedly down-regulated genes (FC>1.5) in at least two E9.5 PatKO embryos. Only those genes with significant change in at least two PatKO embryos were shown. b, GO analysis of the 905 down-regulated genes. c, Heat map representation of markedly up-regulated genes (FC>1.5) in at least E9.5 PatKO embryos. d, GO analysis of the 635 up-regulated genes.
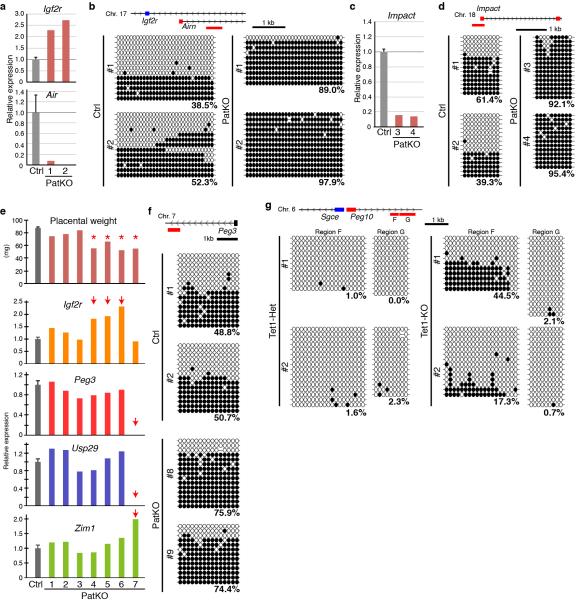
To confirm that dysregulation of imprinted genes is indeed linked to perturbation of DNA methylation, we performed conventional bisulfite sequencing (BS-seq). While the Peg10-DMR was methylated to ~50% in controls, the DMR is almost fully methylated in Peg10-dysregulated Tet1-PatKO embryos (Fig. 3e). These data are consistent with previous findings that Peg10 and Sgce are specifically expressed from the unmethylated paternal allele and are silenced at the methylated maternal allele 10. Thus, our data support the notion that hypermethylation of the paternal allele leads to silencing of Peg10, which causes early embryonic lethality of PatKO embryos through placental malfunction. Similar analysis also revealed hypermethylation of the Air/Igf2r and Impact loci in Air/Igf2r- and Impact-dysregulated PatKO embryos, respectively (Extended Data Fig. 4a-d), further confirming the relationship between DMR hypermethylation and altered imprinted gene expression in Tet1-PatKO embryos.
Extended Data Figure 4. Hypermethylation in germline differentially methylated regions in Tet1-paternally KO embryos and placentae, and Tet1-KO sperm.
a, RT-qPCR analysis of Igf2r and Air of E9.5 embryos. The average value of Ctrl embryos (n=13) is set as 1. Error bar, S.E.M. b, Bisulfite sequencing analysis of Air/Igf2r-DMR of E9.5 embryos. Analyzed region is indicated by red line at the top of the diagram. Each CpG is represented by a circle with methylation and non-methylation represented by open and filled circles, respectively. The percentages of DNA methylation are indicated. c, RT-qPCR analysis of Impact of E9.5 embryos. The average value of Ctrl embryos (n=13) is set as 1. Error bar, S.E.M. d, Bisulfite sequencing analysis of Impact-DMR of E9.5 embryos. Analyzed region is indicated by red line at the top of the diagram. e, The weight of individual E19.5 PatKO placenta (top) and RT-qPCR analysis of several imprinted gene expression in each placenta. The average value of Ctrl placentae (n=19) is set as 1. Asterisks indicate small placentae. Arrows indicate the samples showing marked change in expression levels. Error bar, S.E.M. f, Bisulfite sequencing analysis of Peg3-DMR of E19.5 placentae. Analyzed region is indicated at the top of the diagram. The percentages of DNA methylation are indicated. g, Bisulfite sequencing analysis of the Peg10-DMR in Tet1-Het and KO sperm. Analyzed region is indicated by red line at the top of the diagram.
Proper expression of imprinted genes is critical for placental development and fetal growth 8. To examine whether the growth defects observed in PatKO embryos are caused by imprinting defects in the placenta, we analyzed gene expression in E19.5 PatKO placentae. RT-qPCR analysis demonstrates that several imprinted genes are dysregulated in smaller placentae of PatKO (Extended Data Fig. 4e #4-7). The expression level of Igf2r in placentae of PatKO-#4-6 is about twice as much as that in control, indicating biallelic expression. Similarly, Peg3, Usp29, and Zim1 are concurrently dysregulated in the placenta of PatKO-#7. Furthermore, BS-seq analysis revealed that Peg3-DMR is hypermethylated in Peg3-negative placentae of Pat-KO (Extended Data Fig. 4f). These data suggest that imprinting of the paternal allele at these loci is maternalized, which likely accounts for the placental developmental defects.
The maternalization in imprinted gene expression and DMR methylation of the paternal allele in PatKO embryos and placentae prompted us to ask whether the aberrant DNA methylation pattern originates from the sperm genome of Tet1-KO males. To this end, we performed BS-seq analysis, which revealed that part of the Peg10-DMRs remains methylated in Tet1-KO sperm, whereas the same region is nearly completely demethylated in the control sperm (Extended Data Fig. 4g).
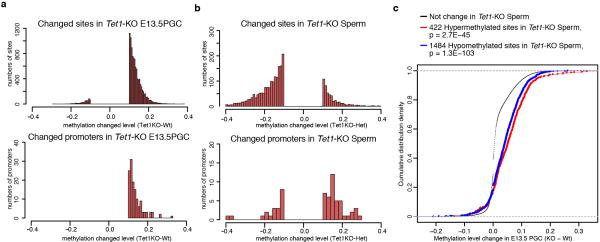
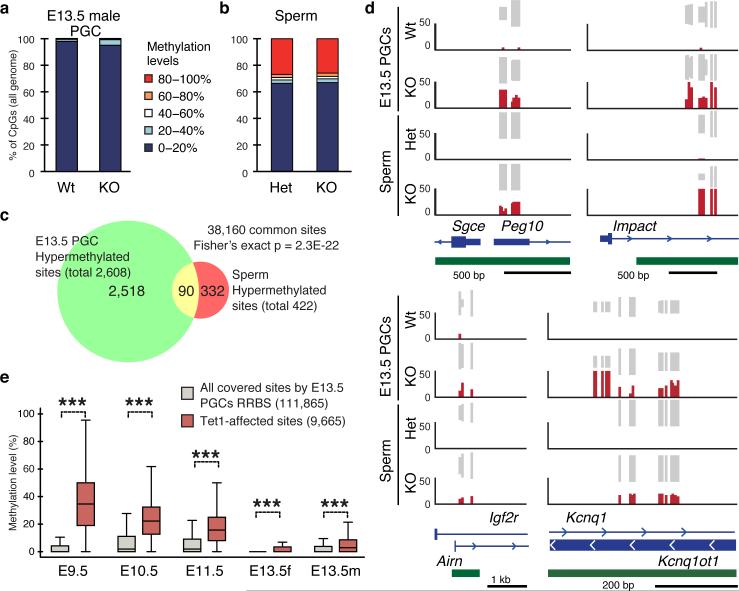
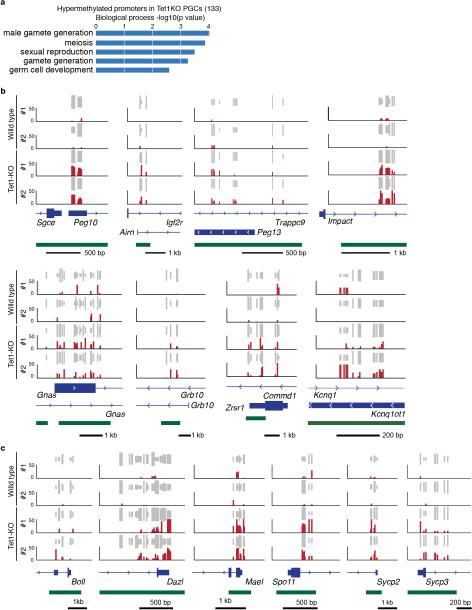
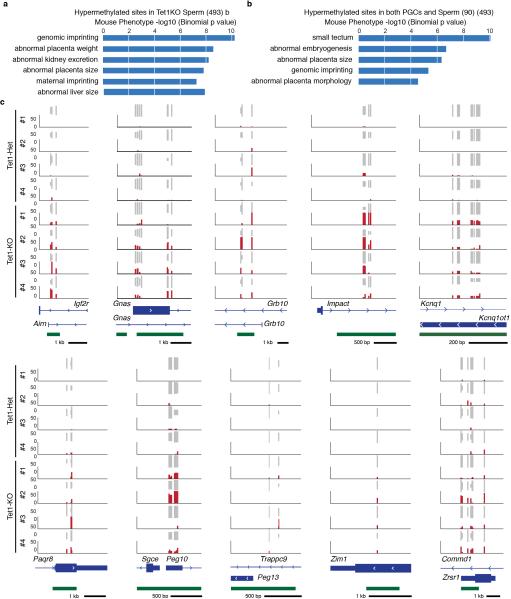
To determine whether hypermethylation of imprinted DMRs is a general phenomenon in Tet1-KO germ line, we performed global DNA methylation analysis of E13.5 male PGCs and sperm by reduced representative bisulfite sequencing (RRBS) (Extended Data Fig. 5a, b, Supplementary Table 4). Consistent with our previous report 7, no global change in DNA methylation levels was observed in E13.5 PGCs or sperm (Fig. 4a, b). However, the analysis identified 2608 (6.8 % of commonly covered sites) and 422 (1.1 % of commonly covered sites) hypermethylated sites in Tet1-KO PGCs and sperm, respectively (Supplementary Table 5, 6). Among the 422 hypermethylated sites in Tet1-KO sperm, 348 (82.5%) have already exhibited increased DNA methylation in E13.5 male PGCs, and 90 of them exhibited more than 10% increase (Fig. 4c, Extended Data Fig. 5c, Supplementary Table 7). Importantly, a number of imprinted gene loci, including 7 out of 12 covered known germline DMRs were significantly enriched among these common hypermethylated sites (Fig. 4d, and Extended Data Fig. 6, 7, and Supplementary Table 8). This indicates that most of the hypermethylation in the PatKO embryos can be traced back to sperm and E13.5 PGCs, and clearly demonstrate that hypermethylation in Tet1-KO sperm is mainly caused by defective PGC reprogramming. Interestingly, hypermethylation of meiotic genes were only observed in PGCs, but not in sperm (Extended Data Fig. 6a, c). This suggests that passive demethylation and/or other Tet proteins may compensate for the Tet1 deficiency during spermatogenesis, which may explain why meiotic phenotype is only observed in Tet1-null female 7. Consistent with the Tet1 expression dynamics in PGCs and its capacity in oxidizing 5mC to 5hmC, temporal enrichment of 5hmC in DMRs of Kcnq1ot1, Peg3, Peg10, and Igf2r has been previously reported in reprogramming PGCs 11. The 5hmC in PGCs generated by Tet1 is likely been diluted by replication-dependent manner 12,13.
Extended Data Figure 5. Summary of RRBS analysis.
a, b, Distribution of the methylation change level for changed sites and promoters in E13.5 PGCs (a) and Sperm (b) (cutoff, 10 %). c, Cumulative distribution curve of methylation change in E13.5 PGC for the methylation changed sites in Tet1-KO sperm. Note that methylation level in E13.5 Tet1-KO PGCs of both 422 hypermethylated sites in sperm (red) and 1484 hypomethylated sites in sperm (blue) are higher than that of non-changed sites.
Figure 4. Locus-specific hypermethylation in Tet1-KO PGCs and sperm.
a,b, Genome methylation state of E13.5 PGCs (a) and sperm (b). c, Venn diagram showing the overlap between hypermethylated sites (increased >10%) in Tet1-KO PGCs and sperm. d, Representative DNA methylation profiles of imprinted genes in E13.5 male PGCs and sperm analyzed by RRBS. Vertical grey lines represent the sequence read depth for each cytosine scored, and 30 reads are shown at the most. The vertical red lines represent percentage of methylation for each cytosine scored, which range from 0 to 50%. For each gene, RefSeq exon organization (blue) and location of CGIs (green) are shown at the bottom. e, Methylation dynamics of Tet1-affected sites. Methylation level of hypermethylated sites in Tet1-KO E13.5 PGCs are analyzed based on published data sets 14. Note that methylation levels of Tet1-affected sites are significantly higher in E9.5 to E11.5 compared to all covered sites. ***P<1.0E-15.
Extended Data Figure 6. Hypermethylation in Tet1-KO E13.5 PGC at imprinted genes and germ line genes.
a, GO analysis of the genes with hypermethylated promoters in Tet1-KO E13.5 PGCs. b,c, Representative DNA methylation profiles of selected imprinting genes (b) and germ line genes (c) in E13.5 PGCs analyzed by RRBS. Vertical grey lines represent the sequence read depth for each cytosine scored, and 30 reads were shown at most. The vertical red lines represent percentage of methylation for each cytosine scored, which range from 0 to 50%. For each gene, RefSeq exon organization (blue) and location of CGIs (green) are shown at the bottom.
Extended Data Figure 7. Hypermethylation in Tet1-KO sperm at imprinted genes.
a,b, Mouse phenotype ontology enrichment of hypermethylated sites in Tet1-KO sperm (a) and hypermethylated sites in both Tet1-KO E13.5 PGCs and sperm (b). c, Representative DNA methylation profiles of selected imprinting genes in sperm analyzed by RRBS. Vertical grey lines represent the sequence read depth for each cytosine scored, and 30 reads were shown at most. The vertical red lines represent percentage of methylation for each cytosine scored, which range from 0 to 50%. For each gene, RefSeq exon organization (blue) and location of CGIs (green) are shown at the bottom.
To understand why only a limited number of sites were hypermethylated in response to Tet1 depletion, we analyzed the methylation dynamics of these hypermethylated sites during PGC reprogramming. Previous studies have established that PGC demethylation takes place in two stages 14. The first wave of demethylation completes before E9.5 as more than 70 % of CpGs have already been demethylated in E9.5 PGCs. Consistently, the majority of our RRBS-covered sites have already been demethylated at the early phase of control PGCs, as the average methylation level in E9.5 PGCs dropped to 6.4% (Fig. 4e). Since Tet1 is not up-regulated till after E9.5, the first wave of demethylation is Tet1-independent 7,12. In contrast, Tet1-affected sites remain to be methylated even in E10.5 and E11.5 PGCs, indicating Tet1 targets are enriched in the late demethylated group 14,15 (Fig. 4e, and Extended Data Fig. 8a). Indeed, more than 40 % of late demethylated promoters identified by Seisenberger et al 14 exhibited hypermethylation in Tet1-KO PGCs (P<1.0E-15, Extended Data Fig. 8b). These data suggest that Tet1 plays a major role in the second wave of demethylation in PGCs. Given that these late-demethylated regions affected by Tet1 do not have a consensus DNA sequence motif (data not shown), we believe that instead of being specifically targeted, Tet1 functions to remove the remaining methylation that escaped the first wave of demethylation, including imprinted genes. How the “late-demethylated regions” are protected from the first wave of DNA demethylation awaits to be determined.
Extended Data Figure 8. Tet1 KO affected loci are enriched in late demethylated regions in PGCs.
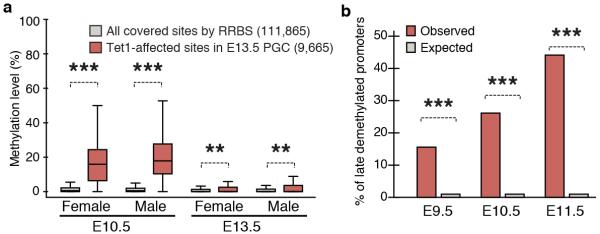
a, Methylation dynamics of the loci that are hypermethylated in Tet1-KO E13.5 PGCs. Methylation levels were obtained from the previous study (Kobayashi et al., 2013). b, Percentages of hypermethylated promoters in Tet1-KO PGCs among late demethylated promoters. The RRBS covered promoters with >25% methylation in E9.5, E10.5 and E11.5 PGCs (Seisenberger et al., 2012) were analyzed. ***P<1.0E-15, **P<0.01.
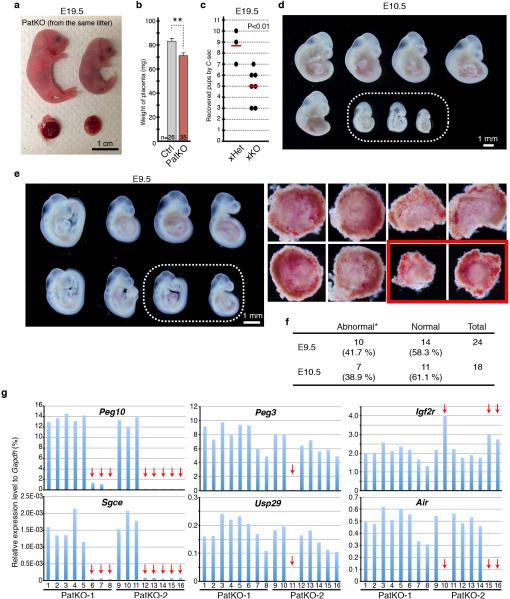
During the preparation of this manuscript, Dawlaty et al. reported that some progenies from Tet1, Tet2-double KO (T1T2-DKO) males crossed with wild-type or T1T2 double-heterozygous females exhibited hypermethylation and dysregulation in a few imprinted genes 16. To further confirm the role of Tet1 in imprinting erasure, we used the same Tet1-KO strain used by Dawlaty et al. 17 and demonstrated a similar PatKO defects (Extended Data Fig. 9) indicating that Tet2 cannot compensate for Tet1's function in imprinting erasure (Supplementary discussion).
Extended Data Figure 9. Early embryonic lethality and dysregulation of imprinted gene expression in Tet1 paternal KO mice generated by Dawlaty et al.
a, Representative image of PatKO pups from the same litter showing big variation in body and placenta sizes. Embryos and their placentae were recovered by C-section at the day of birth (E19.5). b, Average placental weights at E19.5. Error bars indicate S.E.M. **P<0.01. c, Mating scores of xHet (Tet1+/− male × wild-type female) and xHomo (Tet1−/− male × wild-type female). Black dots indicate the number of pups for each litter recovered by C-section at E19.5. Red lines indicate the mean litter size. d, Representative image of E10.5 Tet1-PatKO embryos from the mating of wild-type female with Tet1-KO male. Dotted circle indicates morphologically abnormal embryos. e, Left, E9.5 PatKO embryos recovered from a single litter. Dotted circles indicate small embryos whose placentae are morphologically abnormal. Right, placentae of the corresponding embryos showing at the left panel. Red rectangles indicate morphologically abnormal placentae. f, Summary of embryonic abnormality. * The numbers of morphologically abnormal embryos (E10.5) or placentae (E9.5). g, RT-qPCR analysis of selected imprinted genes in each of the E9.5 embryos from two litters (PatKO-1 and 2) are shown. Arrows indicate the samples showing marked change in expression level. The Ct values are normalized to the expression level of Gapdh.
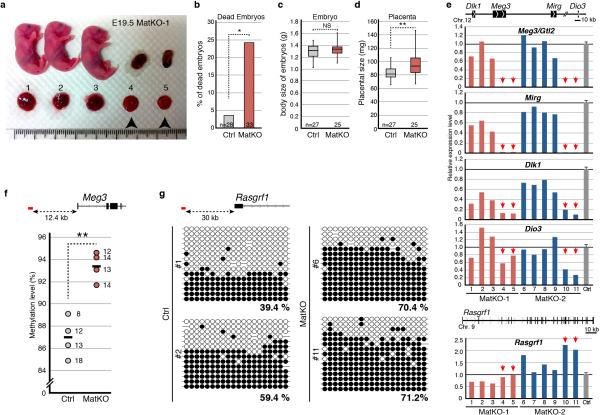
We next asked whether Tet1 also has a role in imprinting erasure in female germ line. To this end, we generated Tet1 maternal KO (MatKO) by crossing Tet1-KO female with wild-type male. We observed lethality in about 25% of MatKO embryos with relatively normal placenta (Extended Data Fig. 10a, b). The placentae of the survived embryos are significantly larger compared to that of the control although they have a comparable body size (Extended Data Fig. 10c, d). RT-qPCR analysis revealed silencing of paternally imprinted genes such as Meg3/Dlk1 and Mirg in all of the placentae of dead embryos (Extended Data Fig. 10e). Additionally, Rasgrf1 was also up-regulated in some of the MatKO placentae (eg. #6, 10, and 11). Consistent with abnormal expression of Meg3/Dlk1, Mirg, and Rasgrf1, hypermethylation of both IG-DMR and Rasgrf1 was observed in abnormal placentae (Extended Data Fig. 10f, g). These results suggest that Tet1 is involved in imprinting erasure of not only maternal DMRs in male germ line, but also paternal DMRs in female germ line.
Extended Data Figure 10. Defects in embryonic development and genomic imprinting in E19.5 Tet1 maternal KO embryos and placentae.
a, Representative image of embryos and placentae from a single litter of E19.5 Tet1-MatKO. Arrowheads indicate dead embryos whose placentae were morphologically normal. b, The ratio of dead embryos with relatively normal placentae. c,d, Box blot representation of the weight of embryos (c) and placentae (d). e, RT-qPCR analysis of paternally imprinted genes in Tet1-MatKO placentae. Arrows indicate the placentae whose embryo found dead in utero, as indicated by arrowheads in (a). The average value of Ctrl embryos (n=19) is set as 1. Error bar, S.E.M. f, BS-seq revealed hypermethylation in Tet1-MatKO in the IG-DMR locus. Note that methylation level in Tet1-MatKO was significantly higher than in Ctrl, although IG-DMR gained methylation during placental development. Each dot represents the methylation level of each placenta. The numbers next to each dot indicate the number of clones sequenced. The average methylation levels are indicated by lines. Analyzed region is indicated by red line at the top of the diagram. g, BS-seq analysis of Rasgrf1-DMR of E19.5 placentae. Analyzed region is indicated by red line at the top of the diagram. Each CpG is represented by a circle with methylation and non-methylation represented by open and filled circles, respectively. The percentages of DNA methylation are indicated. *P<0.05. **P<0.01.
Collectively, our studies clearly demonstrate that Tet1 plays an important role in the erasure of genomic imprinting. Although some factors, such as Aid and Tdg, have been proposed to play a role in imprinting erasure, evidence demonstrating a loss of functional effect at the next generation is still missing 18,19. As far as we know, our current study is the first that reports a factor critical for imprinting erasure with physiological evidences. Consistent with our study, Piccolo et al. also revealed that Tet1-mediated oxidation is essential for the erasure of genomic imprinting in cell fusion experiments 20. The phenotypic variation observed in each Tet1-PatKO embryo can be explained by the variable DMR methylation remaining in each Tet1-KO sperm (Extended Data Fig. 11, Supplementary discussion). It is well-known that abnormalities in genomic imprinting can cause various human diseases 1. The conservation of Tet1 function in humans and mice raises the possibility that human Tet1 may also play an important role in imprinting erasure (Supplementary discussion). Future studies should reveal whether dysfunction of Tet1 contributes to growth restriction or other imprinting related syndromes.
Extended Data Figure 11. Model explaining Tet1-PatKO phenotypes, using one maternal germline DMR as an example.
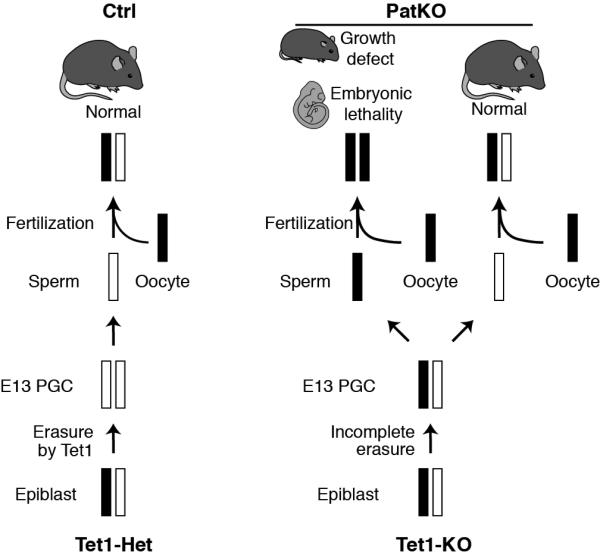
Black and white bars represent methylated and unmethylated state, respectively. In the control, maternal allele is completely demethylated through Tet1-mediated imprinting erasure during PGC reprogramming. On the other hand, in Tet1-KO PGCs, DMRs fail to be demethylated. The remaining methylation in the maternal allele is inherited to the next generation, which leads to imprinting defects.
Methods
Mice
All animal studies were performed in accordance with guidelines of the Institutional Animal Care and Use Committee at Harvard Medical School. The Tet1-KO mouse strain (B6;129S4-Tet1tm1.1Jae/J) was purchased from Jackson Laboratory 17. All male mice were mated with C57BL/6J female and the mating is timed in the way that appearance of vaginal plug at noon is defined as embryonic day (E) 0.5. E19.5 embryos and placentae were harvested by dissecting pregnant females with progesterone injection at E17.5 and E18.5. All data presented were generated by using three or four separate mating pairs as biological replicates.
Histology
Embryos and placentae in the uterus were fixed in 4% paraformaldehyde, dehydrated in ethanol, and embedded in paraffin. For histological analysis, sections (5 μm) were stained with H&E.
RNA isolation and RT-qPCR
Dissected embryos and placentae were homogenized with a pestle. Total RNAs were isolated with TRizol (Life technologies), and cDNAs were generated with random primer sets and Superscript III first-strand synthesis system (Invitrogen). Real-time qPCR reactions were performed on an ABI ViiA7 sequence detection system (Applied Biosystems) using SYBR Green (Applied Biosystems). Relative gene expression levels were calculated using comparative Ct values, in which Ct is the cycle threshold number, and normalized to Gapdh. RT-qPCR primers are listed in Supplementary Table 9.
PGC purification for RRBS
E13.5 male PGCs were purified as described previously7. Briefly, the transgenic mouse line containing the GOF18DPE-EGFP [Tg(Pou5f1-EGFP)] transgene was purchased from Jackson Laboratory. E13.5 genital ridge cells were dissociated with 0.05% trypsin/EDTA treatment with pipetting. After washing with phosphate buffer medium (PB1)/BSA solution, tissues were incubated in hyaluronidase, washed and then re-suspend in PBS. Germ cells were purified based on the expression of GFP using FACS Aria II flow cytometry (BD Bioscience), and stored in −80°C until use. Two biological replicates for Tet1-KO and wild type PGCs were combined and split into two as the technical replicates.
RNA-seq library preparation and data analysis
Total RNA was purified with an RNeasy Mini Kit (QIAGEN), in which an on-column DNase treatment was included. 500 ng of purified RNA was then subjected to mRNA isolation and library preparation using a NEBNext Ultra RNA Directional Library Prep Kit for Illumina with the Poly (A) mRNA Magnetic Isolation Module (NEB) following manufacturer's instructions. Libraries were pooled and sequenced on an Illumina HISEQ 2500 (single-end, 50bp). RNA-seq data analysis was performed with Tophat and Cufflinks using the UCSC mm9 annotation 24. Functional annotation of the dysregulated genes was performed with DAVID25.
Bisulfite sequencing and RRBS
BS-seq was performed using the EZ DNA methylation Gold kit (Zymo Research) following the manufacturer's instruction. Primers for BS-seq are listed in Supplementary Table 9 21,22. For RRBS, the libraries were generated essentially as previously described23,26, with some modifications. Briefly, DNA was digested with MspI (NEB), and then subjected to end repair, and ligation of methylated custom adaptors (Forward: 5’-ACACTCTTTCCCTACACGACGCTCTTCCGATC*T-3’, Reverse: 5’-/5Phos/GATCGGAAGAGCACACGTCTGAACTCCAGTC-3’, where * indicates phosphorothioate bond) with a NEBNext Ultra DNA Library Prep Kit for Illumina (NEB). Size selection was conducted by purifying the adaptor-ligated DNA twice with 1.5× SPRIselect beads (Beckman Coulter). Size selected libraries were treated with sodium bisulfite using the EpiTect Fast Bisulfite Conversion Kit (QIAGEN). After clean-up, the optimal, minimum PCR cycle numbers required to generate the final libraries were determined by qPCR using KAPA 2G Robust HotStart ReadyMix (KAPA) with 0.3× SYBR I. Final libraries were generated by scaled-up PCR reactions (without SYBR I) using the cycles determined above with barcoded primers from NEBNext Multiplex Oligos kit (NEB), and purified with 1.2× SPRIselect beads. Libraries were pooled and sequenced on an Illumina Hiseq 2500 (single-end, 50bp).
Adapter trimming for raw reads from each sample was performed using Trim Galore (Babraham Bioinformatics), and the data quality was examined using FastQC (Babraham Bioinformatics). The trimmed reads were mapped against the mouse genome (mm9 build) with Bismark v0.7.12 27, and the methylation call for every single C was extracted by bismark methylation extractor script. All programs were performed with default setting. We only keep the CpGs that were covered by at least 8 reads (common 8x CpGs). The methylation pattern was visualized by Integrative Genomics Viewer (IGV)7. For 100 bp tiles and the promoters, reads for the CpGs that were covered at least 8x in each sample were pooled and used to estimate the methylation level by taking the number of reads reporting a C, divided by the total number of reads reporting a C or T. We keep the 100 bp sites and the promoters with at least 2 and 4 common 8× CpGs for subsequent analyses. Repetitive regions were masked before DMR calling. More than 10% methylation level changes were required to be classified as changed sites or promoters. Based on the assumption that no hypomethylated sites in Tet1-KO PGCs should appear, estimated empirical false discovery rate (FDR) by the number of hypomethylated sites in Tet1-KO PGCs was 0.054. Annotation of CpG islands was obtained from a previous report based on pull down experiments28. Promoters were defined as the region −1.5kb to +1.5kb of the transcription start site as annotated in Refseq genes. Repeat annotations were extracted from the UCSC Table Browser RepeatMasker track (mm9 build). DMRs were functional characterized by GREAT29 using the Mouse Genome Informatics (MGI) Phenotype ontology30. Publically available datasets for whole genome bisulfite sequencing (WGBS) data sets in PGCs 14,15 were included in this analysis where indicated. For WGBS data analyses, all the informative CpGs were used, and the methylation level in a region were estimated by taking the number of reads reporting a C, divided by the total number of reads reporting a C or T. We required that there are at least 20 methylated or unmethylated cytosine observations in the region for each sample.
Supplementary Material
Acknowledgement
We thank Wei Jiang for help with FACS sorting of PGCs; Azusa Inoue, Shogo Matoba, and Diana Cai for critical reading of the manuscript. This project is supported by NIH U01DK089565 (to Y.Z.). S.Y. is supported by a postdoctoral fellowship from the Japan Society for the Promotion of Science (JSPS). Y.Z. is an investigator of the Howard Hughes Medical Institute. The accession number for the RNA-seq and RRBS data presented in this study is available from the Gene Expression Omnibus (GEO) database under accession GSE49764.
Footnotes
Author contributions
S.Y. and Y.Z. conceived the project, designed the experiments, and write the manuscript; S.Y., L.S., Y.L., and D.S. performed experiments and analyzed the data.
The authors declare no competing financial interests.
References
- 1.Bartolomei MS, Ferguson-Smith AC. Mammalian genomic imprinting. Cold Spring Harbor perspectives in biology. 2011;3:a002592. doi: 10.1101/cshperspect.a002592. [DOI] [PMC free article] [PubMed] [Google Scholar]
- 2.Li Y, Sasaki H. Genomic imprinting in mammals: its life cycle, molecular mechanisms and reprogramming. Cell Research. 2011;21:466–473. doi: 10.1038/cr.2011.15. [DOI] [PMC free article] [PubMed] [Google Scholar]
- 3.Kaneda M, et al. Essential role for de novo DNA methyltransferase Dnmt3a in paternal and maternal imprinting. Nature. 2004;429:900–903. doi: 10.1038/nature02633. [DOI] [PubMed] [Google Scholar]
- 4.Ito S, et al. Role of Tet proteins in 5mC to 5hmC conversion, ES-cell self-renewal and inner cell mass specification. Nature. 2010;466:1129–1133. doi: 10.1038/nature09303. [DOI] [PMC free article] [PubMed] [Google Scholar]
- 5.Tahiliani M, et al. Conversion of 5-methylcytosine to 5-hydroxymethylcytosine in mammalian DNA by MLL partner TET1. Science. 2009;324:930–935. doi: 10.1126/science.1170116. [DOI] [PMC free article] [PubMed] [Google Scholar]
- 6.Shen L, Zhang Y. 5-Hydroxymethylcytosine: generation, fate, and genomic distribution. Current Opinion in Cell Biology. 2013;25:289–296. doi: 10.1016/j.ceb.2013.02.017. [DOI] [PMC free article] [PubMed] [Google Scholar]
- 7.Yamaguchi S, et al. Tet1 controls meiosis by regulating meiotic gene expression. Nature. 2012;492:443–447. doi: 10.1038/nature11709. [DOI] [PMC free article] [PubMed] [Google Scholar]
- 8.Nelissen ECM, van Montfoort APA, Dumoulin JCM, Evers JLH. Epigenetics and the placenta. Human Reproduction Update. 2011;17:397–417. doi: 10.1093/humupd/dmq052. [DOI] [PubMed] [Google Scholar]
- 9.Ono R, et al. Deletion of Peg10, an imprinted gene acquired from a retrotransposon, causes early embryonic lethality. Nature Genetics. 2006;38:101–106. doi: 10.1038/ng1699. [DOI] [PubMed] [Google Scholar]
- 10.Ono R, et al. Identification of a large novel imprinted gene cluster on mouse proximal chromosome 6. Genome Research. 2003;13:1696–1705. doi: 10.1101/gr.906803. [DOI] [PMC free article] [PubMed] [Google Scholar]
- 11.Hackett JA, et al. Germline DNA demethylation dynamics and imprint erasure through 5-hydroxymethylcytosine. Science. 2013;339:448–452. doi: 10.1126/science.1229277. [DOI] [PMC free article] [PubMed] [Google Scholar]
- 12.Kagiwada S, Kurimoto K, Hirota T, Yamaji M, Saitou M. Replication-coupled passive DNA demethylation for the erasure of genome imprints in mice. The EMBO Journal. 2013;32:340–353. doi: 10.1038/emboj.2012.331. [DOI] [PMC free article] [PubMed] [Google Scholar]
- 13.Yamaguchi S, et al. Dynamics of 5-methylcytosine and 5-hydroxymethylcytosine during germ cell reprogramming. Cell Research. 2013;23:329–339. doi: 10.1038/cr.2013.22. [DOI] [PMC free article] [PubMed] [Google Scholar]
- 14.Seisenberger S, et al. The Dynamics of Genome-wide DNA Methylation Reprogramming in Mouse Primordial Germ Cells. Molecular Cell. 2012;48:849–862. doi: 10.1016/j.molcel.2012.11.001. [DOI] [PMC free article] [PubMed] [Google Scholar]
- 15.Kobayashi H, et al. High-resolution DNA methylome analysis of primordial germ cells identifies gender-specific reprogramming in mice. Genome Research. 2013;23:616–62. doi: 10.1101/gr.148023.112. [DOI] [PMC free article] [PubMed] [Google Scholar]
- 16.Dawlaty MM, et al. Combined Deficiency of Tet1 and Tet2 Causes Epigenetic Abnormalities but Is Compatible with Postnatal Development. Developmental Cell. 2013;24:310–323. doi: 10.1016/j.devcel.2012.12.015. [DOI] [PMC free article] [PubMed] [Google Scholar]
- 17.Dawlaty MM, et al. Tet1 is dispensable for maintaining pluripotency and its loss is compatible with embryonic and postnatal development. Cell Stem Cell. 2011;9:166–175. doi: 10.1016/j.stem.2011.07.010. [DOI] [PMC free article] [PubMed] [Google Scholar]
- 18.Cortellino S, et al. Thymine DNA glycosylase is essential for active DNA demethylation by linked deamination-base excision repair. Cell. 2011;146:67–79. doi: 10.1016/j.cell.2011.06.020. [DOI] [PMC free article] [PubMed] [Google Scholar]
- 19.Popp C, et al. Genome-wide erasure of DNA methylation in mouse primordial germ cells is affected by AID deficiency. Nature. 2010;463:1101–1105. doi: 10.1038/nature08829. [DOI] [PMC free article] [PubMed] [Google Scholar]
- 20.Piccolo FM, et al. Different Roles for Tet1 and Tet2 Proteins in Reprogramming-Mediated Erasure of Imprints Induced by EGC Fusion. Molecular Cell. 2013;49:1023–1033. doi: 10.1016/j.molcel.2013.01.032. [DOI] [PMC free article] [PubMed] [Google Scholar]
- 21.Kobayashi H, et al. Bisulfite sequencing and dinucleotide content analysis of 15 imprinted mouse differentially methylated regions (DMRs): paternally methylated DMRs contain less CpGs than maternally methylated DMRs. Cytogenetic and genome research. 2006;113:130–137. doi: 10.1159/000090824. [DOI] [PubMed] [Google Scholar]
- 22.Tomizawa S.-i, et al. Dynamic stage-specific changes in imprinted differentially methylated regions during early mammalian development and prevalence of non-CpG methylation in oocytes. Development. 2011;138:811–820. doi: 10.1242/dev.061416. [DOI] [PMC free article] [PubMed] [Google Scholar]
- 23.Gu H, et al. Preparation of reduced representation bisulfite sequencing libraries for genome-scale DNA methylation profiling. Nature Protocols. 2011;6:468–481. doi: 10.1038/nprot.2010.190. [DOI] [PubMed] [Google Scholar]
- 24.Trapnell C, et al. Differential gene and transcript expression analysis of RNA-seq experiments with TopHat and Cufflinks. Nature Protocols. 2012;7:562–578. doi: 10.1038/nprot.2012.016. [DOI] [PMC free article] [PubMed] [Google Scholar]
- 25.Huang DW, Sherman BT, Lempicki RA. Systematic and integrative analysis of large gene lists using DAVID bioinformatics resources. Nature Protocols. 2009;4:44–57. doi: 10.1038/nprot.2008.211. [DOI] [PubMed] [Google Scholar]
- 26.Boyle P, et al. Gel-free multiplexed reduced representation bisulfite sequencing for large-scale DNA methylation profiling. Genome Biol. 2012;13:R92. doi: 10.1186/gb-2012-13-10-r92. [DOI] [PMC free article] [PubMed] [Google Scholar]
- 27.Krueger F, Andrews SR. Bismark: a flexible aligner and methylation caller for Bisulfite-Seq applications. Bioinformatics. 2011;27:1571–1572. doi: 10.1093/bioinformatics/btr167. [DOI] [PMC free article] [PubMed] [Google Scholar]
- 28.Illingworth RS, et al. Orphan CpG islands identify numerous conserved promoters in the mammalian genome. PLoS Genetics. 2010;6:e1001134. doi: 10.1371/journal.pgen.1001134. [DOI] [PMC free article] [PubMed] [Google Scholar]
- 29.McLean CY, et al. GREAT improves functional interpretation of cis-regulatory regions. Nature Biotechnology. 2010;28:495–501. doi: 10.1038/nbt.1630. [DOI] [PMC free article] [PubMed] [Google Scholar]
- 30.Blake JA, et al. The Mouse Genome Database genotypes::phenotypes. Nucleic Acids Research. 2009;37:D712–719. doi: 10.1093/nar/gkn886. [DOI] [PMC free article] [PubMed] [Google Scholar]
Associated Data
This section collects any data citations, data availability statements, or supplementary materials included in this article.


