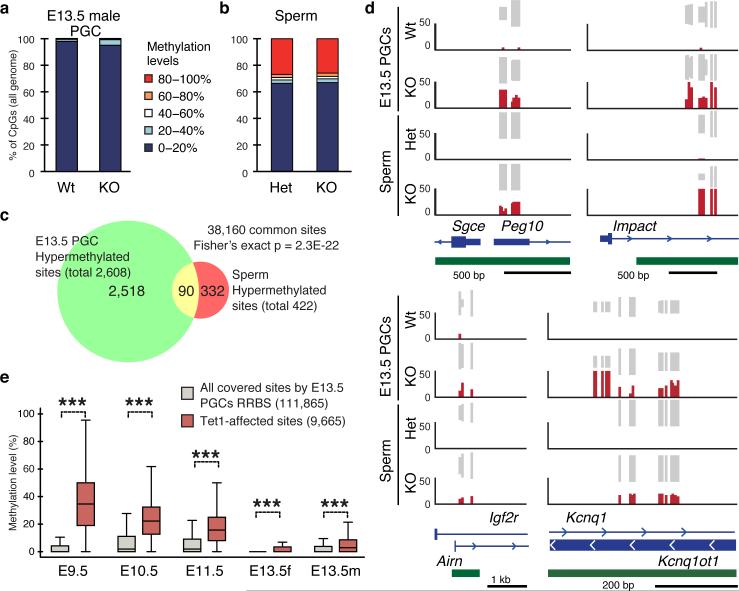
Figure 4. Locus-specific hypermethylation in Tet1-KO PGCs and sperm.
a,b, Genome methylation state of E13.5 PGCs (a) and sperm (b). c, Venn diagram showing the overlap between hypermethylated sites (increased >10%) in Tet1-KO PGCs and sperm. d, Representative DNA methylation profiles of imprinted genes in E13.5 male PGCs and sperm analyzed by RRBS. Vertical grey lines represent the sequence read depth for each cytosine scored, and 30 reads are shown at the most. The vertical red lines represent percentage of methylation for each cytosine scored, which range from 0 to 50%. For each gene, RefSeq exon organization (blue) and location of CGIs (green) are shown at the bottom. e, Methylation dynamics of Tet1-affected sites. Methylation level of hypermethylated sites in Tet1-KO E13.5 PGCs are analyzed based on published data sets 14. Note that methylation levels of Tet1-affected sites are significantly higher in E9.5 to E11.5 compared to all covered sites. ***P<1.0E-15.

