Abstract
Here we introduce a fast, cost-effective, and highly efficient method for production of soluble fluorescent proteins from bacteria. The method does not require optimization, and does not utilize IPTG induction. The method relies on un-induced expression in the BL21-gold (DE3) strain of E. coli and yields large amounts (up to 0.4 μmoles) of fluorescent protein from a 250 mL culture. This method is much simpler than published methods, and can be used to produce any fluorescent protein that is needed in biomedical research.
Keywords: Fluorescent protein, gene expression, protein production, high-yield, FRET, His-Tag, E. coli.
Fluorescent proteins are widely used as reporters of molecular localization and molecular interactions in cells or in model systems. Quantitative fluorescence spectroscopic techniques, including Förster Resonance Energy Transfer (FRET)-based methods, often rely on calibrations that utilize purified solutions of soluble fluorescent proteins of known concentrations [1–5]. The production of such proteins from E. coli has traditionally relied on extensive and time consuming optimization of bacterial cultures, followed by optimization of Isopropyl β-D-1-thiogalactopyranoside (IPTG) induction of protein expression [6]. These production methods, however, are never guaranteed to work, even after many laborious optimization steps. Fluorescent proteins from commercial sources are very expensive, and an efficient and cost-effective method of fluorescent protein production will be of great utility to the researchers in the field. Here we report on such a method, which can be used for the production of any soluble fluorescent protein. The method is based on the un-induced expression of fluorescent proteins in a strain of E. coli, BL21-Gold (DE3). It does not require optimization, and does not utilize IPTG. The yield of the method matches or surpasses the best optimized scenarios for IPTG-induced protein yields.
We have expressed and purified four different fluorescent proteins using this new method. The genes encoding for these fluorescent proteins were cloned into a commonly used and commercially available bacterial vector (pRSETB). The pRSETB-mCherry plasmid was a gift from Dr. R. Tsien (University of California, San Diego, CA), and was used without further manipulation. The yellow fluorescent protein (YFP) plasmid was a gift from Dr. M. Edidin (Johns Hopkins University, Baltimore, MD). The GFP2 gene was received from Dr. V. Raicu (University of Wisconsin, Milwaukee, WI) and the mTurquoise gene was a gift from Dr. P. Park (Case Western Reserve University, Cleveland, OH). The cDNA for all four proteins encoded a start codon, an N-terminal His-tag (6xHistidine) sequence, and the gene for the fluorescent protein. To produce pRSETB-YFP, pRSETB-GFP2, and pRSETB-mTurquoise, the fluorescent protein cDNA was inserted between the BamHI and Hind III sites within the multiple cloning site of the pRSETB vector (which encodes for the PT7 promoter, pUC origin and Ampicillin resistance genes, and a stop codon at the 3′ end). All the plasmids were sequenced using the T7 forward and T7-term primers by Genewiz, Inc., and were subsequently used for E. coli transformation.
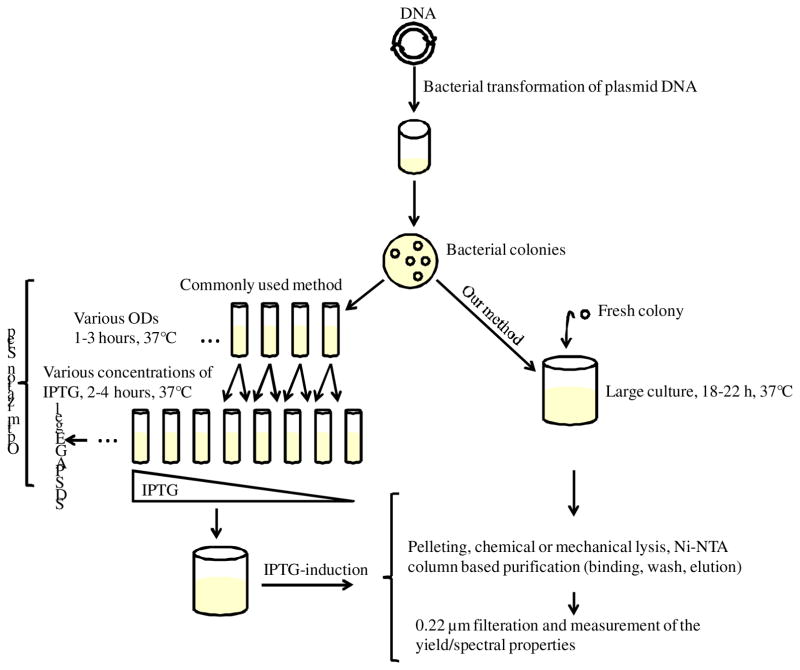
In commonly used procedures, small cultures of bacteria are first optimized for protein expression before moving to large cultures [6;7]. To do so, small cultures of LB media (~ 5mL) are inoculated with a bacterial glycerol stock from a previous culture, or with a freshly transformed E. coli colony. These cultures are then incubated at 37°C for different time periods to yield different optical densities (as measured in a UV-Vis spectrometer). The bacterial expression of fluorescent proteins is then induced by adding various amounts of IPTG. The expression time is varied to find the optimal conditions that ensure the highest yield of fluorescent proteins (usually assessed by SDS-PAGE). Once the optimum conditions are identified for the small culture, a large culture (100mL to 1L) is initiated and protein expression is induced with IPTG at the optimum optical density (Figure 1). Over the past few years we have attempted to use this procedure to produce large quantities of fluorescent proteins. Although we were successful several times, we also encountered many challenges. The optimization procedure was time-consuming and the yields were often very low, despite many optimization steps. Furthermore, the optimization did not always translate from small to large culture, and the reproducibility was low. In addition, the optimal optical density and IPTG concentration were different for each type of fluorescent protein and thus separate optimization procedures were required for each protein. Lastly, the E. coli glycerol stocks stored from previous bacterial cultures did not express the proteins under any of the optimized conditions.
Figure 1.
Protocols for fluorescent protein expression in E. coli. The commonly used method is on the left. Our new method is on the right.
We discovered, however, that fluorescent proteins are produced in BL21-Gold (DE3) cells without IPTG induction via un-induced expression that does not require optimization. BL21-Gold (DE3) Competent Cells (Agilent Technologies) are integral to this method of production, as other strains of E. coli did not prove suitable for high levels of un-induced expression. The E. coli cells were transformed with YFP, mCherry, GFP2, and mTurquoise-encoding plasmid DNA according to the manufacturer’s protocol. The bacteria were grown in LB growth media containing 100 μg/mL Ampicillin salt (Sigma Aldrich). We inoculated 250–300mL of LB media with a freshly transformed bacterial colony and cultured it for 18–22 hours at 37°C. To our amazement, we found that at the end of this long period of time visibly large quantities of the fluorescent proteins were produced without any IPTG addition. This was obvious from the change in the color of the LB media into the color of the fluorescent protein. The exact harvesting time within the 18–22 hour time window was not critical, unlike the stringent time requirements of common protocols.
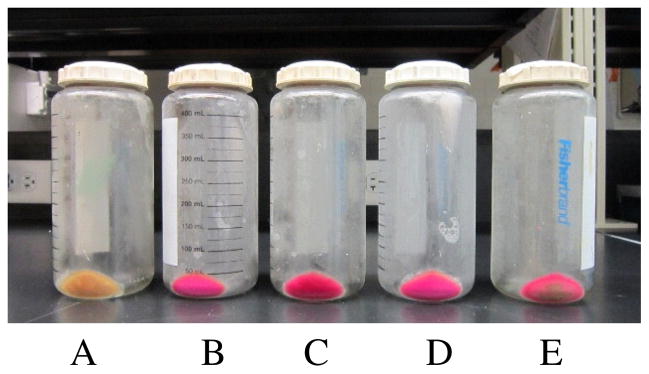
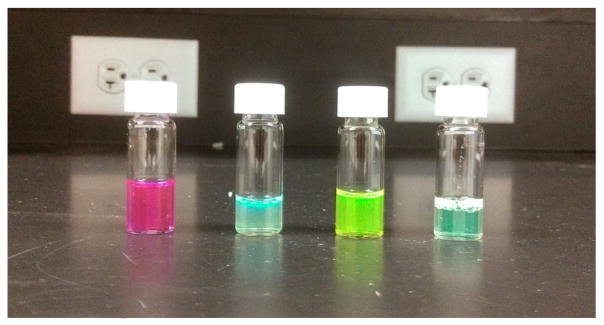
To purify the fluorescent proteins, the intact cells were pelleted using a Beckman Coulter centrifuge at 9000 rpm, 14 minutes, 4°C. The pellet was visibly colored (intense purple for mCherry (Figure 2B) and bright yellow to bright green for YFP, mTurquoise and GFP2). The intense color was an indication of successful fluorescent protein production and very high protein yields which we have never observed using the established protocols. The pellets could be stored at −20C or immediately lysed using Bugbuster® Master Mix (Invitrogen) with added protease inhibitor cocktail (complete mini EDTA-free tabs, Roche Applied Science). The lysate was gently agitated for 20 minutes at room temperature before centrifugation. Centrifugation was performed at 13000 rpm, at a temperature of 4°C, for 20 minutes. The supernatant of the bacterial lysate, which contained the fluorescent proteins, was collected and the fluorescent proteins were purified by nickel affinity chromatography. The column was filled with 2 mL of nickel-NTA Agarose resin (5Prime), which was pre-equilibrated in 50 mM NaH2PO4 and 0.5 M NaCl at pH 8.0. The lysate was added to the column in portions and equilibrated for 30–60 minutes after each lysate addition. A wash buffer (50 mM NaH2PO4,0.5 M NaCl, pH 8.0 with 20 mM Imidazole PH 6.0) was applied to the column three times, followed by an elution buffer (50 mM NaH2PO4, 0.5 M NaCl, pH 8.0 with 250 mM Imidazole PH 6.0) to collect the purified fluorescent protein fractions. Upon the completion of elution, the collected protein solution was passed through a 0.22 μm filter and the stock solutions (Figure 3) were stored at 4 °C. The concentration was measured by collecting the absorption spectra using a UV-Vis spectrometer (Cary 50, Varian). The yields measured for the different fluorescent proteins ranged from 0.02 μmoles to 0.4 μmoles, purified from a 250 mL culture. The fluorescent proteins produced from a single trial were sufficient to use in tens of imaging experiments for calibration purposes.
Figure 2.

The mCherry pellet. (A) IPTG-induced culture; (B) un-induced culture; (C) un-induced culture, 1 mg/mL glucose added after 6h; (D) un-induced culture, 1mg/mL glucose added after 12h; (E) un-induced culture, 500 mg/mL glucose added after 1h.
Figure 3.

Purified stocks of fluorescent proteins in phosphate saline buffer. From left to right: mCherry, mTurquoise, YFP and GFP2 solutions.
While we do not understand the exact mechanism behind this un-induced mass protein production, the critical step in the protocol is the long, 18–22h incubation time. The phenomenon that we observe here is likely similar to the so-called “auto-induction” reported previously [8;9]. It has been suggested that this auto-induction is caused by small amounts of lactose (usually present in yeast extract in LB media), and can be inhibited by the presence of glucose [8]. To test if glucose inhibits fluorescent protein production, we prepared three cultures from freshly transformed colonies and added 1mg/mL glucose after 6h and 12h of shaking. In addition, we prepared a culture where we added 500 mg/mL of glucose after 1h of shaking. In all these cases, after 22h we still observed high levels of fluorescent protein expression (Figure 2). Therefore, the glucose did not significantly suppress the production of fluorescent proteins in the absence of IPTG.
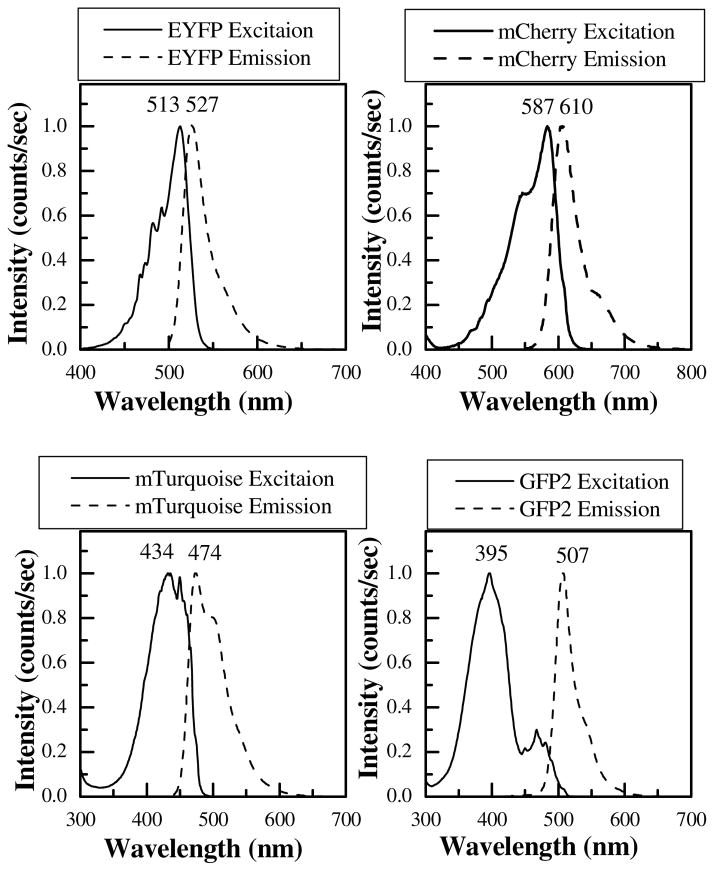
The spectral properties of the purified fluorescent proteins were recorded in a fluorometer. Figure 4 shows the excitation and emission spectra of each of the four fluorescent proteins that were produced and purified as described above. The resulting excitation and emission spectra were identical to the ones reported in the literature [1;10]. Therefore, this method provides a quick, high-yield production route for any soluble fluorescent protein that is needed for imaging purposes in biophysical research.
Figure 4.
Excitation and emission spectra of the produced fluorescent proteins: EYFP, mCherry, GFP2 and mTurquoise. The emission and excitation maxima (in nm) are also shown. Spectra are identical to the ones reported in the literature [10].
Acknowledgments
This work was supported by National Institute of Health grants GM68619 and GM95930.
Footnotes
Publisher's Disclaimer: This is a PDF file of an unedited manuscript that has been accepted for publication. As a service to our customers we are providing this early version of the manuscript. The manuscript will undergo copyediting, typesetting, and review of the resulting proof before it is published in its final citable form. Please note that during the production process errors may be discovered which could affect the content, and all legal disclaimers that apply to the journal pertain.
Reference List
- 1.Li E, Placone J, Merzlyakov M, Hristova K. Quantitative measurements of protein interactions in a crowded cellular environment. Anal Chem. 2008;80:5976–5985. doi: 10.1021/ac800616u. [DOI] [PubMed] [Google Scholar]
- 2.Singh DR, Mohammad MM, Patowary S, Stoneman MR, Oliver JA, Movileanu L, Raicu V. Determination of the quaternary structure of a bacterial ATP-binding cassette (ABC) transporter in living cells. Integrative Biology. 2013;5:312–323. doi: 10.1039/c2ib20218b. [DOI] [PMC free article] [PubMed] [Google Scholar]
- 3.Chen L, Novicky L, Merzlyakov M, Hristov T, Hristova K. Measuring the Energetics of Membrane Protein Dimerization in Mammalian Membranes. J Am Chem Soc. 2010;132:3628–3635. doi: 10.1021/ja910692u. [DOI] [PMC free article] [PubMed] [Google Scholar]
- 4.Chiu CS, Kartalov E, Unger M, Quake S, Lester HA. Single-molecule measurements calibrate green fluorescent protein surface densities on transparent beads for use with ‘knock-in’ animals and other expression systems. Journal of Neuroscience Methods. 2001;105:55–63. doi: 10.1016/s0165-0270(00)00354-x. [DOI] [PubMed] [Google Scholar]
- 5.Gerena-Lopez Y, Nolan J, Wang L, Gaigalas A, Schwartz A, Fernandez-Repollet E. Quantification of EGFP expression on molt-4 T cells using calibration standards. Cytometry Part A. 2004;60A:21–28. doi: 10.1002/cyto.a.20019. [DOI] [PubMed] [Google Scholar]
- 6.Patterson GH, Knobel SM, Sharif WD, Kain SR, Piston DW. Use of the green fluorescent protein and its mutants in quantitative fluorescence microscopy. Biophys J. 1997;73:2782–2790. doi: 10.1016/S0006-3495(97)78307-3. [DOI] [PMC free article] [PubMed] [Google Scholar]
- 7.Maniatas T, Frisch EF, Sambrook MD. Molecular Cloning: A Laboratory Manual. Cold Spring Harbor Laboratory; 1989. [Google Scholar]
- 8.Studier FW. Protein production by auto-induction in high-density shaking cultures. Protein Expr Purif. 2005;41:207–234. doi: 10.1016/j.pep.2005.01.016. [DOI] [PubMed] [Google Scholar]
- 9.Grossman TH, Kawasaki ES, Punreddy SR, Osburne MS. Spontaneous cAMP-dependent derepression of gene expression in stationary phase plays a role in recombinant expression instability. Gene. 1998;209:95–103. doi: 10.1016/s0378-1119(98)00020-1. [DOI] [PubMed] [Google Scholar]
- 10.Shaner NC, Steinbach PA, Tsien RY. A guide to choosing fluorescent proteins. Nature Methods. 2005;2:905–909. doi: 10.1038/nmeth819. [DOI] [PubMed] [Google Scholar]


