

Abstract
Chemical exchange saturation transfer (CEST) imaging is a novel MRI technique that is sensitive to biomolecules, local pH and temperature, and offers considerable advantages for in vivo applications. However, the magnitude of CEST effect for dilute CEST agents undergoing slow or intermediate chemical exchange is typically small, requiring the use of signal averaging to enhance its sensitivity. Given that T2-induced signal loss can be normalized by asymmetry analysis, the magnitude of CEST effect is independent of echo time. Therefore, CEST imaging with multi-echo echo planar imaging (EPI) readout should yield the same CEST effect as conventional single echo acquisition. Importantly, CEST multi-echo (CESTme) EPI images can be averaged to enhance CEST MRI sensitivity. The goal of this study was to validate CESTme EPI using a creatine-agarose gel CEST phantom with similar T2 as biological tissue. Using least-squares optimization, we found that the sensitivity of CESTme sequence is significantly higher than that obtained by conventional single echo CEST-EPI acquisition. Specifically, signal to noise ratio (SNR) and contrast to noise ratio (CNR) from the proposed CESTme EPI were approximately equivalent to that obtained by doubling the number of signal averages of the standard single echo CEST MRI sequence. In summary, our results demonstrate CESTme EPI for sensitivity-enhanced CEST imaging.
Keywords: Amide Proton Transfer (APT), Carr Purcell Meiboom Gill (CPMG), Chemical Exchange Saturation Transfer (CEST), Echo Planar Imaging (EPI), pH
1. INTRODUCTION
Chemical exchange saturation transfer (CEST) MRI is capable of measuring dilute labile protons, pH and temperature, and holds great promise for a host of biomedical applications (1–4). To date, CEST MRI has been applied in studies to image biomolecules, gene expression and enzyme activity, yielding novel results that have greatly enhanced our understanding of the underlying biological systems (5–9). In addition, endogenous amide proton CEST (APT) imaging is sensitive to pH and mobile protein or peptide levels, and may provide novel insights in disorders such as acute stroke, multiple sclerosis, and tumor (10–18). However, the magnitude of CEST effect is typically small, requiring that the CEST image sensitivity be enhanced for routine use (19–23).
For diamagnetic CEST (DIACEST) agents undergoing slow and intermediate chemical exchange, the CEST effect approaches its steady state exponentially (24,25). Hence, the conventional CEST MRI sequence includes long RF irradiation followed by image readout, including gradient echo, rapid acquisition with relaxation enhancement (RARE), fast low angle shot (FLASH), steady-state free precession (FISP) and echo planar imaging (EPI) (26–31). Given that signal decays following the same T2 relaxation, asymmetry analysis normalizes the confounding T2-decay in the control, reference, and label images, and the obtained CEST effect is independent of the echo time and T2. Because echo planar imaging (EPI) provides reasonable spatiotemporal coverage with readout time shorter than typical in vivo T2 values, there should be significant residual MR signal following the first echo acquisition, which has not been utilized fully by the routine CEST-EPI sequence. Our study aimed to develop and test whether CEST multi-echo (CESTme) EPI sequence provides significant sensitivity enhancement than the standard CEST single-echo EPI acquisition. To do so, we prepared a tissue-like creatine gel pH phantom, and evaluated the magnitude of the CEST effect, signal to noise (SNR) and contrast-to-noise ratio (CNR) as a function of the number of echoes and signal averages. Our results showed that the CEST effect obtained using CESTme MRI was independent of the echo time, and the use of a least-squares optimization algorithm provided significant sensitivity enhancement compared to the conventional single echo CEST-EPI sequence.
2. RESULTS
T1 and T2 maps showed very modest change with pH. For the respective pH 6.5 and 6.0 compartments, T1 was 2.76 ± 0.05 s and 2.71 ± 0.05 s; T2 measured 79.9 ± 2.1 ms and 81.7 ± 3.4 ms, respectively. Fig. 1a shows the CESTme MRI control images, whose intensity decayed with the echo number (i.e., TE) due to T2 relaxation. Fig. 1b shows TE-dependent signals (I0, Iref and Ilabel) of the inner pH compartment. The reference images were consistently lower than the control image due to direct RF saturation. In addition, the CEST label images were lower than the reference images, giving evidence of the pH-sensitive CEST effect. Notably, there appeared to be an oscillation pattern between even and odd Carr Purcell Meiboom Gill (CPMG) echoes, which is attributable to subtle flip angle error and phase dispersion of refocusing pulses (32–34). The decay in signal intensity with respect to echo time can be described by a mono-exponential decay function (i.e., I(TE)=I*exp(-TE/T2eff)). T2eff was 99.1, 99.1 and 99.4 ms for the control, reference, and label images, respectively, indicating negligible effects from CEST RF saturation. This also suggested that T2-relaxation-induced signal decay should not affect the magnitude of CEST effect resulting from normalization by asymmetry analysis. It is important to point out that T2eff derived from CESTme MRI was slightly longer than the T2 measured using the single spin-echo MRI sequence. This is because the CPMG sequence can more effectively suppress T2* and background gradient-induced signal loss than the conventional single spin-echo MRI (35–37).
Fig. 1.

CESTme MRI signal as a function of echo time. a) Image intensity decays with respect to TE. b) The decay of control, reference, and labels images with respect to TE can be described by T2 relaxation.
Fig. 2a shows CEST images reconstructed from each echo of the CESTme EPI independently (i.e., CESTR(i)=(Iref(i) − Ilabel(i))/I0(i)), where i is the ith echo number. The magnetic field homogeneity was −1.8±1.4 Hz within the slice, and no field correction was necessary (38). Because the control, reference, and label images decay at the same rate, CESTR showed very little change with TE (Fig. 2b). Specifically, CESTR as a function of echo time can be described by linear regression as CESTR(TE)=14.0 − 2.19*10−3xTE % and CESTR(TE)=8.19 +1.02*10−3x TE %, respectively for the pH 6.5 and 6.0 compartments (Fig. 2b). There was no significant correlation between CESTR and TE (P>0.15) for either pH compartment. However, the standard deviation of the CEST effect increased over TE due to T2–induced signal decay. Indeed, whereas the contrast between the two pH compartments was independent of TE, and expressed as ΔCESTR=5.85 −3.21*10−3*TE % (Fig. 2b), the CNR decayed with TE with an effective time constant of 92.2 ms (Fig. 2c).
Fig. 2.

Evaluation of CEST images obtained from the proposed CESTme MRI. a) CEST-weighted images reconstructed from each of the echoes. b) CEST effect shows little change with TE. c) The CNR between two pH compartments decays with TE due to T2-induced signal loss.
Fig. 3 shows CEST images obtained from the least-squares optimization of CESTme MRI (number of signal averages (NSA)=2). CESTR maps up to ith echo were averaged based on normalized T2 decay coefficient (i.e., ). The CNR for the CESTR images was 11.0, 13.9, 15.0, 15.5 and 15.4 from the first echo alone and the least-squares optimized superposition of CEST images from the first two, three, four and five echoes, respectively (Fig. 3a). It is important to note that CNR plateaued when superimposing the first five images, with CNR 41% higher than that obtained using the conventional single echo CEST-EPI. We also compared CNR of CEST images for NSA of 1, 2 and 4. We found that the CNR gain from the proposed CESTme MRI is approximately equivalent to that obtained by doubling the number of signal averages (Fig. 3a). In addition, SNR for each pH compartment was evaluated as a function of spin echo number, with sensitivity gain similar as CNR (Supplemental Materials). We compared CEST maps from the proposed CESTme EPI and the standard single echo CEST EPI (NSA=2). For the single echo CEST-EPI map, CESTR was 14.1 ± 0.5 % and 8.2 ± 0.5 % for the 6.5 and 6.0 pH compartments, respectively (Fig. 3b). In comparison, least squares optimization of the first five echoes obtained using the proposed CESTme MRI yielded CESTR of 13.9 ± 0.3 % and 8.3 ± 0.4 %, respectively (Fig. 3c). The CNR increased from 11.0 to 15.4.
Fig. 3.

Evaluation of sensitivity gain of CESTme MRI. a) CNR from CESTme MRI increased and plateaued with the number of echoes. b) CEST image reconstructed from the first echo. c) CEST image calculated from the least-squares-optimized CESTme MRI of all five echoes.
3. DISCUSSION
Our study demonstrated that for the same scan time CESTme MRI provides significantly improved sensitivity from the conventional single echo CEST-EPI sequence. This is advantageous because the sensitivity gain from the proposed sequence can be harnessed to improve the spatiotemporal resolution, particularly important for time-sensitive studies such as acute stroke MRI. Our study demonstrated CEST multi-echo EPI in vitro using a commonly used 4.7 T preclinical Bruker scanner, and future work will translate and evaluate CESTme EPI in clinic. Notably, because endogenous amide proton CEST MRI contrast is small, it is important to balance the spatial and temporal resolution, which the proposed CESTme EPI may help address. When large image matrix size is necessary, it is necessary to minimize multi-echo acquisition time in order to maximize its sensitivity. This can be somewhat addressed by using fast acquisition strategies including partial k-space sampling, segmented acquisition, spiral EPI and compressed sensing techniques, which are beyond the scope of our current work. Interestingly, because T2 is longer at lower field strength, T2-induced signal attenuation is mitigated at typical clinical field strengths, which should aid the sensitivity gain of the proposed CESTme MRI. In addition, the multi-echo EPI acquisition strategy can be implemented in a host of emerging CEST sequences, including frequency-labeled exchange (FLEX), chemical exchange rotation transfer (CERT) and saturation with frequency alternating RF irradiation (SAFARI) (39–41). Moreover, improved sensitivity should facilitate ongoing development of quantitative CEST (qCEST) analysis (42–47).
The proposed CESTme MRI forms an image from every echo independently, and multi-echo images are averaged using the least squares optimization algorithm to enhance its sensitivity. This is different from CEST MRI sequences where multiple echoes are used to fill out k-space for a single image (31,48). Because CEST effect is often calculated using the asymmetry analysis, the effect of refocusing pulse on concomitant magnetization transfer contribution to CEST measurement should be reasonably small. Indeed, Zhu et al. demonstrated similar contrast between cerebellum and cerebrum between the fast low angle shot (FLASH) sequence and gradient echo and spin echo (GRASE) sequence (48). Because our study showed that sensitivity gain of CESTme EPI plateaued after five echoes (Fig. 3), we expect the effect of a relatively small number of refocusing pulses on CEST measurement should be negligible. It is important to note that because SNR of the raw images was relatively high, and the asymmetry analysis calculated the difference between the normalized reference and label images, the Rician noise can be approximated by Gaussian noise to yield a sensitivity gain despite the use of magnitude images (49). This can be improved by taking into account the phase information. However, there may be a subtle yet non-negligible phase shift among echoes, the correction of which requires sophisticated reconstruction algorithms that are beyond the scope of this current work.
4. CONCLUSIONS
Our study demonstrated that CEST images from the proposed CESTme EPI exhibited significantly enhanced sensitivity compared to images acquired using the routine single echo CEST-EPI sequence. These findings hence indicate that CESTme MRI provides a sensitive acquisition strategy that is promising to augment applications of CEST imaging.
5. EXPERIMENTAL
PHANTOM
A CEST phantom was prepared using creatine and low gelling point agarose, as described previously (4). We prepared 1.5% agarose and copper sulfate (0.65 mM)-doped phosphate-buffered saline (PBS) solution (Sigma Aldrich, St Louis, MO). The mixture was microwave heated and immersed in a water bath set at 50°C (Cole-Parmer, Vernon Hills, IL). When the temperature of the gel solution stabilized, we added creatine to reach a concentration of 50 mM, and titrated the pH to 6.5 and 6.0 (EuTech Instrument, Singapore). We then transferred the creatine gel solution into a 2-compartment concentric phantom container; pH was 6.5 and 6.0 for the inner and outer compartments, respectively. The phantom was solidified at room temperature before MRI experiments.
MRI
Images were acquired using a 4.7 Tesla small-bore scanner (Bruker Biospec, Billerica, MA). We used single-shot single-slice EPI (slice thickness = 5 mm, field of view=50×50 mm, image matrix = 64×64, bandwidth=225 kHz). For CEST imaging we probed the creatine amine proton exchange at 6.6 ppm (1.9 ppm from bulk water resonance). Fig. 4 shows the CESTme MRI sequence, which includes a long continuous-wave RF irradiation pulse, followed by CPMG multi-echo EPI acquisition (repetition time (TR)/saturation time (TS)=10/5 s, B1=0.75 μT). We obtained five echoes with TE multiples of 24 ms. CEST experiments were repeated with the number of signal averages (NSA) varied 1, 2, and 4 times. Their scan time was 30, 60 and 120 s. In addition, T1 map was measured using an inversion recovery sequence with six different inversion times (TI) of 0.25, 0.75, 1, 2, 3 and 5 s (TR/TE=10 s/23 ms, NSA=2), and T2 map was derived from five separate spin-echo images with TE of 30, 60, 90, 120 and 150 ms (TR=10 s and NSA=2)(50). Furthermore, we obtained the field map using T2*-weighted MRI (TR= 10 s and NSA=2), with asymmetric echo time shift of 1, 3, 5 and 7 ms. Images were processed using the Matlab (Mathworks, Natick, MA), and values were reported as mean ± standard deviation (SD). We calculated the CEST effect as CEST ratio (CESTR), following standard asymmetry analysis, using the equation , where Ilabel and Iref are the label and reference images with RF irradiation applied at the labile proton frequency (Δωs) and reference frequency (−Δωs), respectively; I0 is the control image without RF irradiation. Furthermore, SNR was calculated (i.e. CESTR /σ) for each pH compartment, where σ is the CESTR standard deviation of each pH compartment (i.e. σpH=6.5 and σpH=6.0). CNR was calculated as (i.e. ), where ΔCESTR is the CESTR difference between the two pH compartments.
Fig. 4.
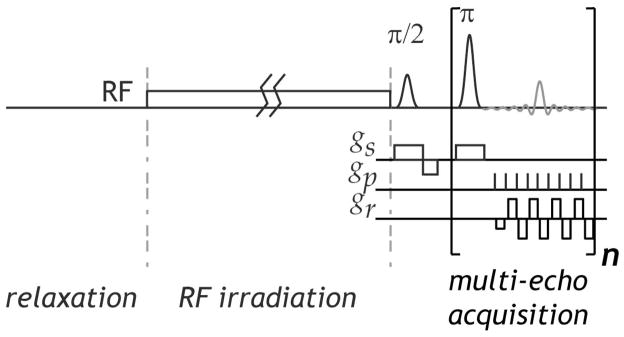
Illustration of the proposed CESTme MRI sequence, including a long RF irradiation pulse followed by CPMG multi-echo EPI.
Supplementary Material
Acknowledgments
This study was supported in part by grants from the AHA/SDG 0835384N, NIBIB-1K01EB009771, NCRR-P41RR14075 and NSFC-30900365. The authors would like to thank Drs. Bruce Rosen, Douglas Greve and Bruce Fischl for stimulating discussions and Ms. Nichole Eusemann for editorial assistance.
References
- 1.Ward KM, Balaban RS. Determination of pH using water protons and chemical exchange dependent saturation transfer (CEST) Magn Reson Med. 2000;44:799–802. doi: 10.1002/1522-2594(200011)44:5<799::aid-mrm18>3.0.co;2-s. [DOI] [PubMed] [Google Scholar]
- 2.Aime S, Delli CD, Terreno E. Highly sensitive MRI chemical exchange saturation transfer agents using liposomes. Angew Chem Int Ed Engl. 2005;44(34):5513–5515. doi: 10.1002/anie.200501473. [DOI] [PubMed] [Google Scholar]
- 3.Sherry AD, Woods M. Chemical exchange saturation transfer contrast agents for magnetic resonance imaging. Annu Rev Biomed Eng. 2008;10:391–411. doi: 10.1146/annurev.bioeng.9.060906.151929. [DOI] [PMC free article] [PubMed] [Google Scholar]
- 4.Sun PZ, Sorensen AG. Imaging pH using the chemical exchange saturation transfer (CEST) MRI: correction of concomitant RF irradiation effects to quantify CEST MRI for chemical exchange rate and pH. Magn Reson Med. 2008;60(2):390–397. doi: 10.1002/mrm.21653. [DOI] [PubMed] [Google Scholar]
- 5.van Zijl PCM, Jones CK, Ren J, Malloy CR, Sherry AD. MRI detection of glycogen in vivo by using chemical exchange saturation transfer imaging (glycoCEST) Proc Natl Acad Sci. 2007;104(11):4359–4364. doi: 10.1073/pnas.0700281104. [DOI] [PMC free article] [PubMed] [Google Scholar]
- 6.Gilad AA, McMahon MT, Walczak P, Winnard PT, Jr, Raman V, van Laarhoven HW, Skoglund CM, Bulte JW, van Zijl PC. Artificial reporter gene providing MRI contrast based on proton exchange. Nat Biotechnol. 2007;25(2):217–219. doi: 10.1038/nbt1277. [DOI] [PubMed] [Google Scholar]
- 7.Ling W, Regatte RR, Navon G, Jerschow A. Assessment of glycosaminoglycan concentration in vivo by chemical exchange-dependent saturation transfer (gagCEST) Proc Natl Acad Sci. 2008;105(7):2266–2270. doi: 10.1073/pnas.0707666105. [DOI] [PMC free article] [PubMed] [Google Scholar]
- 8.Cai K, Haris M, Singh A, Kogan F, Greenberg JH, Hariharan H, Detre JA, Reddy R. Magnetic resonance imaging of glutamate. Nat Med. 2012;18(2):302–306. doi: 10.1038/nm.2615. [DOI] [PMC free article] [PubMed] [Google Scholar]
- 9.Zhang S, Trokowski R, Sherry AD. A paramagnetic CEST agent for imaging glucose by MRI. J Am Chem Soc. 2003;125(50):15288–15289. doi: 10.1021/ja038345f. [DOI] [PubMed] [Google Scholar]
- 10.Zhou J, Payen JF, Wilson DA, Traystman RJ, van Zijl PC. Using the amide proton signals of intracellular proteins and peptides to detect pH effects in MRI. Nat Med. 2003;9(8):1085–1090. doi: 10.1038/nm907. [DOI] [PubMed] [Google Scholar]
- 11.Sun PZ, Zhou J, Sun W, Huang J, van Zijl PC. Detection of the ischemic penumbra using pH-weighted MRI. J Cereb Blood Flow Metab. 2007;27(6):1129–1136. doi: 10.1038/sj.jcbfm.9600424. [DOI] [PubMed] [Google Scholar]
- 12.Jokivarsi KT, Gröhn HI, Gröhn OH, Kauppinen RA. Proton transfer ratio, lactate, and intracellular pH in acute cerebral ischemia. Magn Reson Med. 2007;57(4):647–653. doi: 10.1002/mrm.21181. [DOI] [PubMed] [Google Scholar]
- 13.Sun PZ, Cheung JS, Wang EF, Lo EH. Association between pH-weighted endogenous amide proton chemical exchange saturation transfer MRI and tissue lactic acidosis during acute ischemic stroke. J Cereb Blood Flow Metab. 2011;31(8):1743–1750. doi: 10.1038/jcbfm.2011.23. [DOI] [PMC free article] [PubMed] [Google Scholar]
- 14.Jia G, Abaza R, Williams JD, Zynger DL, Zhou J, Shah ZK, Patel M, Sammet S, Wei L, Bahnson RR, Knopp MV. Amide proton transfer MR imaging of prostate cancer: A preliminary study. J Magn Reson Imag. 2011;33(3):647–654. doi: 10.1002/jmri.22480. [DOI] [PMC free article] [PubMed] [Google Scholar]
- 15.Zhou J, Tryggestad E, Wen Z, Lal B, Zhou T, Grossman R, Wang S, Yan K, Fu D-X, Ford E, Tyler B, Blakeley J, Laterra J, van Zijl PCM. Differentiation between glioma and radiation necrosis using molecular magnetic resonance imaging of endogenous proteins and peptides. Nat Med. 2011;17(1):130–134. doi: 10.1038/nm.2268. [DOI] [PMC free article] [PubMed] [Google Scholar]
- 16.Sun PZ, Wang EF, Cheung JS. Imaging acute ischemic tissue acidosis with pH-sensitive endogenous amide proton transfer (APT) MRI – Correction of tissue relaxation and concomitant RF irradiation effects toward mapping quantitative cerebral tissue pH. Neuroimage. 2012;60(1):1–6. doi: 10.1016/j.neuroimage.2011.11.091. [DOI] [PMC free article] [PubMed] [Google Scholar]
- 17.Jin T, Wang P, Zong X, Kim S-G. Magnetic resonance imaging of the Amine Proton EXchange (APEX) dependent contrast. NeuroImage. 2012;16(2):1218–1227. doi: 10.1016/j.neuroimage.2011.08.014. [DOI] [PMC free article] [PubMed] [Google Scholar]
- 18.Dula AN, Asche EM, Landman BA, Welch EB, Pawate S, Sriram S, Gore JC, Smith SA. Development of chemical exchange saturation transfer at 7T. Magn Reson Med. 2012;66(3):831–838. doi: 10.1002/mrm.22862. [DOI] [PMC free article] [PubMed] [Google Scholar]
- 19.Sun PZ, van Zijl PCM, Zhou J. Optimization of the irradiation power in chemical exchange dependent saturation transfer experiments. J Magn Reson. 2005;175(2):193–200. doi: 10.1016/j.jmr.2005.04.005. [DOI] [PubMed] [Google Scholar]
- 20.Sun PZ, Cheung JS, Wang E, Benner T, Sorensen AG. Fast multi-slice pH-weighted chemical exchange saturation transfer (CEST) MRI with unevenly segmented RF irradiation. Magn Reson Med. 2011;65(2):588–594. doi: 10.1002/mrm.22628. [DOI] [PMC free article] [PubMed] [Google Scholar]
- 21.Sun PZ, Benner T, Copen W, Sorensen A. Early experience of translating pH-weighted MRI to image human subjects at 3 Tesla. Stroke. 2010;41(suppl 1):S147–S151. doi: 10.1161/STROKEAHA.110.595777. [DOI] [PMC free article] [PubMed] [Google Scholar]
- 22.Mougin OE, Coxon RC, Pitiot A, Gowland PA. Magnetization transfer phenomenon in the human brain at 7 T. NeuroImage. 2010;49(1):272–281. doi: 10.1016/j.neuroimage.2009.08.022. [DOI] [PubMed] [Google Scholar]
- 23.Schmitt B, Zaiß M, Zhou J, Bachert P. Optimization of pulse train presaturation for CEST imaging in clinical scanners. Magn Reson Med. 2011;65(6):1620–1629. doi: 10.1002/mrm.22750. [DOI] [PubMed] [Google Scholar]
- 24.Zhou J, Wilson DA, Sun PZ, Klaus JA, van Zijl PCM. Quantitative description of proton exchange processes between water and endogenous and exogenous agents for WEX, CEST, and APT experiments. Magn Reson Med. 2004;51:945–952. doi: 10.1002/mrm.20048. [DOI] [PubMed] [Google Scholar]
- 25.Sun PZ, Murata Y, Lu J, Wang X, Lo EH, Sorensen AG. Relaxation-compensated fast multislice amide proton transfer (APT) imaging of acute ischemic stroke. Magn Reson Med. 2008;59(5):1175–1182. doi: 10.1002/mrm.21591. [DOI] [PubMed] [Google Scholar]
- 26.Dixon TW, Hancu I, Ratnakar SJ, Sherry DA, Lenkinski RE, Alsop DC. A multislice gradient echo pulse sequence for CEST imaging. Magn Reson Med. 2010;63(1):253–256. doi: 10.1002/mrm.22193. [DOI] [PMC free article] [PubMed] [Google Scholar]
- 27.Longo DL, Dastrù W, Digilio G, Keupp J, Langereis S, Lanzardo S, Prestigio S, Steinbach O, Terreno E, Uggeri F, Aime S. Iopamidol as a responsive MRI-chemical exchange saturation transfer contrast agent for pH mapping of kidneys: In vivo studies in mice at 7 T. Magn Reson Med. 2011;65(1):202–211. doi: 10.1002/mrm.22608. [DOI] [PubMed] [Google Scholar]
- 28.Shah T, Lu L, Dell KM, Pagel MD, Griswold MA, Flask CA. CEST-FISP: A novel technique for rapid chemical exchange saturation transfer MRI at 7 T. Magn Reson Med. 2011;65(2):432–437. doi: 10.1002/mrm.22637. [DOI] [PMC free article] [PubMed] [Google Scholar]
- 29.Desmond KL, Stanisz GJ. Understanding quantitative pulsed CEST in the presence of MT. Magn Reson Med. 2012;67(4):979–990. doi: 10.1002/mrm.23074. [DOI] [PubMed] [Google Scholar]
- 30.Jones CK, Polders D, Hua J, Zhu H, Hoogduin HJ, Zhou J, Luijten P, van Zijl PCM. In vivo three-dimensional whole-brain pulsed steady-state chemical exchange saturation transfer at 7 T. Magn Reson Med. 2012;67(6):1579–1589. doi: 10.1002/mrm.23141. [DOI] [PMC free article] [PubMed] [Google Scholar]
- 31.Liu G, Ali MM, Yoo B, Griswold MA, Tkach JA, Pagel MD. PARACEST MRI with improved temporal resolution. Magn Reson Med. 2009;61(2):399–408. doi: 10.1002/mrm.21863. [DOI] [PMC free article] [PubMed] [Google Scholar]
- 32.Majumdar S, Orphanoudakis SC, Gmitro A, O’Donnell M, Gore JC. Errors in the measurements of T2 using multiple-echo MRI techniques. I. Effects of radiofrequency pulse imperfections. Magn Reson Med. 1986;3(3):397–417. doi: 10.1002/mrm.1910030305. [DOI] [PubMed] [Google Scholar]
- 33.Crawley AP, Henkelman RM. Errors in T2 estimation using multislice multiple-echo imaging. Magn Reson Med. 1987;4(1):34–47. doi: 10.1002/mrm.1910040105. [DOI] [PubMed] [Google Scholar]
- 34.Fransson A, Ericsson A, Jung B, Sperber GO. Properties of the PHase-Alternating Phase-Shift (PHAPS) multiple spin-echo protocol in MRI: A study of the effects of imperfect RF pulses. Magn Reson Imaging. 1993;11(6):771–784. doi: 10.1016/0730-725x(93)90195-j. [DOI] [PubMed] [Google Scholar]
- 35.Carr HY, Purcell EM. Effects of Diffusion on Free Precession in Nuclear Magnetic Resonance Experiments. Phys Rev. 1954;94(3):630. [Google Scholar]
- 36.Meiboom S, Gill D. Modified spin-echo method for measuring nuclear relaxation times. Rev Scient Instr. 1958;29(8):688–691. [Google Scholar]
- 37.Sun PZ. Improved diffusion measurement in heterogeneous systems using the magic asymmetric gradient stimulated echo (MAGSTE) technique. J Magn Reson. 2007;187(2):177–183. doi: 10.1016/j.jmr.2007.04.011. [DOI] [PMC free article] [PubMed] [Google Scholar]
- 38.Sun PZ, Farrar CT, Sorensen AG. Correction for artifacts induced by B0 and B1 field inhomogeneities in pH-sensitive chemical exchange saturation transfer (CEST) imaging. Magn Reson Med. 2007;58(6):1207–1215. doi: 10.1002/mrm.21398. [DOI] [PubMed] [Google Scholar]
- 39.Friedman JI, McMahon MT, Stivers JT, Van Zijl PCM. Indirect Detection of Labile Solute Proton Spectra via the Water Signal Using Frequency-Labeled Exchange (FLEX) Transfer. J Am Chem Soc. 2010;132(6):1813–1815. doi: 10.1021/ja909001q. [DOI] [PMC free article] [PubMed] [Google Scholar]
- 40.Zu Z, Janve VA, Li K, Does MD, Gore JC, Gochberg DF. Multi-angle ratiometric approach to measure chemical exchange in amide proton transfer imaging. Magn Reson Med. 2012;68(3):711–719. doi: 10.1002/mrm.23276. [DOI] [PMC free article] [PubMed] [Google Scholar]
- 41.Scheidegger R, Vinogradov E, Alsop DC. Amide proton transfer imaging with improved robustness to magnetic field inhomogeneity and magnetization transfer asymmetry using saturation with frequency alternating RF irradiation. Magn Reson Med. 2011;66(5):1275–1285. doi: 10.1002/mrm.22912. [DOI] [PMC free article] [PubMed] [Google Scholar]
- 42.McMahon M, Gilad A, Zhou J, Sun PZ, Bulte J, van Zijl PC. Quantifying exchange rates in chemical exchange saturation transfer agents using the saturation time and saturation power dependencies of the magnetization transfer effect on the magnetic resonance imaging signal (QUEST and QUESP): Ph calibration for poly-L-lysine and a starburst dendrimer. Magn Reson Med. 2006;55(4):836–847. doi: 10.1002/mrm.20818. [DOI] [PMC free article] [PubMed] [Google Scholar]
- 43.Dixon TW, Ren J, Lubag A, JM, Ratnakar J, Vinogradov E, Hancu I, Lenkinski RE, Sherry AD. A concentration-independent method to measure exchange rates in PARACEST agents. Magn Reson Med. 2010;63(3):625–632. doi: 10.1002/mrm.22242. [DOI] [PMC free article] [PubMed] [Google Scholar]
- 44.Sun PZ. Simultaneous determination of labile proton concentration and exchange rate utilizing optimal RF power: radio frequency power (RFP) dependence of chemical exchange saturation transfer (CEST) MRI. J Magn Reson. 2010;202(2):155–161. doi: 10.1016/j.jmr.2009.10.012. [DOI] [PMC free article] [PubMed] [Google Scholar]
- 45.Zaiss M, Schmitt B, Bachert P. Quantitative separation of CEST effect from magnetization transfer and spillover effects by Lorentzian-line-fit analysis of z-spectra. J Magn Reson. 2011;211(2):149–155. [Google Scholar]
- 46.Wu R, Liu C, Liu P, Sun PZ. Improved measurement of labile proton concentration-weighted chemical exchange rate (kws) with experimental factor-compensated and T1-normalized quantitative chemical exchange saturation transfer (CEST) MRI. Contrast Media & Molecular Imaging. 2012;7(4):384–389. doi: 10.1002/cmmi.505. [DOI] [PMC free article] [PubMed] [Google Scholar]
- 47.Sun PZ, Wang Y, Xiao G, Wu R. Simultaneous experimental determination of labile proton fraction ratio and exchange rate with irradiation radio frequency power dependent quantitative CEST (qCEST) MRI. Contrast Media & Molecular Imaging. 2013 doi: 10.1002/cmmi.1524. in press. [DOI] [PMC free article] [PubMed] [Google Scholar]
- 48.Zhu H, Jones CK, van Zijl PCM, Barker PB, Zhou J. Fast 3D chemical exchange saturation transfer (CEST) imaging of the human brain. Magn Reson Med. 2010;64(3):638–644. doi: 10.1002/mrm.22546. [DOI] [PMC free article] [PubMed] [Google Scholar]
- 49.Dietrich O, Heiland S, Sartor K. Noise correction for the exact determination of apparent diffusion coefficients at low SNR. Magn Reson Med. 2001;45(3):448–453. doi: 10.1002/1522-2594(200103)45:3<448::aid-mrm1059>3.0.co;2-w. [DOI] [PubMed] [Google Scholar]
- 50.Cheung JS, Wang EF, Zhang XA, Manderville E, Lo EH, Sorensen AG, Sun PZ. Fast radio-frequency enforced steady state (FRESS) spin echo MRI for quantitative T2 mapping: minimizing the apparent repetition time (TR) dependence for fast T2 measurement. NMR Biomed. 2012;25(2):189–194. doi: 10.1002/nbm.1729. [DOI] [PMC free article] [PubMed] [Google Scholar]
Associated Data
This section collects any data citations, data availability statements, or supplementary materials included in this article.