

Abstract
Associations between adolescents' range of fundamental frequency, cortisol output, and self-reported emotional experience were examined during problem discussions with parents. Participants are a community-based sample of 56 boys and girls in a longitudinal study on conflict exposure. Results reveal that higher aggregate levels of range of fundamental frequency are associated with higher cortisol output and higher levels of self-reported negative emotions for boys and girls. Additionally, greater cortisol output is significantly associated with a slower time-to-peak of range of fundamental frequency for girls and with significantly less variability in range of fundamental frequency for boys. Implications of results for emotional development in adolescents, measurement, and modeling are discussed.
Keywords: range of fundamental frequency, cortisol, subjective emotion, adolescence, dynamic models
Emotional arousal of both parents and children during family conflict is a well-documented correlate of numerous domains of intrapersonal and interpersonal functioning. For example, higher levels of family conflict-related emotional arousal are linked to poorer psychological adjustment (e.g., Birchwood, Hallett, & Preston, 1989) and impaired social functioning (e.g., Gottman & Katz, 1989). Greater emotional arousal during family conflict is also associated with poorer physical health outcomes such as more symptoms of physical morbidity (see Kiecolt-Glaser & Newton, 2001 and Margolin & Gordis, 2000 for reviews). Finally, higher levels of emotional arousal during couple conflict are also associated with increased risk for more frequent and intense detrimental relationship behaviors such as physical aggression (e.g., Gottman et al., 1995) and the demand/withdraw interaction pattern (Baucom et al., 2011). Compared with the robust literature on parents' emotional arousal during family conflict, there has been little attention to children's emotional arousal. The lack of literature on children's emotional arousal during family interaction is even more pronounced in the study of nonverbal expression of emotional arousal. To address this gap, the current study examines associations between a vocal indicator of emotional arousal (i.e., range of fundamental frequency) and more standardly used measures of emotional arousal, namely cortisol output and self-reported negative emotions. We investigate associations between these measures of emotional arousal in adolescents during discussions with their parents about conflictual issues.
Fundamental Frequency as a Measure of Emotional Arousal Across Developmental Stages
Encoded emotional arousal is a well-accepted vocal measure of emotional arousal and is typically measured using fundamental frequency (f0; see Juslin & Scherer, 2005 for a review). F0 refers to the lowest frequency harmonic produced during the phonation phase of speech production and is highly correlated with perceived pitch. Numerous indices of f0 have been linked to the vocal expression of emotional arousal in adults and infants. Greater f0 range, higher mean f0, higher maximum f0, and greater standard deviation of f0 all indicate higher levels of emotional arousal in adults (for reviews, see Juslin & Scherer, 2005; Russell, Bachorowski, & Fernandez-Dols, 2003). Likewise, higher mean f0, higher maximum f0, and greater standard deviation of f0 of infant crying have all been linked to higher levels of infant distress (e.g., Zeskind & Marshall, 1988; Porter, Miller, & Marshall, 1986).
Though there is a strong basis of empirical support for several f0-related parameters, current methodological recommendations and recent empirical evidence suggest that f0 range is likely to be the most robust f0-related parameter of encoded arousal. Juslin and Scherer (2005) reviewed over 100 articles examining acoustic correlates of emotional expression in adults and concluded that f0 range is the cleanest f0-related index of emotional arousal. Likewise, Busso, Lee, and Narayanan (2009) recently found that f0 range conveys the largest amount of emotional information out of 43 different indices of f0 in adult speech. We therefore examine f0 range as a measure of adolescent's vocally encoded emotional arousal and do so using four different aspects of f0 range (overall range, time-to-peak range, linear trends over time and oscillatory behavior over time) to conduct as thorough an examination as possible.
Significant vocal changes that occur during adolescence also highlight the importance of exploring potential sex differences in the links between f0 range and emotional arousal. Vocal folds lengthen and thicken during puberty, resulting in decreased mean f0 for both sexes. For example, Hollien, Green, and Massey (1994) found boys' average speaking f0 to drop from over 230 Hz at age 13 to approximately 115 Hz at age 15. Additionally, greater differentiation develops between male and female voices during puberty. Prior to puberty, the average mean f0 of boys' and girls' speech is nonsignificantly different; however, after puberty, the mean f0 of males' speech is significantly lower than that of females (e.g., Perry, Ohde, & Ashmead, 2001). In contrast to the observed decreases in mean f0, f0 range appears to increase during puberty and to be more variable than either the prepubertal or post-pubertal periods (e.g., Hollien et al., 1994). We therefore also examine sex differences in vocal behavior and encoding patterns.
Examining expressive aspects of adolescents' internal emotional experiences may reveal information with implications for emotional development. As other authors have noted (e.g., Sroufe, 1997), one of the key aims of research on emotional development is to document the form and organization of emotional reactions across the life span. For example, physiological states concomitant with facial expressions of emotion are known to change across developmental stages (e.g., Tsai, Levenson, & Carstensen, 2000). It is currently unknown whether, and if so how, adolescents' vocal characteristics reflect internal emotional experiences and if these patterns of association are consistent across developmental stages. Establishing physiological and subjective correlates of adolescents' vocal expression would create a foundation for future comparison with similar associations in different developmental stages. Focusing specifically on expressive and experiential aspects of emotion in adolescence could lead to new insights into developmental trends in the vocal expression of emotional arousal (Sroufe, 1997).
Coherence Across Emotional Systems During Interpersonally Salient Interactions
The widely varying methodologies used to establish associations between f0–related parameters and emotional arousal in adulthood and infancy suggest that there are a number of possible methods that could be employed to examine f0 range during adolescence. One notable omission from existing studies of f0 and emotional arousal is the lack of evidence of direct associations between any f0–related parameter and other continuous measures of emotional arousal. Perhaps one reason for this lack of evidence is that theories of emotion differ in the extent to which they suggest that emotional expression, physiological state, and subjective experience are convergent. Most modern models of emotion, such as component process models, suggest at least some significant coordination across different facets of emotion (e.g., Scherer, 2000). Component process models suggest that the coordination of emotional subsystems arises largely from the impact of attributions for physiological arousal on emotional expression, subjective experience, and action tendencies (Grandjean, Sander, & Scherer, 2008). It is important to note that though these models suggest a general coherence across emotional subsystems, they also highlight the importance of differential levels of coordination across emotional subsystems both over time as well as between individuals (Scherer, 2009).
Existing studies of f0–related parameters and emotional arousal do not employ sufficient focus on interpersonally significant, social interactions. Some studies examine f0–related parameters during salient communications, such as during the conversations of aircraft pilots and air traffic controllers in the moments before the crash of an aircraft (Williams & Stevens, 1969). However, the relevance of those interactions arises not from the significance of the relationship between the two interactors but rather from the importance of the situation in which they are interacting. In contrast, interactions between parents and children represent both situationally and relationally significant interactions. Conflict between parents and children during adolescence is a particularly important interaction context for many of the primary developmental tasks of adolescence, such as establishing greater independence from parents. Evidence linking f0 range to physiological and subjective arousal would therefore be of particular value during interpersonally significant social interaction, such as conflictual family discussions.
Summary and Time-Varying Aspects of F0 Range During Family Discussions
A final important consideration for examining f0 range as a measure of emotional arousal during family discussions is the options for characterizing f0 range over the entirety of the discussion. Our examination of four methods for characterizing f0 range (described in Table 1) is designed to allow for comparison with existing studies of f0 range during infant and adult vocalization as well as to explore previously unexamined aspects of f0 range. Many published studies aggregate f0 range over the entirety of an interaction. Consistent with these studies, we first examine associations between a summary value of f0 range for the entire discussion and physiological and self-reported arousal.
Table 1.
Methods for Characterizing F0 Range
| Index | Construct | Calculation of index |
|---|---|---|
| Aggregate f0 range | Overall amount of vocally encoded arousal expressed during the entire discussion | The aggregate measure of f0 range was calculated by subtracting the minimum f0 value for the entire conversation from the maximum f0 value for entire conversation. |
| Time-to-peak f0 range | Latency of the maximum increase in vocally encoded arousal | Time-to-peak f0 range was calculated as the number of seconds from the beginning of the conversation to the start of the talk turn containing the highest f0 range value. |
| Linear trend in f0 range | Escalation of vocally encoded arousal over time | Separate f0 range scores were created for each talk turn and analyzed using a linear growth curve model. |
| Oscillatory behavior of f0 range | Regulation or control of vocally encoded arousal over time | The second derivative of f0 range () was created using the Local Linear Approximation method (Boker & Nesselroade, 2002). Each individual's data was first “detrended” to remove the effect of the intercept and the linear effect of time. The second derivatives for each individual's detrended data were generated using simple difference scores and analyzed using dynamic oscillator models. |
Although it is valuable to examine f0 range parameters at the aggregate level, momentary fluctuations in f0 range parameters also convey meaningful information about emotional states (e.g., Busso et al., 2009). We therefore also examine three time-varying aspects of f0 range in relation to physiological and subjective arousal. One of these aspects is the amount of time elapsed before maximum f0 range is exhibited (i.e., time-to-peak f0 range). A faster time-to-peak mean f0 during infant crying is associated with greater perceived distress of the infant (Protopapas & Eimas, 1997). While we therefore expect a faster time-to-peak f0 range to be similarly related to greater physiological and self-reported arousal for both boys and girls, it is possible that gender differences additionally exist in time-to-peak f0 range. Women's emotional responses to negative stimuli typically last longer than do men's responses (Germans Gard & Kring, 2007). If these emotional responses are encoded in f0 range, increases in girls' f0 range for each negative stimulus may last longer than increases of equal magnitude in boys' f0 range. This gender difference is significant for examining emotional processes during family conflict because most unresolved family conflict involves frequent and repeated exposure to negative stimuli. Gender differences in the duration of responses to negative emotional stimuli combined with the frequent and recurring negative stimuli typical of family conflict result in a situation where girls may not have sufficient time for a response to subside before another negative stimulus is experienced. Girls' responses may therefore pile up on one another and result in girls' peak f0 range occurring significantly later than boys' peak f0 range.
In addition to their probable associations with time-to-peak f0 range, physiological and self-reported arousal may also be related to specific contours of f0 range over time, such as linear and oscillatory trends (e.g., Busso et al., 2009). Though some studies link various contours of f0-related parameters to emotional arousal (see Juslin & Scherer, 2005 for a review), there is no current consensus in how to best model f0 contours. In order to include as much acoustic and temporal information as possible, we propose the combined use of linear and oscillatory models to capture the major sources of variability in f0 range over time. We therefore examine longitudinal variation in moment-to-moment fluctuations in f0 range using both a standard linear growth curve approach and dynamic oscillator models.
In addition to the statistical benefit they offer when combined with linear models, dynamic oscillator models are advantageous for a number of other statistical and conceptual reasons. The primary added statistical benefit of dynamic oscillator models is that emerging evidence shows that, as a general class of models, dynamic models are particularly well suited to capturing and describing variability in cyclical social behavior (Guastello, Pincus, & Gunderson, 2006). Dynamic oscillator models in particular (e.g., Boker & Nesselroade, 2002) have proven beneficial for modeling emotional processes generally (e.g., Chow et al., 2005) as well as those occurring during family interaction specifically (e.g., Guastello et al., 2006).
The conceptual benefit of dynamic oscillator models is that they are consistent with key ideas in arousal theory (Yerkes & Dodson, 1908) and current models of emotion regulation (e.g., Butler & Gross, 2009). Arousal theory suggests that there are optimal levels of arousal for individuals during engaging activities (i.e., individual set-points) and that individuals are most comfortable when they experience arousal at their optimal level. Current models of emotion regulation (i.e., Butler & Gross, 2009) similarly suggest that there is intrinsic motivation to regulate arousal so that it is as close to an optimal level as possible and that there are meaningful differences in how well individuals are able to regulate their arousal. Because the specific parameterization proposed by Boker and Nesselroade (2002) models precisely this form of variability, individual differences in rate of return to set-points can be interpreted as individual differences in regulatory processes.
Cortisol as a Measure of Physiological Arousal
Similar to the numerous options for examining temporal and summary measures of f0 range, there are also many physiological measures that could be used to assess emotional arousal during family conflict. We use cortisol output because: (a) it is widely used to assess physiological state during couple and family interaction (e.g., Ditzen et al., 2007), (b) it is an established measure of emotional arousal, and, (c) it offers a number of important advantages over other physiological measurement options. Though cortisol is most often referred to as a measure of stress response, it is also linked to negative emotional and mood states. For example, elevated cortisol levels are typically observed in individuals with depressive disorders, and higher levels of depressive symptoms are associated with higher levels of cortisol output (see Kiecolt-Glaser, McGuire, Robles, & Glaser, 2002). Cortisol also has a number of measurement properties that make it particularly advantageous for examining f0 range during family conflict. First, cortisol is one of least intrusive physiological measures that can be obtained (Gunnar & Quevedo, 2007). Cortisol levels during a family conflict can be measured by collecting saliva samples following the conflict. This process maximizes the ecological validity of the family conflict and is in sharp contrast to invasive and distracting methods necessary for collecting many other physiological measures of emotional arousal. Second, cortisol is also known to be responsive to repeated exposure to the same stressor, particularly when the stressor is experienced as uncontrollable (Baum, Cohen, & Hall, 1993). This aspect of cortisol makes it particularly appealing for assessing emotional arousal during unresolved family conflict, which is often highly repetitive and frequently occurring (Margolin, Christensen, & John, 1996). A final source of support for examining links between cortisol and f0 range comes from evidence of between person associations in mean f0 and cortisol output. Women with lower perceived power have greater cortisol output when interacting with children with higher mean f0 voices than when interacting with children with lower mean f0 voices (Lin, Bugental, Turek, Martorell, & Olster, 2002). There has yet to be an empirical examination of within person association between cortisol and f0 range.
Hypotheses
Based on the theory and research discussed above, we propose four hypotheses. First, greater aggregate f0 range will be associated with higher levels of self-reported negative emotions and with greater cortisol output. Second, faster time-to-peak f0 range will be associated with higher levels of self-reported negative emotions and with greater cortisol output. Also, girls will show slower time-to-peak f0 range than boys. Third, higher levels of self-reported negative emotions and greater post discussion cortisol output will be associated with a greater linear increase in f0 range over time. Fourth, we will explore associations among self-reported negative emotions, post discussion cortisol output, and the oscillatory behavior of f0 range over time. Directional predictions are not possible given the lack of past empirical findings.
Method
Participants
Participants (N = 56 adolescents) are a subsample of 83 youth that completed the fourth assessment in a longitudinal study of the impacts of multiple forms of violence exposure on individual development and family functioning. Primary eligibility criteria at initial recruitment included the conditions that both parents and one child lived together for at least the past three years and that the child was between 9 and 10 years of age. Of the 27 youth not included in the current study, one was excluded because study procedures were completed at home, one was excluded because of a medical condition that invalidated cortisol data, 11 were excluded because they did not provide cortisol data, three were excluded because their cortisol values were consistently out of range, and 11 were excluded because of equipment malfunction and poor recording quality. The subset of families included in the current study did not significantly differ from the entire sample on demographic variables.
Adolescents in this sample ranged from 13.83 to 18.58 years old, with a mean age for boys of 15.16 years (SD = 0.63) and a mean age for girls of 15.27 years (SD = 0.71). The racial and ethnic composition of this sample is diverse and reflective of the major metropolitan area from which adolescents and their parents were recruited; 20% of adolescents self-classified as African American, 11% Asian or Pacific Islander, 21% as Caucasian, 38% as Hispanic or Latino/a, and 11% as multiethnic. Mothers and fathers reported an average of 14.42 and 14.79 years of education, respectively. Families reported wide ranging annual household income levels (13% less than $25,000; 7% between $25,000 and $50,000; 39% between $50,000 and $100,000; 41% greater than $100,000). Parents reported cohabiting for an average of 13.7 years and having an average of 2.6 children. Forty-six percent of adolescents were female (n = 26) and 54% were male (n = 30).
Procedures
Adolescents completed a 3- to 4-hr laboratory-based assessment session with either or both of their parents. After obtaining consent from parents and assent from adolescents, all participating family members completed computerized questionnaires in separate rooms. Families then participated in videotaped, 15-min conflict discussions. To determine high-conflict areas for discussion, family members rated 35 topics (e.g., chores, privacy, etc.) for the amount of conflict and the level of distress associated with each topic. In simultaneous interviews, one of three research assistants then met with each family member to identify the most salient topics and to prime that person to present her or his position during the conflict discussion. The three research assistants then selected three topics for discussion that represented significant issues for the family. Family members were then instructed to discuss the selected topics, starting with the one rated as most conflictual. Families were further instructed to interact as they do at home and each family member was encouraged to get his or her point across.
Saliva samples were collected over the course of the assessment, and we focus on the two samples that assess cortisol output during family discussion (see Saxbe, Baucom, Spies, & Margolin, in press for additional details about cortisol procedures). Because it takes 15 to 20 minutes for cortisol levels to register in saliva (Kirschbaum & Hellhammer, 1994) and family conflict discussions were 15 minutes long, the sample collected immediately after the family discussion and the next sample collected 10 minutes later best capture physiological arousal during family discussion. Compliance with instructions to neither eat nor smoke for an hour before the visit and to not consume alcohol or caffeine for 24 hours was confirmed both through verbal questioning and a questionnaire. Families were compensated $175 for participation in this assessment that also included a battery of other questionnaires and procedures.
Measures
Encoded arousal
Encoded arousal was indexed using adolescents' f0 range during family conflict discussions. Audio recordings of family conflict discussions were manually decomposed into separate files for each family member. Acoustic features of the adolescents' files were then analyzed in 0.25 second intervals using Praat (Boersma & Weenink, 2011; see Owren & Bachorowski, 2007 for a review of methods for assessing vocal features of emotion). Obvious errors in pitch extraction were corrected using procedures outlined by Johnstone, van Reekum, Hird, Kirsner, and Scherer (2005). Plots of f0 range values were first visually inspected for signs of obvious errors in pitch extraction. Errors, which occurred for three participants, were corrected by reanalyzing the respective audio recordings and reinspecting plots of f0 range values. A single reanalysis was sufficient for correcting all errors. Time varying indices of f0 range were analyzed using f0 range values for each talk turn, a commonly used conversational unit in which one person is the speaker. F0 range was calculated for each talk turn by first subtracting the minimum f0 value for the entire discussion from the maximum f0 value for each 0.25 second interval and then averaging those resultant values over each talk turn. Calculation of the aggregate index of f0 range and each time varying index of f0 range is described in Table 1.
Salivary cortisol
Cortisol output was indexed using two samples—one collected immediately after the end of the family conflict discussion and the second collected 10 minutes later—and calculated by finding the area under the curve between the two points with respect to ground (Pruessner, Kirschbaum, Meinlschmid, & Hellhammer, 2003). We chose to use this aggregate measure of cortisol output during the family conflict because it is most analogous to f0 range; both indices reflect overall levels of arousal as well as individual differences in overall levels of arousal. Saliva samples were analyzed by Salimetrics, LLC, who provide an enzyme immunoassay with a lower limit of sensitivity of 0.003 μg/dl, and intraassay and interassay coefficients of variation of 3.5% and 5.1%, respectively. Each saliva sample was assayed twice, and analyses were repeated if any pair of results differed by > 7%. Cortisol values were strongly skewed so a log transformation was applied prior to analysis (Singer & Willett, 2003). In light of the diurnal pattern of cortisol, all analyses of cortisol data controlled for time of day (Smyth et al., 1997).
Self-reported negative emotions
Adolescents reported on the emotions they experienced during the family conflict by completing the 14-item Post-Discussion Questionnaire (PDQ; Spies, Margolin, Susman, & Gordis, 2011) immediately after the family conflict discussion. Eight of these items (angry, frustrated, anxious, irritated, embarrassed, ignored, upset, and afraid) were summed to create a negative emotion score (Cronbach's alpha = .85). Negative emotion scores were strongly skewed so a log transformation was applied prior to analysis (Singer & Willett, 2003).
Age
Age was measured in months using parent-reported birthdate.
Puberty
Pubertal status was assessed using parent report on three items that assess the degree of growth spurts, skin changes, and body hair growth on a 4-point scale (Saxbe & Repetti, 2009). Higher scores reflect more advanced pubertal status, and the sample mean of 6.42 (SD = 1.45) indicates that adolescents were midway through puberty on average.
Data Reduction and Analysis
All hypotheses were tested using multiple regression. Hypotheses 1 and 2 were tested using regressions run in Stata, Release 11 (StataCorp, 2009); hypotheses 3 and 4 were tested using multilevel models run in Hierarchical Linear Modeling, Version 7 (Raudenbush, Bryk, & Congdon, 2010). All predictors were grand mean centered prior to analysis and creation of interaction terms. Separate models were run using age and pubertal status to control for adolescent's physical development; results from the two sets of models are identical in terms of the direction and significance of predictors of interest. Results for models using age are presented in this article; results for models using pubertal status are available from the first author. Time of day was included as an additional covariate in models involving cortisol. Separate models were run for cortisol and for self-reported negative emotions for all hypotheses.
Results
Table 2 presents means and standard deviations of as well as correlations between all variables. As expected, f0 range was significantly correlated with total cortisol output for boys, r(30) = 0.45, p = .012; a correlation of similar magnitude, yet nonsignificant, emerged for girls, r(26) = 0.38, p = .055. Similarly, f0 range was significantly correlated with self-reported negative emotions for girls, r(26) = 0.40, p = .043; a correlation of similar magnitude, yet nonsignificant, emerged for boys, r(30) = 0.32, p = .082. Also as expected, time-to-peak f0 range was significantly correlated with total cortisol output for girls, r(26) = 0.49, p = .010. F0 range was significantly correlated with boy's pubertal status, r(30) = 0.50, p = .007. Finally, total cortisol output was significantly correlated with girl's age, r(26) = −0.42, p = .034. No other correlations emerged as significant.
Table 2.
Descriptive Statistics for Aggregate F0 Range, Time-to-Peak F0 Range, Negative Emotion, Cortisol, and Covariates
| Correlations |
||||||||
|---|---|---|---|---|---|---|---|---|
| F0 range | Time-to-peak f0 rangesec | Negative emotionln | Total cortisol outputln | Age | Pubertal status | Mean | SD | |
| F0 range | — | .26 | .40* | .38† | −.17 | .02 | 155.35 | 15.44 |
| Time-to-peak f0 rangesec | .09 | — | .01 | .49* | .05 | −.07 | 474.16 | 241.49 |
| Negative emotionln | .32† | .13 | — | .06 | .08 | .02 | 1.83 | 1.00 |
| Total cortisol outputln | .45* | −.17 | .31† | — | −.42* | −.21 | 3.74 | 0.42 |
| Age | −.27 | .00 | .05 | −.20 | — | .11 | 15.27 | 0.84 |
| Pubertal status | .50** | .20 | .32† | .05 | .10 | — | 7.04 | 1.49 |
| Mean | 90.23 | 504.15 | 1.77 | 3.83 | 15.16 | 5.89 | ||
| SD | 10.18 | 247.81 | 0.99 | 0.92 | 0.63 | 1.20 | ||
Note. Descriptive statistics are presented for log transformed self-reported negative emotion and cortisol variables and for females above the diagonal/males below the diagonal.
p < .10.
p < .05.
p < .01.
We examined Lowess smoothed plots of f0 range for participants in the current study to see if they appeared to have linear and oscillatory characteristics. Figure 1 displays these plots for one boy and one girl from the current study. F0 range appears to have both linear and oscillatory components and to differ between individuals as well as over the course of the discussions. Standard linear growth models and dynamic oscillator models therefore appear to be reasonable methods for characterizing pitch contours in this sample.
Figure 1.

Lowess smoothed plots of f0 range over time.
Associations Among Aggregate F0 Range, Time-to-Peak F0 Range, Self-Reported Emotion, and Cortisol
Table 3 presents results of regressions used to test hypothesis 1 where aggregate f0 range was regressed onto each predictor, sex, the sex by predictor interaction, and covariates. As depicted in Figure 2, greater aggregate f0 range was significantly associated with higher levels of self-reported negative emotions, β = 0.14, p = .007, and with greater cortisol output, β = 0.20, p = .009. The main effect of sex was also significant in both models, β = 0.93, p < .001, indicating that girls' f0 range was significantly higher than boys'.
Table 3.
Regression Analyses of Aggregate F0 Range and Time-to-Peak F0 Range With Self-Reported Negative Emotions and Total Cortisol Output
| Aggregate f0 range |
Time-to-peak f0 range |
|||||||||||
|---|---|---|---|---|---|---|---|---|---|---|---|---|
| Self-reported negative emotions |
Total cortisol output |
Self-reported negative emotions |
Total cortisol output |
|||||||||
| Variable | B | SE B | β | B | SE B | β | B | SE B | β | B | SE B | β |
| Intercept | 122.97 | 1.64 | — | 123.24 | 1.67 | — | 489.57 | 33.63 | — | 498.02 | 31.74 | — |
| Sex | 64.78*** | 3.31 | 0.93 | 65.81*** | 3.35 | 0.94 | −31.74 | 67.43 | −0.07 | −19.64 | 63.60 | −0.04 |
| Predictor | 4.77** | 1.69 | 0.13 | 9.69** | 3.54 | 0.20 | 15.93 | 34.44 | 0.06 | 144.24* | 67.23 | 0.43 |
| Sex × predictor | 3.31 | 3.37 | 0.05 | 7.74 | 6.65 | 0.08 | −30.33 | 68.76 | −0.06 | 360.34** | 126.37 | 0.54 |
| Age | −3.92 | 2.29 | −0.08 | −1.12 | 2.46 | −0.02 | 7.58 | 46.70 | 0.02 | 45.33 | 46.82 | 0.14 |
| Time of day | — | — | — | 0.65 | 0.88 | 0.04 | — | — | — | 2.96 | 16.81 | 0.03 |
p < .05.
p < .01.
p < .001.
Figure 2.

Plots of summary associations between f0 range, cortisol, and self-reported negative emotions.
Table 3 also presents results of regressions used to test hypothesis 2 where time-to-peak f0 range was regressed onto each predictor, sex, the sex by predictor interaction and covariates. A significant main effect emerged for cortisol on time-to-peak, β = 0.43, p = .037. However, this main effect was qualified by a significant cortisol by sex interaction, β = 0.54, p = .006. Computing simple slopes for this interaction indicates that greater cortisol is associated with later time-to-peak for girls only, B = 324.41, p = .009, and that no significant association exists between cortisol and time-to-peak for boys, B = 35.93, p = .49. None of the predictors were significant in the model predicting time-to-peak from self-reported negative emotions.
Linear Trend in F0 Range Over Time
Table 4 presents results of multilevel models used to test hypothesis 3 where f0 range was regressed onto the main effects and interactions for time, sex, emotional arousal, and covariates. The equations below describe these models:
-
Level-1:
-
Level-2:
Table 4.
Regression Table for Linear Model of F0 Range Over Time
| Self-reported negative emotions |
Total cortisol output |
|||||
|---|---|---|---|---|---|---|
| Variable | B | SE B | β | B | SE B | β |
| Intercept, β00 | 63.01 | 88.42 | — | 18.11 | 101.07 | — |
| Predictor, β01 | 7.89 | 4.58 | 0.12 | 9.05 | 8.48 | 0.07 |
| Sex, β02 | 68.39*** | 9.18 | 0.57 | 69.32*** | 9.16 | 0.82 |
| Predictor × sex, β03 | 2.08 | 9.20 | 0.02 | −3.02 | 17.03 | −0.02 |
| Age, β04 | 3.23 | 5.83 | 0.04 | 6.06 | 6.29 | 0.07 |
| Time of day, β04 | — | — | — | 0.11 | 2.34 | 0.00 |
| Time, β10 | 0.14 | 0.09 | 0.57 | 0.05 | 0.11 | 0.20 |
| Predictor, β11 | 0.01 | 0.00 | 0.08 | 0.02* | 0.01 | 0.09 |
| Sex, β12 | −0.01 | 0.01 | −0.04 | 0.00 | 0.01 | 0.00 |
| Predictor × sex, β13 | 0.00 | 0.01 | 0.00 | 0.03 | 0.02 | 0.10 |
| Age, β14 | −0.01 | 0.01 | −0.56 | 0.00 | 0.01 | 0.00 |
| Time of day, β14 | — | — | — | 0.00 | 0.00 | 0.00 |
Note. Robust standard errors are reported.
p < .05.
p < .001.
A significant main effect for sex emerged on the intercept in both models (β = 0.57, p = .001). This effect indicates that girls' f0 range was greater than boys' f0 at the beginning of the discussions. Figure 3 depicts the significant cross-level interaction between cortisol and time (β = 0.82, p = .040 for cortisol). A similar trend emerged for self-reported negative emotions (β = 0.12, p = .070). These effects are in the hypothesized directions (i.e., higher cortisol or more self-reported negative emotions, greater increase in f0 range over time). No other main effects or interactions emerged as significant.
Figure 3.
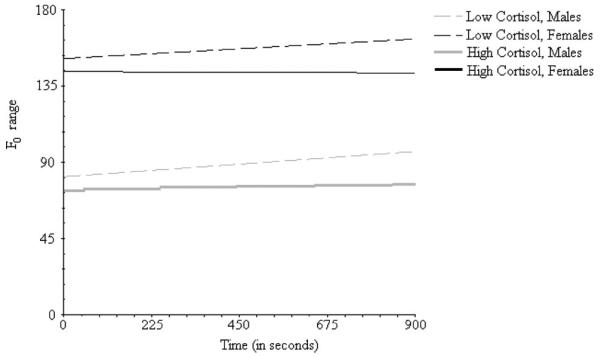
Plots of linear effects of time on f0 range for males and females in the top and bottom quartiles of cortisol output.
Oscillatory Behavior of f0 Range Over Time
Table 5 displays results of dynamic oscillator models used to test hypothesis 4, and the equations below describes these models:
-
Level-1:
-
Level-2:
Table 5.
Regression Table for Dynamic Oscillator Models of F0 Range
| Self-reported negative emotions |
Total cortisol output |
|||||
|---|---|---|---|---|---|---|
| Variable | B | SE B | β | B | SE B | β |
| Current level of f0 (η), c00 | −0.02*** | 0.00 | −0.12 | −0.02*** | 0.00 | −0.12 |
| Predictor, c01 | 0.00 | 0.00 | 0.00 | 0.00 | 0.00 | 0.00 |
| Sex, c02 | −0.01 | 0.00 | −0.02 | −0.01 | 0.00 | −0.02 |
| Predictor × sex, c03 | 0.00 | 0.00 | 0.00 | 0.02* | 0.01 | 0.04 |
| Age, c04 | 0.00 | 0.00 | 0.00 | 0.00 | 0.00 | 0.00 |
| Time of day, c05 | — | — | — | −0.00 | 0.00 | 0.00 |
| Slope of f0 (ξ), c10 | −1.14*** | 0.01 | −0.92 | −1.14*** | 0.01 | −0.92 |
| Predictor, c11 | 0.00 | 0.02 | 0.00 | −0.03 | 0.02 | −0.02 |
| Sex, c12 | 0.05* | 0.03 | 0.02 | 0.05* | 0.02 | 0.02 |
| Predictor × sex, c13 | 0.00 | 0.03 | 0.00 | −0.08 | 0.05 | −0.02 |
| Age, c14 | 0.02 | 0.01 | 0.25 | 0.00 | 0.01 | 0.02 |
| Time of day, c15 | — | — | — | 0.01 | 0.01 | 0.00 |
Note. Robust standard errors are reported.
p < .05.
p < .01.
p < .001.
At level-1, the second derivative of f0 range (), which represents change in the slope of f0 range (or the acceleration of f0 range), is predicted by current level of f0 range, xij, and the slope of f0 range, . Random effects, u0i and u1i, are included at Level-2 to allow for between youth differences in associations.
A baseline version of this model including only intercepts and random effects at level-2 was run prior to addition of any predictors to allow examination of the basic oscillatory contours of f0 over time. Significant η (β = −0.12, p < .001) and ξ (β = −0.92, p < .001) parameters emerged in this model. The significant η parameter indicates that arousal varies in a regulated fashion with the greatest values of occurring when xij is largest. The significant ξ parameter must be combined with η to be interpreted. Because they are of the same sign, this parameter indicates that youth's f0 range returns more rapidly to a set-point later in the discussion. The random effects for both η and ξ emerged as significant (χ2(55) = 239.16, p < .001 for u00; χ2(55) = 142.56, p < .001 for u10), indicating significant remaining between-youth variability.
When main effects, interactions, and covariates were added to this model, a significant cortisol by sex interaction emerged on η (β = 0.04, p = .05). Computing simple slopes for this interaction indicated that greater cortisol is associated with a more rapid return to set-point of f0 range for boys only (B = −0.01, p = .02). No significant association exists between cortisol and return to set-point of f0 range for girls (B = 0.01, p = .19). A significant sex effect on ξ also emerged in both models (β = 0.02, p = .05). Computing simple slopes for this interaction indicated that though both boys' and girls' f0 range varied less about their set-points later in the discussions, the effect is larger for boys (B = −1.17, p < .001) than for girls (B = −1.12, p < .001). Combining the significant sex by cortisol effect on η with the sex effect on ξ indicates that boys' f0 range varies less about their set-points than does girls' and that when boys' f0 range does vary from their set-point, it returns to it faster when boys have a greater cortisol output.
Discussion
This study examined associations between adolescents' f0 range, cortisol output, and self-reported negative emotions during the interpersonally and situationally significant context of family conflict discussions. When examining aggregate measures of arousal, results linked higher levels of f0 range to higher levels of cortisol output and self-reported subjective negative emotions for boys and girls. When examining time-varying measures of arousal, results found higher levels of cortisol output to be related to steeper linear increases in f0 range over time for boys and girls (with a similar trend emerging for self-reported negative emotions); additionally, higher cortisol output was linked to a slower time-to-peak f0 range for girls. Finally, exploratory analyses revealed that boys' f0 range oscillates to a significantly lesser degree than girls' and that this effect is magnified when boys have higher cortisol output. This collection of results provides empirical support for the use of f0 range as a measure of adolescents' emotional arousal. It also adds to evidence describing how internally experienced arousal is expressed in multiple aspects of adolescents' emotional expression and highlights sex differences in temporal dimensions of vocal behavior.
Range of Fundamental Frequency as a Measure of Adolescents' Emotional Arousal During Interpersonally Significant Interaction
The results of this study help to clarify how emotional arousal is encoded in several aspects of adolescents' f0 range. At the most coarse level of granularity, greater f0 range is associated with greater cortisol output and higher levels of subjective negative arousal; at a finer level of analysis, greater cortisol output is associated with increased f0 range over time. In contrast, short-term oscillations in f0 range generally were not associated with either cortisol output or subjectively experienced arousal. Taken together, these results indicate that f0 range, whether measured in the aggregate or over time, can be interpreted as an index of encoded emotional arousal whereas moment-to-moment variation in f0 range is not strongly tied to adolescents' emotional arousal.
There are several possible explanations for why short-term fluctuations in f0 range were not associated with cortisol output and subjectively experienced arousal. One possibility is that variations in f0 range may convey additional information beyond the speaker's emotional arousal. For example, mean f0 generally rises at the end of a question and it is possible that variations in f0 range are also used to convey syntax. A second possibility is that adolescents' f0 range may be affected by their parents' vocal behavior. Numerous studies (e.g., Gregory & Hoyt, 1982; Gregory, Webster, & Huang, 1993) find significant convergence in interactants' vocal characteristics (including mean f0) and for the level of convergence in mean f0 to be an index of the perceived quality of the interaction (Gregory et al., 1993). It is therefore likely that adolescents' f0 range is related to their parents' f0 range and that the strength of that effect varies across families based on the quality of their interactions. A final possibility is that variability in f0 range about the mean is influenced by other aspects of emotion, such as emotion regulation (e.g., Butler & Gross, 2009). Indirect support for this final possibility can be derived from the sex differences that emerged in the temporal characteristics of f0 range.
Sex Differences in Temporal Characteristics of Range of Fundamental Frequency
Sex differences in the temporal characteristics of f0 range were generally consistent with hypotheses and have implications for emotional functioning. The slower return to set-point for girls relative to boys is consistent with Germans Gard and Kring's (2007) finding that women's emotional response to negative stimuli typically lasts longer than does men's response. Part of the reason why girls' peak f0 range occurred later than boys' may be because girls' emotional responses were more sustained than boys, as evidenced by girls' slower return to set-point relative to boys. Girls' slower return to set-point may have resulted in a form of emotional escalation where girls' subsequent responses occurred before earlier responses subsided.
Boys displayed significantly less variability in f0 range than did girls and this difference was magnified when boys' cortisol output was high. Specifically, when boys' cortisol output was high they returned to baseline levels of f0 range more quickly than did girls. This finding may be similar to men's tendency to display less variability in facial affect when they are more physiologically aroused during marital conflict (Gottman, Levenson, & Woodin, 2001). Boys' tendency to display less variability in vocal affect when they have greater cortisol output may reflect a form of suppression or emotional dampening. In adults, suppression of overall nonverbal affect has been linked to heightened physiological arousal (e.g., Gross & Levenson, 1993; Butler et al., 2003). Though the current study did not include a measure of suppression, boys are more likely to try to control emotional expression during communication than are adolescent girls (e.g., Brody, 1999) and adolescent boys display less emotion in family interactions than do adolescent girls (Brody, 1996). Additionally, youth report using suppression significantly more often than other forms of emotional regulation and report using suppression at significantly higher levels than do adults (John & Gross, 2004). F0 range is open to a degree of conscious control; yet, whether boys' restricted variability of f0 range is an indication of suppression awaits future investigation.
Temporal Characteristics of Range of Fundamental Frequency Shared by Boys and Girls
In addition to uncovering sex differences in the temporal characteristics of f0 range, results also revealed that linear increases in f0 range are similarly related to cortisol output for boys and girls. More specifically, steeper increases in f0 range are associated with greater cortisol output during the conflict discussion. To the best of our knowledge, this evidence is the first demonstration that any form of temporal variability in f0 range is indicative of physiological arousal during interpersonal interaction.
In considering this finding, it is important to take the different time course and sampling rates of f0 range and cortisol into account. F0 range changes on a second by second basis whereas changes in cortisol output typically take 15 to 20 minutes to register in saliva. Likewise, f0 range was sampled at a much higher resolution (second by second) than was cortisol (twice over a 10-minute period). These aspects of the two measures and of the study methodology have implications for understanding the results of the current study. The results of the current study indicate that linear trends in f0 range over a conflictual family discussion are associated with cortisol output measured across the same period of time. This finding can be interpreted as showing that total cortisol output is reflected in the slope of f0 range over time. It is important to note that this finding cannot be interpreted to indicate that cortisol and f0 range are associated at any specific point in time. Rather, it shows that overall trends in cortisol output and overall linear trends in f0 range are associated.
It is also important to note that these sex consistent findings in temporal course occurred within the context of significant sex differences in f0 range observed throughout the family discussion. Girls' f0 range was significantly higher than boys' f0 range at the beginning of the discussion, and this sex difference persisted throughout the remainder of the interaction. This sex difference may be an artifact of increased differentiation in male and female voices during puberty. Alternatively, it may also be an indication that adolescents were aroused when they began the family discussions. It is well documented that sex differences in vocal characteristics, such as f0 range, are amplified in emotionally arousing contexts (e.g., Juslin & Scherer, 2005). It is possible that adolescents already were anticipating the conversation would go poorly and were aroused as a consequence. However, this sex difference at the start of the family discussion does not appear to reflect a differential association with physiological arousal. Additionally, there does not appear to be a sex differences in the association between the rate of change of f0 range and cortisol output during the corresponding time period. Figure 3 depicts these sex differences in the intercept and linear trends in f0 range across time for boys and girls in the top and bottom quartiles of cortisol output. This pattern of findings further highlights the robustness of the association between general trends in f0 range and overall cortisol output, as well as the importance for controlling for sex differences in mean levels when examining longitudinal variation in f0 range.
Limitations
There are several limitations to bear in mind when considering the results of the current study. First, one measure of physiological arousal, cortisol, was examined. Patterns of physiological response to interpersonal stressors are complex and variable both between individuals as well as between physiological systems within individuals (Cacioppo, Tassinary, & Berntson, 2007). Although it is possible to conclude that physiological arousal measured by cortisol response is encoded in f0 range, replication of these findings using other physiological measures (e.g., heart rate or electrodermal activity) is warranted. Second, the summary nature of the cortisol output and self-reported negative emotions measures may have impacted study findings. Part of the reason that stronger evidence emerged for encoding of cortisol output and self-reported negative emotions at the aggregate level of f0 range may be that all three measures were summary measures. It is possible that different patterns would emerge if more variable measures of physiological arousal and self-reported negative emotions were examined. Third, only one measure of vocally encoded arousal, f0 range, was examined. Other vocal parameters related to fundamental frequency (e.g., mean f0 and standard deviation of f0) as well as related to other parts of the speech signal (e.g., intensity and speech rate) have been found to convey emotional information. Examination of a wider range of vocal parameters would allow for a more detailed analysis of multiple ways that cortisol and self-reported negative emotions are encoded in the voice. Finally, parents' vocal behavior was not considered. Though it is likely that parents' f0 range is related to children's f0 range, there is little reason to think that parents' f0 range alters associations between children's f0 range, cortisol output, and self-reported negative emotions.
Summary and Future Directions
The current study finds strong evidence that cortisol output (and to a lesser extent self-reported negative emotions) is encoded in adolescent's f0 range and highlights the value of examining both summary and time-varying indices of vocal behavior. The current study also identifies several avenues for future exploration of emotion and family processes. Given the lack of empirical investigation of vocal behavior relative to other forms of emotional expression (such as facial expressions), exploration of associations between f0 range and arousal in other physiological systems would be valuable. It would also be valuable to explore other predictors that may account for remaining variability in adolescent's f0 range. In addition to proximal variables, such as parents' vocal behavior, there are a number of distal family characteristics known to impact important emotional processes in children such as domestic aggression (Gordis, Margolin, & John, 1997) and metaemotion (Gottman, Katz, & Hooven, 1997) that may also relate to adolescent's vocal behavior. F0 range therefore appears not only to offer a valid and nonintrusive measure for emotional arousal during social interaction but also a sensitive measure for better understanding important emotional processes in families.
Acknowledgments
This research was funded by NIH-NICHD F32HD604102 (PI: Brian R. Baucom), NIH-NICHD Grant R01 HD046807 (PI: Gayla Margolin), NIH-NICHD F32HD063255 (PI: Darby E. Saxbe), NIH-NIMH F31MH087029 (PI: Lauren A. Spies), and NIH-NICHD F31HD069147 (PI: Esti Iturralde). The content is solely the responsibility of the authors and does not necessarily represent the official views of the National Institute of Child Health and Human Development, the National Institute of Mental Health, or the National Institutes of Health. We are grateful to the families who generously participated in this study and to our collaborators on the Family Studies Project, particularly Pamella Oliver, PhD, and Elana Gordis, PhD.
References
- Baucom BR, Atkins D, Eldridge K, McFarland P, Sevier M, Christensen A. The language of demand/withdraw: Verbal and vocal expressions in dyadic interaction. Journal of Family Psychology. 2011;25:570–580. doi: 10.1037/a0024064. doi:10.1037/a0024064. [DOI] [PMC free article] [PubMed] [Google Scholar]
- Baum A, Cohen L, Hall M. Control and intrusive memories as possible determinants of chronic stress. Psychosomatic Medicine. 1993;55:274–286. doi: 10.1097/00006842-199305000-00005. [DOI] [PubMed] [Google Scholar]
- Birchwood MJ, Hallett SE, Preston MC. Schizophrenia: An integrated approach to research and treatment. New York University Press; New York, NY: 1989. pp. 183–199. [Google Scholar]
- Boersma P, Weenink D. Praat: Doing phonetics by computer. (Version 5.2.33) 2011 [Computer program]. Retrieved July 29, 2011 from http://www.praat.org/
- Boker SM, Nesselroade JR. A method for modeling the intrinsic dynamics of intraindividual variability: Recovering the parameters of simulated oscillators in multi–wave panel data. Multivariate Behavioral Research. 2002;37:127–160. doi: 10.1207/S15327906MBR3701_06. doi:10.1207/S15327906MBR3701_06. [DOI] [PubMed] [Google Scholar]
- Brody L. Gender, emotional expression, and parent-child boundaries. In: Kavanaug RD, Zimmerberg B, Fein S, editors. Emotion: Interdisciplinary perspectives. Erlbaum, Inc.; Mahwah, NJ: 1996. pp. 139–170. [Google Scholar]
- Brody L. Gender, emotion, and the family. Harvard University Press; Cambridge, MA: 1999. [Google Scholar]
- Busso C, Lee S, Narayanan S. Analysis of emotionally salient aspects of fundamental frequency for emotion detection. IEEE Transactions on Audio, Speech, and Language Processing. 2009;17:582–596. doi:10.1109/TASL.2008.2009578. [Google Scholar]
- Butler EA, Egloff B, Wilhelm FH, Smith NC, Erickson EA, Gross JJ. The social consequences of expression suppression. Emotion. 2003;3:48–67. doi: 10.1037/1528-3542.3.1.48. doi:10.1037/1528-3542.3.1.48. [DOI] [PubMed] [Google Scholar]
- Butler EA, Gross JJ. Emotion and emotion regulation: Integrating individual and social levels of analysis. Emotion Review. 2009;1:86–87. doi:10.1177/1754073908099131. [Google Scholar]
- Cacioppo JT, Tassinary LG, Berntson GG. Handbook of psychophysiology. 3rd ed Cambridge University Press; New York, NY: 2007. [Google Scholar]
- Chow SM, Ram N, Boker SM, Fujita F, Clore GC. Emotion as a thermostat: Representing emotion regulation using a damped oscillator model. Emotion. 2005;5:208–225. doi: 10.1037/1528-3542.5.2.208. doi:10.1037/1528-3542.5.2.208. [DOI] [PubMed] [Google Scholar]
- Ditzen B, Neumann ID, Bodenmann G, von Dawans B, Turner RA, Ehlert U, Heinrichs M. Effects of different kinds of couple interaction on cortisol and hear rate responses to stress in women. Psychoneuroendocrinology. 2007;32:565–574. doi: 10.1016/j.psyneuen.2007.03.011. doi:10.1016/j.psyneuen.2007.03.011. [DOI] [PubMed] [Google Scholar]
- Germans Gard MK, Kring AM. Sex differences in the time course of emotion. Emotion. 2007;7:429–437. doi: 10.1037/1528-3542.7.2.429. doi:10.1037/1528-3542.7.2.429. [DOI] [PubMed] [Google Scholar]
- Gordis EB, Margolin G, John RS. Marital aggression, observed parental hostility, and child behavior during triadic family interaction. Journal of Family Psychology. 1997;11:76–89. doi:10.1037/0893-3200.11.1.76. [Google Scholar]
- Gottman JM, Jacobson NS, Rushe R, Shortt JW, Babcock J, LaTaillade JJ, Waltz J. The relationship between heart rate reactivity, emotionally aggressive behavior, and general violence in batterers. Journal of Family Psychology. 1995;9:227–248. doi:10.1037/0893-3200.9.3.227. [Google Scholar]
- Gottman JM, Katz LF. Effects of marital discord on young children's peer interaction and health. Developmental Psychology. 1989;25:373–381. doi:10.1037/0012-1649.25.3.373. [Google Scholar]
- Gottman JM, Katz LF, Hooven C. Meta-emotion: How families communicate emotionally. Lawrence Erlbaum Associates, Inc.; Mahwah, NJ: 1997. [Google Scholar]
- Gottman JM, Levenson R, Woodin E. Facial expression during marital conflict. Journal of Family Communication. 2001;1:37–57. doi:10.1207/S15327698JFC0101_06. [Google Scholar]
- Grandjean D, Sander D, Scherer K. Conscious emotional experience emerges as a function of multilevel, appraisal-drive response synchronization. Consciousness and Cognition. 2008;17:484–495. doi: 10.1016/j.concog.2008.03.019. doi: 10.1016/j.concog.2008.03.019. [DOI] [PubMed] [Google Scholar]
- Gregory SW, Hoyt BR. Conversation partner mutual adaptation as demonstrated by fourier series analysis. Journal of Psycholinguistic Research. 1982;11:35–46. doi:10.1007/BF01067500. [Google Scholar]
- Gregory SW, Webster S, Huang G. Voice pitch and amplitude convergence as a metric of quality in dyadic interviews. Language & Communication. 1993;13:195–217. doi:10.1016/0271-5309(93)90026-J. [Google Scholar]
- Gross JJ, Levenson RW. Emotional suppression: Physiological, self-report, and expressive behavior. Journal of Personality and Social Psychology. 1993;64:970–986. doi: 10.1037//0022-3514.64.6.970. doi:10.1037/0022-3514.64.6.970. [DOI] [PubMed] [Google Scholar]
- Guastello SJ, Pincus D, Gunderson PR. Electrodermal arousal between participants in a conversation: Nonlinear dynamics for linkage effects. Nonlinear Dynamics, Psychology, and Life Sciences. 2006;10:365–399. [PubMed] [Google Scholar]
- Gunnar M, Quevedo K. Neurobiological of stress and development. Annual Review of Psychology. 2007;58:145–173. doi: 10.1146/annurev.psych.58.110405.085605. doi:10.1146/annurev.psych.58.110405.085605. [DOI] [PubMed] [Google Scholar]
- Hollien H, Green R, Massey K. Longitudinal research on adolescent voice changes in males. Journal of the Acoustic Society of America. 1994;96:2646–2654. doi: 10.1121/1.411275. doi:10.1121/1.411275. [DOI] [PubMed] [Google Scholar]
- John OP, Gross JJ. Healthy and unhealthy emotion regulation: Personality processes, individual differences, and life span development. Journal of Personality. 2004;72:1301–1334. doi: 10.1111/j.1467-6494.2004.00298.x. doi:10.1111/j.1467-6494.2004.00298.x. [DOI] [PubMed] [Google Scholar]
- Johnstone T, van Reekum CM, Hird K, Kirsner K, Scherer KR. Affective speech elicited with a computer game. Emotion. 2005;5:513–518. doi: 10.1037/1528-3542.5.4.513. doi:10.1037/1528-3542.5.4.513. [DOI] [PubMed] [Google Scholar]
- Juslin P, Sherer K. Vocal expression of affect. In: Harrigan JA, Rosenthal R, Scherer KR, editors. The new handbook of methods in nonverbal behavioral research. Oxford University Press; New York, NY: 2005. pp. 65–136. [Google Scholar]
- Kiecolt-Glaser JK, McGuire L, Robles TF, Glaser R. Emotions, morbidity, and mortality: New perspectives from psychoneuroimmunology. Annual Review of Psychology. 2002;53:83–107. doi: 10.1146/annurev.psych.53.100901.135217. doi:10.1146/annurev.psych.53.100901.135217. [DOI] [PubMed] [Google Scholar]
- Kiecolt-Glaser JK, Newton TL. Marriage and health: His and hers. Psychological Bulletin. 2001;127:472–503. doi: 10.1037/0033-2909.127.4.472. doi:10.1037/0033-2909.127.4.472. [DOI] [PubMed] [Google Scholar]
- Kirschbaum C, Hellhammer DH. Salivary cortisol in psychoneuroendocrine research: Recent developments and applications. Psychoneuroendocrinology. 1994;19:313–333. doi: 10.1016/0306-4530(94)90013-2. doi:10.1016/0306-4530(94)90013-2. [DOI] [PubMed] [Google Scholar]
- Lin E, Bugental DB, Turek V, Martorell GA, Olster DH. Children's vocal properties as mobilizers of stress-related physiological responses in adults. Personality and Social Psychology Bulletin. 2002;28:346–357. doi:10.1177/0146167202286006. [Google Scholar]
- Margolin G, Christensen A, John RS. The continuance and spillover of everyday tensions in distressed and nondistressed families. Journal of Family Psychology. 1996;10:304–321. doi:10.1037/0893-3200.10.3.304. [Google Scholar]
- Margolin G, Gordis EB. The effects of family and community violence on children. Annual Review of Psychology. 2000;51:445–479. doi: 10.1146/annurev.psych.51.1.445. doi: 10.1146/annurev.psych.51.1.445. [DOI] [PubMed] [Google Scholar]
- Owren MJ, Bachorowski JA. Acoustic assessment of vocal expression of emotion. In: Coan J, Allen J, editors. Handbook of emotion elicitation and assessment. Oxford University; Oxford, UK: 2007. pp. 239–266. To appear. [Google Scholar]
- Perry TL, Ohde RN, Ashmead DH. The acoustic bases for gender identification from children's voices. The Journal of the Acoustical Society of America. 2001;109:2988–2998. doi: 10.1121/1.1370525. doi:10.1121/1.1370525. [DOI] [PubMed] [Google Scholar]
- Porter FL, Miller RH, Marshall RE. Neonatal pain cries: Effect of circumcision on acoustic features and perceived urgency. Child Development. 1986;57:790–802. doi:10.2307/1130355. [PubMed] [Google Scholar]
- Protopapas A, Eimas PD. Perceptual differences in infant cries revealed by modifications of acoustic features. Journal of the Acoustic Society of America. 1997;102:3723–3734. doi: 10.1121/1.420403. doi:10.1121/1.420403. [DOI] [PubMed] [Google Scholar]
- Pruessner JC, Kirschbaum C, Meinlschmid G, Hellhammer DH. Two formulas for computation of the area under the curve represent measures of total hormone concentration versus time-dependent change. Psychoneuroendocrinology. 2003;28:916–931. doi: 10.1016/s0306-4530(02)00108-7. oneudoi: 10.1016/S0306-4530(02)00108-7. [DOI] [PubMed] [Google Scholar]
- Raudenbush S, Bryk T, Congdon R. Hierarchical linear modeling. Version 7 Scientific Software International, Inc.; Lincolnwood, IL: 2010. [Google Scholar]
- Russell J, Bachorowski J, Fernandez-Dols J. Facial and vocal expressions of emotion. Annual Review of Psychology. 2003;54:329–349. doi: 10.1146/annurev.psych.54.101601.145102. doi:10.1146/annurev.psych.54.101601.145102. [DOI] [PubMed] [Google Scholar]
- Saxbe DE, Baucom B, Spies L, Margolin G. Does dampened physiological reactivity protect youth in aggressive family environments? Child Development. doi: 10.1111/j.1467-8624.2012.01752.x. in press. [DOI] [PMC free article] [PubMed] [Google Scholar]
- Saxbe DE, Repetti RL. Fathers' and mothers' marital relationship predicts daughters' pubertal development two years later. Journal of Adolescence. 2009;32:4150–432. doi: 10.1016/j.adolescence.2008.06.009. doi:10.1016/j.adolescence.2008.06.009. [DOI] [PubMed] [Google Scholar]
- Scherer K. Emotions as episodes of subsystem synchronization driven by nonlinear appraisal processes. In: Lewis MD, Granic I, editors. Emotion, development, and self-organization: Dynamic systems approaches to emotional development. Cambridge University Press; Cambridge, MA: 2000. pp. 70–99. doi:10.1017/CBO9780511527883.005. [Google Scholar]
- Scherer K. The dynamic architecture of emotion: Evidence for the component process model. Cognition and Emotion. 2009;23:1307–1351. doi:10.1080/02699930902928969. [Google Scholar]
- Singer JD, Willett JB. Applied longitudinal data analysis: Modeling change and event occurrence. Oxford University Press; New York, NY: 2003. [Google Scholar]
- Smyth JM, Ockenfels MC, Gorin AA, Catley D, Porter LS, Kirschbaum C, Stone AA. Individual differences in the diurnal cycle of cortisol. Psychoneuroendocrinology. 1997;22:89–105. doi: 10.1016/s0306-4530(96)00039-x. doi:10.1016/S0306-4530(96)00039-X. [DOI] [PubMed] [Google Scholar]
- Spies LA, Margolin G, Susman E, Gordis EB. Adolescents' cortisol reactivity and subjective distress in response to family conflict: The moderating role of internalizing symptoms. Journal of Adolescent Health. 2011;49:386–392. doi: 10.1016/j.jadohealth.2011.01.014. doi:10.1016/j.jadohealth.2011.01.014. [DOI] [PMC free article] [PubMed] [Google Scholar]
- Sroufe LA. Emotional development: The organization of emotional life in the early years. Cambridge University Press; New York, NY: 1997. [Google Scholar]
- StataCorp . Stata statistical software: Release 11. StataCorp LP; College Station, TX: 2009. [Google Scholar]
- Tsai JL, Levenson RW, Carstensen LL. Autonomic, subjective, and expressive responses to emotional films in older and younger Chinese Americans and European Americans. Psychology and Aging. 2000;15:684–693. doi: 10.1037//0882-7974.15.4.684. doi:10.1037/0882-7974.15.4.684. [DOI] [PubMed] [Google Scholar]
- Williams C, Stevens K. On determining the emotional state of pilots during flight: An exploratory study. Aerospace Medicine. 1969;40:1369–1372. [Google Scholar]
- Yerkes RM, Dodson JD. The relation of strength of stimulus to rapidity of habit-formation. Journal of Comparative Neurology and Psychology. 1908;18:459–482. doi:10.1002/cne.920180503. [Google Scholar]
- Zeskind PS, Marshall TR. The relation between variations in pitch and maternal perceptions of infant crying. Child Development. 1988;59:193–196. [Google Scholar]