

Abstract
Background
Chronic transfusion therapy (CTT) is a mainstay for stroke prophylaxis in sickle cell anemia, but its effects on hemodynamics are poorly characterized. Transfusion improves oxygen carrying capacity, reducing demands for high cardiac output, while decreasing hemoglobin S%, reticulocyte count, and hemolysis. We hypothesized that transfusion would improve oxygen carrying capacity, but that would be counteracted by a decrease in cardiac output due to increased hematocrit and vascular resistance, leaving oxygen delivery unchanged.
Study Design and Methods
To test this hypothesis, we examined patients on CTT immediately pre transfusion and again 12–120 hours post transfusion, using echocardiography and near infrared spectroscopy.
Results
Comparable increases in hemoglobin and hematocrit, and decreases in reticulocyte count and hemoglobin S with transfusion were observed in all patients; but males had a larger rebound of hemoglobin S%, reticulocyte count, and free hemoglobin levels between transfusions. In males, transfusion decreased heart rate by 12%, stroke volume by 15%, and cardiac index by 24% while estimates for pulmonary and systemic vascular resistance rose, culminating in 6% decrease in oxygen delivery. In contrast, stroke volume and cardiac index, systemic and pulmonary vascular resistance did not change in women following transfusion, such that oxygen delivery improved 17%.
Conclusion
In our sample population, males exhibit a paradoxical reduction in oxygen delivery in response to transfusion because the rise in vascular resistance is larger than the increase in oxygen capacity. This may result from an inability to adequately suppress their hemoglobin S% between transfusion cycles.
Keywords: Pulmonary Circulation, Vascular Resistance, Cardiopulmonary Interactions, Cardiovascular Performance
Introduction
Sickle cell anemia (SCA) is a common hemoglobinopathy that causes significant morbidity and mortality.1 Cardiac output is increased in non-transfused SCA subjects, proportional to their anemia, preserving their tissue oxygen delivery.2–5 Also, vascular disease is a common cause of morbidity in SCA and its etiology is multifactorial with contributions from chronic intravascular hemolysis, via release of plasma free hemoglobin, as well as vascular inflammation and abnormal blood rheology.6,7 LDH, plasma free hemoglobin and arginine:ornithine ratio have been described elsewhere as markers of intravascular hemolysis.8 Chronic transfusion therapy reduces complications of sickle cell disease and (CTT) is utilized as secondary prevention for SCA patients following stroke, as primary prevention in children at high risk for stroke based on transcranial Doppler (TCD), or in patients having intractable sickle crises.9–15 CTT decreases hemoglobin S concentration and increases oxygen carrying capacity, which intuitively ought to improve both chronic intravascular hemolysis and red cell deformability, thereby improving tissue oxygen delivery.16,17 However, increased hematocrit acutely following a single transfusion increases whole blood viscosity and vascular resistance in a nonlinear manner.18–20 Cardiac index may therefore fall in response to increased hematocrit, partially or completely counteracting the increase in oxygen carrying capacity. In fact, the acute hemodynamic consequences of transfusion therapy and their overall affect on tissue oxygen delivery are poorly characterized and unpredictable.21 In this study we evaluate the acute effects of transfusion on hemodynamics and oxygen delivery in 25 SCD patients on chronic transfusion therapy. We hypothesized that despite decreasing hemoglobin S% and increasing hemoglobin/hematocrit, transfusion would produce balanced effects on cardiac index and oxygen capacity leaving tissue oxygen delivery unchanged.
Patients and Methods
Patients
This study was a prospective, cross sectional evaluation of the acute hemodynamic effects of transfusion in 26 chronically transfused SCD patients. One patient was excluded due to lack of post transfusion data. Subjects with HbSS Sickle Cell Anemia on chronic transfusion protocol were identified in the outpatient transfusion clinic at Children’s Hospital Los Angeles or by their primary hematologist and were enrolled between August 2008 and September 2010. The exclusion criteria were age <10 years old, chronic transfusion therapy <1 year, sickle crisis within the previous four weeks, defined as requiring inpatient admission or an emergency room visit with an increase in pain medications above their baseline usage for greater than 2 days. All patients provided written informed consent or parental consent and patient assent were obtained according to the protocol approved by the Committee for Clinical Investigation at Children’s Hospital Los Angeles.
Most patients receive simple transfusions every three weeks. All units are extended crossmatched (C, E, Kell) packed RBC less than 14 days old, unless there is no antigen matched unit available in that age range. Transfusion frequency and volume are modified to maintain HgB S% less than 30% and immediate post transfusion Hb < 12 g/dl to minimize hyperviscosity. If patients have adequate venous access, erythrocytophersis is utilized, but in our cohort only three patients undergo regular erthrocytophoresis. Aliquots of blood are all stored in CPDA. All patients underwent history & physical exam, echocardiography, and laboratory analysis on the morning of transfusion prior to receiving any blood products. The experimental protocol was subsequently repeated 12 – 120 hours post transfusion (mean 2.3 days, SD=1.4 days) when peritransfusional changes in fluid, hormonal, and immune axes should have dissipated and post transfusional hematocrit stabilized.
Echocardiography
One investigator (J.D.) performed an echocardiogram, using a Philips IE 33 ultrasound machine, version 3.0.2.711 prior to and following transfusion. Standard 2D, M-mode and tissue Doppler derived function measurements were made according to published standards.22–24 Cardiac output measurements were made utilizing pulsed wave Doppler velocity time-integral (VTI) measurements at the level of the left ventricular outflow tract; cardiac output was converted to cardiac index by normalizing to body surface area. Systemic vascular resistance index (SVRi) was calculated using cuff derived mean arterial blood pressure, inferior vena cava (IVC) collapse estimate of right atrial pressure, and cardiac index.25 Pulmonary vascular resistance index (PVRi) measurements were performed as described in Dahiya et. Al., using mitral E/E′, tricuspid regurgitation (TR) jet velocity derived pressure estimate and cardiac index.26 M-mode shortening fraction and ejection fraction by Simpson’s method were used as objective measures of global systolic function. Oxygen delivery was measured using the product of cardiac index * oxygen content (hemoglobin x 1.34 mlO2/g x resting oxygen saturation), neglecting the insignificant contribution of dissolved oxygen.
Near Infrared Spectroscopy
Near infrared spectroscopy (NIRS) measures oxyhemoglobin saturation, providing an estimate of regional mixed venous oxygen saturation. This has been correlated with both tissue oxygen consumption and regional flow.27 Measurements were made with a NIRS device (Somanetics Inc Troy, MI). Sensors were placed on the dorsal surface of both hands at rest, prior to and following transfusions. Samples are acquired every 4 seconds over 3–5 minutes and averaged.
Hematologic Analysis
A venous blood sample of ~15cc was drawn prior to transfusion and at the post transfusion study visit to evaluate hematocrit, hemoglobin, white blood cell count (WBC) and platelets. Markers of hemolysis were measured, including LDH, plasma free hemoglobin and arginine ornithine ratio. High sensitivity CRP (hsCRP) was measured as a marker of inflammation. Iron indices were also measured.
Data Analysis
Cardiovascular and hematologic responses to transfusion were evaluated by two-sided, paired T-tests. Wilcoxon Rank Sum Test was used when data were not normally distributed. Linear regression was performed for correlations of continuous data. JMP (version 5.1.2, SAS Institute Inc., Cary, North Carolina) was used for all statistical analyses.
Results
Demographics
25 patients with sickle cell anemia on chronic transfusion therapy, 13 female (52%) and 12 male (48%), were enrolled and had complete data. Demographics are shown in Table 1. Males tended to be taller than females; but both sexes were well balanced for age, weight, body mass index and body surface area. Males and females had similar duration of CTT and indices of iron overload, although liver iron trended higher in females. There was no sex difference in the frequency or volume of transfusions over the previous year nor was there a difference in the age of the blood or volume of blood given on the day of the study. Males were studied an average of 25.1 days (range 13–41) since their prior transfusion compared with 22.2 days (range 14–41) for the females but this difference did not reach statistical significance. There were two allo-immunized males and two auto-immunized males. Zero females were allo-immunized and one female was auto-immunized. One male with an anti-E antibody had increased plasma free hemoglobin (50 mg/dl) and an elevated TR jet >2.5m/s. Another male with both cold and warm autoantibodies also exhibited increased plasma free hemoglobin (35 mg/dl) and a TR jet >2.5m/s. Males and females had similar reasons for starting chronic transfusion therapy with an even distribution among stroke/CVA (9 patients), elevated trans-cranial Doppler (9 patients), recurrent acute chest episodes (6 patients) and pulmonary hypertension (PH) diagnosed by right heart catheterization (1 female patient). CTT normalized the TR velocity and right heart pressures prior to participation in this analysis. Three of these patients were started on CTT with a history of elevated TR jet >2.5m/s, including the female patient who was diagnosed with PH.
Table 1.
Demographics, transfusion data, MRI findings, and medication data in patients on chronic transfusion therapy.
| Demographics | Male (n=12) | Female (n=13) | P-Value |
|---|---|---|---|
| Age (±SD) | 18.2 (±6.2) | 21.3 (±10.0) | 0.35 |
| % African American | 83 | 85 | |
| Height in cm (±SD) | 167.7 (±16.7) | 157.2 (±11.5) | 0.09 |
| Weight in kg (±SD) | 60.4 (±16.9) | 56.1 (±14.9) | 0.5 |
| BMI kg/m2 (±SD) | 21.0 (±3.0) | 22.4 (±4.2) | 0.35 |
| BSA m2 (±SD) | 1.67 (±0.31) | 1.56 (±0.25) | 0.33 |
| Volume of blood given on the day of transfusion (ml/kg) | 8.4 (1.9) | 9.5 (3.8) | 0.42 |
| Age of blood given on the day of transfusion (days) | 22.0 (6.1) | 17.8 (9.1) | 0.19 |
| Number of Transfusions Over the Previous Year | 17.3 (6.0) | 17.9 (5.0) | 0.79 |
| Volume of Blood Over the Previous Year (ml/kg) | 172.0 (113.0) | 234.4 (108.9) | 0.17 |
| Days Since Last Transfusion (±SD) | 25.1 (±7.4) | 22.2 (±7.7) | 0.36 |
| Years on Transfusion Therapy (±SD) | 8.5 (±5.4) | 8.0 (±4.3) | 0.83 |
| Time Between Study Visits (days) | 2.2 (±1.5) | 2.4 (±1.4) | 0.71 |
| Allo-immunization | 2 | 0 | |
| Auto-immunization | 2 | 1 | |
| Cardiac T2* (ms) | 36 (±5.4) | 33.6 (±9.3) | 0.47 |
| Liver Iron (mg/g) | 16.2 (±12.6) | 26.1 (±13.1) | 0.07 |
| Reason for Transfusions | |||
| CVA | 4 | 5 | |
| Abnormal TCD | 5 | 4 | |
| recurrent Acute Chest | 3 | 3 | |
| Pulmonary Hypertension | 0 | 1 | |
| Hydroxyurea therapy | 2 | 2 | |
| Iron Chelator | |||
| none | 1 | 2 | |
| desferal | 1 | ||
| ex-jade | 11 | 9 | |
| ex-jade + desferal | 1 |
Data are expressed as mean ± one standard deviation. BSA = body surface area, BMI = body mass index, CVA = cerebrovascular accident, TCD = transcranial doppler
Average Laboratory and Hemodynamic Measurements
Table 2 compares hematologic and hemodynamic variables for males and females for the pre and post transfusion visits. Laboratory indices of iron were only measured pre-transfusion.
Table 2.
Pre and post transfusion average data for laboratory markers, diastolic function, systolic function and hemodynamics for male and female patients.
| Laboratory Value | Male Pre | Female Pre | P-Value | Male Post | Female Post | P-Value |
|---|---|---|---|---|---|---|
| WBC (K/uL) | 14.7±4.9 | 13.3±4.6 | 0.49 | 14.8±5.8 | 12.1±3.5 | 0.19 |
| Platelet (K/uL) | 358.5±114.4 | 287.6±97.8 | 0.11 | 346.7±92.7 | 260.8±84.0 | 0.03 |
| Hematocrit (%) | 28.0±2.2 | 28.7±2.9 | 0.49 | 34.3±3.0 | 34.1±3.3 | 0.89 |
| Hemoglobin (g/dL) | 9.6±0.7 | 9.4±1.1 | 0.64 | 11.9±0.9 | 11.6±1.2 | 0.63 |
| Hemoglobin S (%) | 41.9±22.5 | 27.6±10.5 | 0.06 | 37.7±17.8 | 21.3±6.9 | 0.01 |
| Reticulocyte Count (%) | 14.9±6.3 | 9.1±5.1 | 0.02 | 11.2±4.5 | 5.4±3.1 | 0.002 |
| LDH (U/L) | 1366±617 | 1039±430 | 0.14 | 1299±609 | 1039±449 | 0.26 |
| Transferrin (mg/dL) | 170.6 ±37.8 | 165.4 ±29.2 | 0.74 | NA | NA | NA |
| Ferritin (ng/ml) | 5297.2 ±6615.3 | 4635.5 ±2979.8 | 0.75 | NA | NA | NA |
| Iron Level (mcg/dL) | 140.3 ±47.7 | 198.9 ±113.9 | 0.1 | NA | NA | NA |
| hsCRP (mg/L) | 7.6±6.1 | 4.0±4.8 | 0.14 | 2.8±2.2 | 5.3±5.5 | 0.16 |
| Arg/Orn | 1.2±0.3 | 1.0±0.4 | 0.19 | 1.1±0.5 | 1.2±0.4 | 0.55 |
| Plasma Free Hemoglobin (mg/dL) | 28.1±16.0 | 13.3±8.6 | 0.02 | 22.2±15.0 | 14.7±11.2 | 0.19 |
| Measures of Diastolic Function | ||||||
| MV E/A | 2.1±0.4 | 2.0±0.4 | 0.52 | 2.2±0.4 | 2.1±0.6 | 0.52 |
| Lateral Mitral E/e′ | 6.0±1.5 | 7.0±1.7 | 0.14 | 6.2±1.0 | 6.5±1.8 | 0.6 |
| Medial Mitral E/e′ | 8.1±1.6 | 9.6±2.5 | 0.1 | 8.4±1.8 | 9.2±1.9 | 0.33 |
| TV E/A | 1.7±0.3 | 1.6±0.4 | 0.85 | 1.8±0.3 | 1.7±0.5 | 0.42 |
| Tricuspid Valve E/e′ | 4.6±1.4 | 5.0±1.8 | 0.55 | 5.0±1.4 | 4.8±2.1 | 0.86 |
| Measures of Systolic Function | ||||||
| LV SF (%) | 38.1±4.2 | 39.4±6.5 | 0.56 | 36.6±2.9 | 37.3±9.5 | 0.81 |
| LV EF (%) | 59.9±4.5 | 60.6±5.0 | 0.72 | 58.8±4.6 | 57.4±5.1 | 0.49 |
| Tei Index-Lateral Mitral | 0.539±0.134 | 0.507±0.109 | 0.51 | 0.523±0.116 | 0.580±0.266 | 0.49 |
| Tei Index-Medial Mitral | 0.511±0.118 | 0.540±0.09 | 0.5 | 0.528±0.08 | 0.545±0.087 | 0.64 |
| Tei Index-Tricuspid Valve | 0.481±0.101 | 0.546±0.134 | 0.19 | 0.547±0.137 | 0.554±0.157 | 0.89 |
| Hemodynamic Parameter | ||||||
| HR(bpm) | 76.0±9.4 | 82.7±7.0 | 0.06 | 67.3±8.4 | 73.4±7.2 | 0.07 |
| SV(ml) | 73.6±21.9 | 61.8±13.8 | 0.13 | 62.8±16.1 | 65.6±21.3 | 0.72 |
| CI(L/min/m2) | 3.3±0.6 | 3.3±0.9 | 0.92 | 2.5±0.6 | 3.1±0.9 | 0.05 |
| MAP(mmHg) | 79.3±6.5 | 80.1±7.1 | 0.78 | 81.8±9.6 | 81.5±5.8 | 0.93 |
| TR Jet (m/s) | 2.4±0.4 | 2.0±0.3 | 0.01 | 2.3±0.2 | 2.0±0.3 | 0.002 |
| PVRI (mmHg/(L/min/m2)) | 5.6±2.7 | 3.2±1.2 | 0.02 | 6.7±2.6 | 3.2±1.6 | 0.0007 |
| SVRI (mmHg/(L/min/m2) | 24.7±4.7 | 25.5±7.9 | 0.77 | 33.9±7.6 | 28.0±7.6 | 0.07 |
| O2 Delivery (ml/L/min/m2) | 433±92 | 418±87 | 0.69 | 406±84 | 490±160 | 0.13 |
| NIRS (%) | 49.1±10.2 | 46.0±8.2 | 0.45 | 42.6±10.4 | 52.5±8.6 | 0.04 |
Data are expressed as mean ± one standard deviation. LDH = lactate dehydrogenase, hsCRP = high sensitivity C-reactive protein, LV EF = left ventricle ejection fraction, LV SF = left ventricle shortening fraction, TR jet = tricuspid regurgitation jet, SVRI = systemic vascular resistance index, PVRI = pulmonary vascular resistance index, NIRS = near infrared spectroscopy
Hemoglobin and hematocrit were similar in males and females; however, males had increased %HbS, reticulocyte count, platelet count, and plasma free hemoglobin. Figure 1 demonstrates %HbS and reticulocyte count rise sharply with time following last transfusion in males but not females. Plasma free hemoglobin also appears to rise faster in the males, however, this difference did not reach statistical significance. Although platelets are increased in males, platelet count did not vary with transfusion interval. High sensitivity CRP and LDH were significantly elevated compared to reference values for both males and females.
Figure 1. Sex differences in recovery of hemoglobin S% (A), reticulocyte count (B), plasma free hemoglobin (C) and platelet count (D).

Male patients are denoted by the filled squares and a solid regression line and female patients by open circles and a dashed regression line. Pearson correlation coefficient and P value are shown for significant differences. Pre-transfusion values were correlated with the time from previous transfusion to the study visit to determine sex differences in recovery of these variables. Males increased hemoglobin S% and reticulocyte count and tended to increase plasma free hemoglobin levels at a faster rate following transfusion.
Measures of diastolic function, E/A and E/E′, were normal; however, females tended to have higher LV E/E′ ratio at both the LV septal and lateral wall, suggesting slightly higher end diastolic pressure. The common objective echocardiographic measures of systolic function, ejection fraction and shortening fraction, were within normal limits and similar for male and female patients. LV and RV myocardial performance indices (MPI), were significantly elevated compared to published normal values (0.38 +/−0.06 for the LV and 0.37 +/−0.05 for the RV), but there were no sex differences.
Heart rate was higher in females despite similar hemoglobin and hematocrit and there was a trend toward higher cardiac index. Systolic, diastolic, and mean arterial blood pressure was similar between male and female patients. TR jet and pulmonary vascular resistance estimates were significantly increased in males but there was no difference in the average systemic vascular resistance or oxygen delivery. There was no association between plasma free hemoglobin and pre-transfusion cardiac index, SVRi or O2 delivery in the male and female patients. For the group, there was a strong association between pre transfusion plasma free hemoglobin and pre transfusion TR jet velocity (R2=0.43, P=0.002).
Age of the blood, frequency of transfusions over the previous year, volume of blood over the previous year and the number of years on transfusion (Table 1) are not associated with the pre or post-transfusion reticulocyte count, hemoglobin S% and plasma free hemoglobin by linear regression (data not shown). There is no association between blood age, previous year blood volumes or years on transfusion and TR jet, cardiac index, oxygen delivery, and SVRi (data not shown),
Pre to Post Transfusion Changes in Hemolysis, Inflammation, Cardiac Function and Hemodynamics
Changes in laboratory markers, vital signs, echocardiography and NIRS values in response to a single transfusion episode are demonstrated in Table 3; values displayed are for male, female and pooled responses. Hemoglobin, hematocrit, hemoglobin S% and reticulocyte count responded intuitively to transfusion in both sexes. Regardless of sex, plasma free hemoglobin decreased with transfusion if the pre-transfusion level was greater than 20mg/dL (Figure 2).
Table 3.
Laboratory, diastolic function, systolic function and hemodynamic changes with transfusion in male, female and pooled groups.
| Laboratory Value | Male | Female | Combined |
|---|---|---|---|
| Pre to Post Change | Pre to Post Change | Pre to Post Change | |
| White Blood Cell Count (K/uL) | 0.1 ±0.7 | −1.6 ±0.9 | −0.8 ±0.6 |
| Hemoglobin (g/dL) | 2.3 ±0.2 | 2.2 ±0.3 | 2.3 ±0.2 |
| Hematocrit (%) | 6.3 ±0.7 | 5.3 ±1.0 | 5.8 ±0.6 |
| Platelet Count (K/uL) | −11.8 ±15.0 | −27.5 ±15.2 | −20.0 ±10.6 |
| Hemoglobin S (%) | −6 ±2.7 | −4.8 ±1.1 | −5.4 ±1.4 |
| Reticulocyte Count (%) | −4.4 ±0.8 | −3.8 ±1.2 | −4.0 ±0.7 |
| LDH (U/L) | −68.3 ±62.9 | −31.9 ±41.6 | −49.3 ±36.4 |
| hsCRP (mg/L) | −4.4 ±2.1 | 0.4 ±2.3 | −1.9 ±1.6 |
| Arginine:Ornithine | −0.1 ±0.1 | 0.2 ±0.2 | 0.0 ±0.1 |
| Plasma Free Hemoglobin (mg/dL) | −4.2 ±5.8 | 1.8 ±5.8 | −1.5 ±4.1 |
| Measures of Diastolic Function | |||
| Mitral Valve E/A | 0.2 ±0.1 | 0.2 ±0.1 | 0.2 ±0.1 |
| Lateral Mitral E/e′ | 0.2 ±0.5 | −0.1 ±0.5 | 0.04 ±0.33 |
| Medial Mitral E/e′ | 0.3 ±0.3 | 0.0 ±0.5 | 0.2 ±0.3 |
| Tricuspid Valve E/A | 0.2 ±0.1 | 0.0 ±0.1 | 0.1 ±0.1 |
| Tricuspid Valve E/e′ | 0.3 ±0.4 | −0.4 ±0.5 | 0.04 ±0.34 |
| Measures of Systolic Function | |||
| LV SF (%) | −1.6 ±1.2 | −2.0 ±2.1 | −1.8 ±1.2 |
| LV EF (%) | −1.2 ±2.0 | −3.1 ±1.6 | −2.2 ±1.2 |
| Lateral Mitral Tei Index | −0.016 ±0.052 | 0.079 ±0.064 | 0.033 ±0.042 |
| Medial Mitral Tei Index | 0.004 ±0.036 | 0.007 ±0.034 | 0.006 ±0.024 |
| Tricuspid Valve Tei Index | 0.066 ±0.057 | 0.028 ±0.049 | 0.046 ±0.037 |
| Hemodynamics | |||
| Heart Rate (bpm) | −8.8 ±2.6 | −8.6 ±1.3 | −8.7 ±1.4 |
| Stroke Volume (ml) | −10.8 ±4.9 | 3.2 ±3.6** | −3.6 ±3.3 |
| Cardiac Index(L/min/m2) | −0.8 ±0.3 | −0.2 ±0.2* | −0.5 ±0.2 |
| Systolic Blood Pressure (mmHg) | −0.3 ±3.2 | −2.8 ±3.3 | −1.6 ±2.3 |
| Diastolic Blood Pressure (mmHg) | 3.8 ±3.4 | 3.2 ±2.6 | 3.5 ±2.1 |
| Mean Arterial Pressure (mmHg) | 2.5 ±2.9 | 1.6 ±2.4 | 2.0 ±1.8 |
| TR Jet (cm/s) | −6.8 ±8.4 | −3.0 ±6.3 | −4.8 ±5.1 |
| SVRI (mmHg/(L/min/m2) | 9.2 ±2.5 | 2.5 ±1.8** | 5.7 ±1.6 |
| PVRI (mmHg/(L/min/m2)) | 1.2 ±0.5 | 0.2 ±0.4 | 0.6 ±0.3 |
| Oxygen Delivery (ml/L/min/m2) | −26.7 ±34.7 | 70.8 ±30.6** | 24.0 ±24.6 |
| NIRS (%) | −5.4 ±4.2 | 4.1 ±1.8* | −0.6 ±2.5 |
Significant pre to post transfusion changes (p < 0.05) are indicated by bold type while trends (0.05 < p < 0.10) are italicized.
indicates a trend difference between male and female patients (0.05 < p < 0.10),
indicates a significant difference (p < 0.05).
LDH = lactate dehydrogenase, hsCRP = high sensitivity C-reactive protein, LV EF = left ventricle ejection fraction, LV SF = left ventricle shortening fraction, TR jet = tricuspid regurgitation jet, SVRI = systemic vascular resistance index, PVRI = pulmonary vascular resistance index, NIRS = near infrared spectroscopy
Figure 2. Change in plasma free hemoglobin level after transfusion.

Figure suggests that patients with an initial plasma free hemoglobin level >20mg/dL will have a decrease in free hemoglobin with transfusion, however, patients with levels <20mg/dL could have increases or decreases in their level.
Systolic and diastolic markers of cardiac function were minimally affected by transfusion in either sex. Mitral E to A ratio increased, consistent with a change in preload. Shortening and ejection fractions remained the same and there were no significant changes in RV or LV MPI.
Transfusion reduced cardiac index by 15% (0.5 L/min/m2) and lowered heart rate, commensurate with the increase in hemoglobin. Males had a disproportionate reduction in cardiac index (Table 3, Figure 3), thereby decreasing oxygen delivery despite the improvement in oxygen carrying capacity with transfusion. While transfusion increased oxygen delivery 17% in women, it reduced oxygen delivery in males by 6%. NIRS recordings from the hands parallel these observations, with peripheral venous oxygen saturation improving with transfusions only in females following transfusion.
Figure 3. Hemodynamic changes in male and female patients after transfusion.
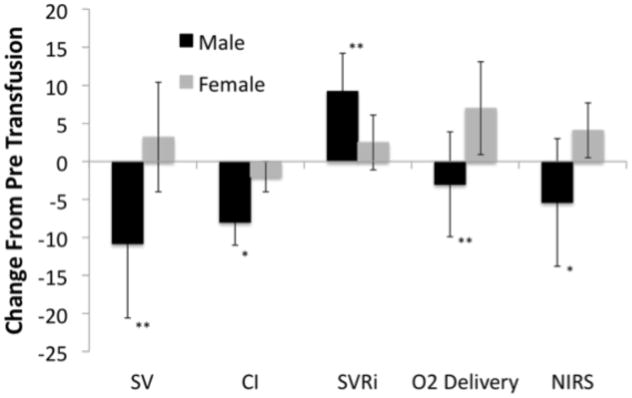
* indicates a trend difference between male and female patients (0.05 < p < 0.10), ** indicates a significant difference (p < 0.05). SV = stroke volume (ml), CI = cardiac index (dL/min/m2), SVRi = systemic vascular resistance index (woods units), NIRS = near infrared spectroscopy (%). Figure shows that males decreased stroke volume and cardiac index to a greater degree than females. The males also increased systemic and pulmonary vascular resistance to a greater degree. Effects combined to decrease oxygen delivery in males versus increase in females.
Reduced cardiac index in males following transfusion was predominantly secondary to reduction in stroke volume index; heart rate fell an average of 9 beats per minute in both sexes. Systolic, diastolic and mean arterial blood pressure did not change with transfusion. Systemic and pulmonary vascular resistance indices increased 25% and 15% respectively, reaching significance only in males. Paradoxical to the group increase in PVRi after transfusion, the prevalence of TR jet > 2.5 m/s decreased following transfusion (Figure 4).
Figure 4. Change in percentage of patients with a TR jet velocity >2.5m/s.
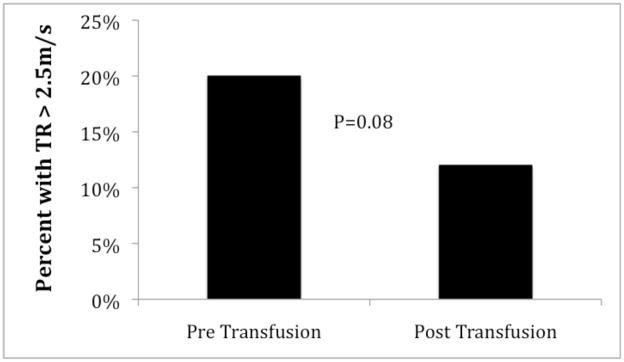
Figure demonstrates a small decrease in the incidence of TR jet >2.5m/s after transfusion. No patient with a TR jet <2.5m/s had a TR jet >2.5m/s post transfusion. All patients in our cohort with TR jet >2.5m/s were male, but the percentage values were based on the total population.
Discussion
Sickle cell anemia has known cardiovascular complications including stroke, pulmonary hypertension, chronic leg ulcers, heart failure and sudden death. The etiology is multifactorial, resulting from chronic hemolysis and decreased nitric oxide bioavailability, inflammation, abnormal blood viscosity from reversible and irreversible sickling, and chronic large vessel and microvascular dysfunction.28–30 Chronic transfusion therapy is used to decrease the incidence of first time and recurrent stroke in patients with sickle cell anemia, however, its effects on other vascular complications is poorly characterized.12,15,31 Furthermore, the mechanism by which CTT decreases the risk of stroke is not well understood. It is thought that suppression of endogenous erythrocyte production and circulating hemoglobin S% is essential.17 Our initial hypothesis centered on hemodynamic changes in a population of SCA patients on chronic transfusion therapy. We found that our study population did not significantly increase oxygen delivery after a single transfusion; however, there was wide interpatient variability. When we examined age and sex differences for transfusion-induced changes in oxygen delivery, there were marked sex differences in both hemodynamic measures as well as hemoglobin S%, plasma free hemoglobin, reticulocyte count and platelet count. Despite the post hoc nature of the sex differences, we cannot ignore them. Males demonstrated sharp increases in reticulocyte count, hemoglobin S% and plasma free hemoglobin between transfusions, compared to females. This was not related to timing between the previous transfusion and the first study visit, nor was it related to total volume or frequency of transfusions over the previous year. This difference in hemoglobin S% might represent one mechanism to explain increased vascular complications previously observed in males with SCA1,32, and may contribute to the higher systemic vascular resistance, TR velocity and pulmonary vascular resistance estimates documented in our study. Testosterone directly stimulates marrow activity and could also be responsible for the sex disparity but we did not have sufficient sample size or pre-pubertal males to test this hypothesis.33
Transfusion had surprisingly complicated effects on hemodynamics that were also sex specific. Overall, transfusion decreased cardiac output by reducing heart rate and stroke volume, as expected. Males demonstrated a more pronounced increase in total systemic resistance and estimated pulmonary resistance with significant decreases in stroke volume and cardiac index. Much to our surprise, oxygen delivery decreased in males following transfusion, while it increased in females. In this cohort, we cannot determine whether the resistance difference and resultant oxygen delivery difference seen in the males is due to a primary decrease in stroke volume or a primary increase in vascular resistance. The former would require isolated impairment of cardiac mechanical properties, not detectable by echocardiography, which is unlikely. Alternatively, changes in vascular resistance could be secondary to abnormal rheology from an increased platelet count, hemoglobin S% and reticulocyte count or from NO scavenging by plasma free hemoglobin. NO, viscosity and cellular deformability modulate vascular resistance at multiple levels, but the microvasculature is particularly sensitive to increased viscosity and red cell deformability, which is directly related to hemoglobin S.
Our estimate of PVRi is a combination of TR Jet (estimate of PA pressure), E/E′ (correlate of pulmonary capillary wedge pressure) and CI. In our cohort, the PVRi difference was due to a higher TR jet and lower E/E′ in the males, suggesting pre-capillary increases in PA pressure; right heart cath would be required to prove this hypothesis. Males have a propensity for more severe vascular disease6,32 and the vascular response to transfusion could be modulated by sex differences in marrow suppression. Plasma free hemoglobin levels correlated with TR jet, although the relationship was primarily driven by the higher TR in males. Plasma free hemoglobin also correlated with PVRI, but the effect was much weaker (r2=0.09, p=0.015). We could not demonstrate an effect of hemoglobin S%, reticulocyte count or LDH on TR jet, SVRi, CI or O2 delivery in either sex. However, given the diffuse endotheliopathy in sickle cell disease, global hemodynamics are unlikely to be sensitive enough to detect microcirculatory disease, where hemoglobin S would exert most of its effects.
Global measurements of oxygen delivery only reflect potential oxygen supply to organs; effective tissue oxygen delivery requires an intact microvascular bed, which is often compromised in SCD. However, near infrared spectroscopy tracks a weighted combination of tissue oxygenated and deoxygenated hemoglobin at the microvascular level and is a robust metric of tissue oxygen supply-demand balance38,39. Changes in local tissue oxygenation by NIRS mirrored the sex differences observed in global oxygen delivery. Greater microvascular disease and lower average NIRS saturation would not be surprising, given that higher plasma free hemoglobin, platelet count, hemoglobin S% and reticulocyte count have all been implicated in chronic microvascular disease in SCA patients.28,30,40
Multiple studies have shown that basic metrics of cardiac systolic performance are preserved in patients with sickle anemia.2,3 MPI, which includes both isovolumic contraction (IVCT) and relaxation times (IVRT) and ejection time (ET), takes into account both diastolic and systolic function. This was significantly elevated relative to population norms, signifying poor myocardial performance similar to patients with dilated cardiomyopathy, primary pulmonary hypertension and other systemic diseases.41–45 This metric although abnormal, demonstrated no sex differences and little change with transfusion, suggesting a ubiquitous maladaptation present in these patients. The mechanism of decreased myocardial performance is unclear, whether it is primarily a change in IVRT, IVCT or ET cannot be answered in our study.
E/E′ has been shown to correlate with pulmonary capillary wedge pressure (PCWP) and LV end diastolic pressure (LVEDP).23 Both the RV and LV E/E′ were within normal limits for published norms, however the females had a higher E/E′ both pre and post transfusion suggesting a higher PCWP/LVEDP as a chronic response to anemia. Interestingly an increase in MV E/A was seen in our patients and this was due to a 10% (P=0.08) and 12% (P=0.009) decrease in mitral A wave velocity for the males and females respectively. This is consistent with previous studies showing decreased LV compliance and increased incidence of diastolic heart failure in females.46,47 With the exception of MPI, systolic and diastolic function parameters were within normal limits of published norms, demonstrating that SCA patients on CTT are able to compensate for increased cardiac output. Importantly, the disparate effect of transfusion on oxygen delivery does not appear to result from changes in cardiac systolic or diastolic function but rather hematologic and peripheral vascular effects.
Our study was limited by its small size and cross-sectional nature, we acknowledge the need for similar studies in a larger cohort of patients. In addition, we would like to assess these patients longitudinally to determine if these changes are stable over time and whether adjusting transfusion parameters or stricter transfusion protocols would alter the hemodynamic and hematologic irregularities. There was no transfusion control group because non-transfused SCA patients only receive a transfusion during severe crisis events such as acute chest syndrome and our goal was study sickle cell patients during a steady state period. In order to understand how patients on CTT differ, at a baseline, from non-transfused patients and healthy controls, the changes that surround a single transfusion must be understood. Healthy individuals do not receive blood transfusions, making healthy control experiments unrealistic; therefore, our observations are limited to pre and post transfusion measurements using each patient as their own control. We then utilized paired statistics to help increase the power of our study. There is also inherent selection bias when studying patients on CTT because their hemorheologic and vascular disease is more severe. Echocardiographic estimation of cardiac output, which underlies some of our hemodynamic measurements, is limited by certain mathematical assumptions. Similarly, noninvasive estimates of systemic and pulmonary vascular resistance have been derived in populations other than sickle cell disease. Paired differences across transfusions and relative sex differences reduce systematic errors from these geometric assumptions but absolute vascular resistances can only be obtained through cardiac catheterization. However, correspondence of our echocardiographic predictions of oxygen delivery with tissue NIRS response is reassuring that our observations are physiologically relevant.
In conclusion, each transfusion lowers heart rate and cardiac index in patients on CTT. Males demonstrate a disproportionate reduction in cardiac index and stroke volume indices such that oxygen delivery declines following each transfusion. This likely represents more extensive vascular disease as a result of hormonal differences, greater average hemoglobin S concentrations, reticulocyte counts, and cell-free hemoglobin. Thus males may benefit from stricter adherence to 21-day transfusion cycles, utilization of exchange transfusions, or concomitant use of hydroxyurea and CTT. Further work is necessary to determine whether our observed sex differences in vascular function are apparent prior to sexual maturation and hold true for a larger population of SCA patients.
Acknowledgments
This work was supported by a grant from the National Institutes of Health, National Heart Lung and Blood Institute (NIH# 1 U54 HL090511-01)(T.C.):Sickle Cell Scholar Award; (5 RC1 HL099412-01)(J.D.), and by the Children’s Hospital Los Angeles General Clinical Research Center (NIH #RR00043-43)(J.D.)
We would like to thank Dr. Istvan Seri in the Division of Neonatal Medicine for technical support of our research. We would also like to the thank the hematology division at Children’s Hospital Los Angeles for their support, particularly Susan Claster M.D., Vasili Berdoukas M.D., and Thomas Hofstra M.D.
Footnotes
Conflict of Interest: The authors have no disclosures.
References
- 1.Platt OS, Brambilla DJ, Rosse WF, Milner PF, Castro O, Steinberg MH, Klug PP. Mortality in sickle cell disease. Life expectancy and risk factors for early death. N Engl J Med. 1994;330:1639–44. doi: 10.1056/NEJM199406093302303. [DOI] [PubMed] [Google Scholar]
- 2.Batra AS, Acherman RJ, Wong WY, Wood JC, Chan LS, Ramicone E, Ebrahimi M, Wong PC. Cardiac abnormalities in children with sickle cell anemia. Am J Hematol. 2002;70:306–12. doi: 10.1002/ajh.10154. [DOI] [PubMed] [Google Scholar]
- 3.Lester LA, Sodt PC, Hutcheon N, Arcilla RA. Cardiac abnormalities in children with sickle cell anemia. Chest. 1990;98:1169–74. doi: 10.1378/chest.98.5.1169. [DOI] [PubMed] [Google Scholar]
- 4.Varat MA, Adolph RJ, Fowler NO. Cardiovascular effects of anemia. Am Heart J. 1972;83:415–26. doi: 10.1016/0002-8703(72)90445-0. [DOI] [PubMed] [Google Scholar]
- 5.Ng ML, Liebman J, Anslovar J, Gross S. Cardiovascular findings in children with sickle cell anemia. Dis Chest. 1967;52:788–99. doi: 10.1378/chest.52.6.788. [DOI] [PubMed] [Google Scholar]
- 6.Gladwin MT, Sachdev V, Jison ML, Shizukuda Y, Plehn JF, Minter K, Brown B, Coles WA, Nichols JS, Ernst I, Hunter LA, Blackwelder WC, Schechter AN, Rodgers GP, Castro O, Ognibene FP. Pulmonary hypertension as a risk factor for death in patients with sickle cell disease. N Engl J Med. 2004;350:886–95. doi: 10.1056/NEJMoa035477. [DOI] [PubMed] [Google Scholar]
- 7.Tripette J, Alexy T, Hardy-Dessources MD, Mougenel D, Beltan E, Chalabi T, Chout R, Etienne-Julan M, Hue O, Meiselman HJ, Connes P. Red blood cell aggregation, aggregate strength and oxygen transport potential of blood are abnormal in both homozygous sickle cell anemia and sickle-hemoglobin C disease. Haematologica. 2009;94:1060–5. doi: 10.3324/haematol.2008.005371. [DOI] [PMC free article] [PubMed] [Google Scholar]
- 8.Kato GJ, Gladwin MT, Steinberg MH. Deconstructing sickle cell disease: reappraisal of the role of hemolysis in the development of clinical subphenotypes. Blood Rev. 2007;21:37–47. doi: 10.1016/j.blre.2006.07.001. [DOI] [PMC free article] [PubMed] [Google Scholar]
- 9.Lusher JM, Haghighat H, Khalifa AS. A prophylactic transfusion program for children with sickle cell anemia complicated by CNS infarction. Am J Hematol. 1976;1:265–73. doi: 10.1002/ajh.2830010210. [DOI] [PubMed] [Google Scholar]
- 10.Sarnaik S, Schornack J, Lusher JM. The incidence of development of irregular red cell antibodies in patients with sickle cell anemia. Transfusion. 1986;26:249–52. doi: 10.1046/j.1537-2995.1986.26386209381.x. [DOI] [PubMed] [Google Scholar]
- 11.Abboud MR, Cure J, Granger S, Gallagher D, Hsu L, Wang W, Woods G, Berman B, Brambilla D, Pegelow C, Lewin J, Zimmermann RA, Adams RJ. Magnetic resonance angiography in children with sickle cell disease and abnormal transcranial Doppler ultrasonography findings enrolled in the STOP study. Blood. 2004;103:2822–6. doi: 10.1182/blood-2003-06-1972. [DOI] [PubMed] [Google Scholar]
- 12.Adams RJ, McKie VC, Hsu L, Files B, Vichinsky E, Pegelow C, Abboud M, Gallagher D, Kutlar A, Nichols FT, Bonds DR, Brambilla D. Prevention of a first stroke by transfusions in children with sickle cell anemia and abnormal results on transcranial Doppler ultrasonography. N Engl J Med. 1998;339:5–11. doi: 10.1056/NEJM199807023390102. [DOI] [PubMed] [Google Scholar]
- 13.Kwiatkowski JL, Yim E, Miller S, Adams RJ. Effect of transfusion therapy on transcranial doppler ultrasonography velocities in children with sickle cell disease. Pediatr Blood Cancer. 2010 doi: 10.1002/pbc.22951. [DOI] [PMC free article] [PubMed] [Google Scholar]
- 14.Kwiatkowski JL, Yim E, Miller S, Adams RJ. Effect of transfusion therapy on transcranial Doppler ultrasonography velocities in children with sickle cell disease. Pediatr Blood Cancer. 2011;56:777–82. doi: 10.1002/pbc.22951. [DOI] [PMC free article] [PubMed] [Google Scholar]
- 15.Reed WF, Vichinsky EP. Transfusion practice for patients with sickle cell disease. Curr Opin Hematol. 1999;6:432–6. doi: 10.1097/00062752-199911000-00014. [DOI] [PubMed] [Google Scholar]
- 16.Ohene-Frempong K, Weiner SJ, Sleeper LA, Miller ST, Embury S, Moohr JW, Wethers DL, Pegelow CH, Gill FM. Cerebrovascular accidents in sickle cell disease: rates and risk factors. Blood. 1998;91:288–94. [PubMed] [Google Scholar]
- 17.Russell MO, Goldberg HI, Reis L, Friedman S, Slater R, Reivich M, Schwartz E. Transfusion therapy for cerebrovascular abnormalities in sickle cell disease. J Pediatr. 1976;88:382–7. doi: 10.1016/s0022-3476(76)80251-x. [DOI] [PubMed] [Google Scholar]
- 18.Alexy T, Pais E, Armstrong JK, Meiselman HJ, Johnson CS, Fisher TC. Rheologic behavior of sickle and normal red blood cell mixtures in sickle plasma: implications for transfusion therapy. Transfusion. 2006;46:912–8. doi: 10.1111/j.1537-2995.2006.00823.x. [DOI] [PubMed] [Google Scholar]
- 19.Baskurt OgK. Handbook of hemorheology and hemodynamics. Amsterdam; Washington, DC: IOS Press; 2007. [Google Scholar]
- 20.Stuart J, Johnson CS. Rheology of the sickle cell disorders. Baillieres Clin Haematol. 1987;1:747–75. doi: 10.1016/s0950-3536(87)80023-9. [DOI] [PubMed] [Google Scholar]
- 21.Lester LA, Sodt PC, Hutcheon N, Arcilla RA. Cardiovascular effects of hypertransfusion therapy in children with sickle cell anemia. Pediatr Cardiol. 1990;11:131–7. doi: 10.1007/BF02238842. [DOI] [PubMed] [Google Scholar]
- 22.Lopez L, Colan SD, Frommelt PC, Ensing GJ, Kendall K, Younoszai AK, Lai WW, Geva T. Recommendations for quantification methods during the performance of a pediatric echocardiogram: a report from the Pediatric Measurements Writing Group of the American Society of Echocardiography Pediatric and Congenital Heart Disease Council. J Am Soc Echocardiogr. 2010;23:465–95. doi: 10.1016/j.echo.2010.03.019. quiz 576–7. [DOI] [PubMed] [Google Scholar]
- 23.Nagueh SF, Appleton CP, Gillebert TC, Marino PN, Oh JK, Smiseth OA, Waggoner AD, Flachskampf FA, Pellikka PA, Evangelisa A. Recommendations for the evaluation of left ventricular diastolic function by echocardiography. Eur J Echocardiogr. 2009;10:165–93. doi: 10.1093/ejechocard/jep007. [DOI] [PubMed] [Google Scholar]
- 24.Rudski LG, Lai WW, Afilalo J, Hua L, Handschumacher MD, Chandrasekaran K, Solomon SD, Louie EK, Schiller NB. Guidelines for the echocardiographic assessment of the right heart in adults: a report from the American Society of Echocardiography endorsed by the European Association of Echocardiography, a registered branch of the European Society of Cardiology, and the Canadian Society of Echocardiography. J Am Soc Echocardiogr. 2010;23:685–713. doi: 10.1016/j.echo.2010.05.010. quiz 86–8. [DOI] [PubMed] [Google Scholar]
- 25.Kircher BJ, Himelman RB, Schiller NB. Noninvasive estimation of right atrial pressure from the inspiratory collapse of the inferior vena cava. Am J Cardiol. 1990;66:493–6. doi: 10.1016/0002-9149(90)90711-9. [DOI] [PubMed] [Google Scholar]
- 26.Dahiya A, Vollbon W, Jellis C, Prior D, Wahi S, Marwick T. Echocardiographic assessment of raised pulmonary vascular resistance: application to diagnosis and follow-up of pulmonary hypertension. Heart. 2010;96:2005–9. doi: 10.1136/hrt.2010.204834. [DOI] [PubMed] [Google Scholar]
- 27.Mancini DM, Bolinger L, Li H, Kendrick K, Chance B, Wilson JR. Validation of near-infrared spectroscopy in humans. J Appl Physiol. 1994;77:2740–7. doi: 10.1152/jappl.1994.77.6.2740. [DOI] [PubMed] [Google Scholar]
- 28.Frenette PS, Atweh GF. Sickle cell disease: old discoveries, new concepts, and future promise. J Clin Invest. 2007;117:850–8. doi: 10.1172/JCI30920. [DOI] [PMC free article] [PubMed] [Google Scholar]
- 29.Hebbel RP, Eaton JW. Sickle cell disease: beyond the hemoglobin abnormality. Prog Clin Biol Res. 1982;97:341–9. [PubMed] [Google Scholar]
- 30.Kato GJ, Hebbel RP, Steinberg MH, Gladwin MT. Vasculopathy in sickle cell disease: Biology, pathophysiology, genetics, translational medicine, and new research directions. Am J Hematol. 2009;84:618–25. doi: 10.1002/ajh.21475. [DOI] [PMC free article] [PubMed] [Google Scholar]
- 31.Gupta R, Adekile AD. MRI follow-up and natural history of avascular necrosis of the femoral head in Kuwaiti children with sickle cell disease. J Pediatr Hematol Oncol. 2004;26:351–3. doi: 10.1097/00043426-200406000-00004. [DOI] [PubMed] [Google Scholar]
- 32.Gladwin MT, Schechter AN, Ognibene FP, Coles WA, Reiter CD, Schenke WH, Csako G, Waclawiw MA, Panza JA, Cannon RO., 3rd Divergent nitric oxide bioavailability in men and women with sickle cell disease. Circulation. 2003;107:271–8. doi: 10.1161/01.cir.0000044943.12533.a8. [DOI] [PubMed] [Google Scholar]
- 33.Byron JW. Effect of steroids on the cycling of haemopoietic stem cells. Nature. 1970;228:1204. doi: 10.1038/2281204a0. [DOI] [PubMed] [Google Scholar]
- 34.Gilligan DM, Badar DM, Panza JA, Quyyumi AA, Cannon RO., 3rd Acute vascular effects of estrogen in postmenopausal women. Circulation. 1994;90:786–91. doi: 10.1161/01.cir.90.2.786. [DOI] [PubMed] [Google Scholar]
- 35.Guetta V, Quyyumi AA, Prasad A, Panza JA, Waclawiw M, Cannon RO., 3rd The role of nitric oxide in coronary vascular effects of estrogen in postmenopausal women. Circulation. 1997;96:2795–801. doi: 10.1161/01.cir.96.9.2795. [DOI] [PubMed] [Google Scholar]
- 36.Manhem K, Brandin L, Ghanoum B, Rosengren A, Gustafsson H. Acute effects of transdermal estrogen on hemodynamic and vascular reactivity in elderly postmenopausal healthy women. J Hypertens. 2003;21:387–94. doi: 10.1097/00004872-200302000-00031. [DOI] [PubMed] [Google Scholar]
- 37.Sack MN, Rader DJ, Cannon RO., 3rd Oestrogen and inhibition of oxidation of low-density lipoproteins in postmenopausal women. Lancet. 1994;343:269–70. doi: 10.1016/s0140-6736(94)91117-7. [DOI] [PubMed] [Google Scholar]
- 38.Doctor A, Platt R, Sheram ML, Eischeid A, McMahon T, Maxey T, Doherty J, Axelrod M, Kline J, Gurka M, Gow A, Gaston B. Hemoglobin conformation couples erythrocyte S-nitrosothiol content to O2 gradients. Proc Natl Acad Sci U S A. 2005;102:5709–14. doi: 10.1073/pnas.0407490102. [DOI] [PMC free article] [PubMed] [Google Scholar]
- 39.Palmer LA, Doctor A, Gaston B. SNO-hemoglobin and hypoxic vasodilation. Nat Med. 2008;14:1009. doi: 10.1038/nm1008-1009a. author reply -10. [DOI] [PubMed] [Google Scholar]
- 40.Miller DM, Winslow RM, Klein HG, Wilson KC, Brown FL, Statham NJ. Improved exercise performance after exchange transfusion in subjects with sickle cell anemia. Blood. 1980;56:1127–31. [PubMed] [Google Scholar]
- 41.Chang SM, Lin CC, Hsiao SH, Lee CY, Yang SH, Lin SK, Huang WC. Pulmonary hypertension and left heart function: insights from tissue Doppler imaging and myocardial performance index. Echocardiography. 2007;24:366–73. doi: 10.1111/j.1540-8175.2007.00405.x. [DOI] [PubMed] [Google Scholar]
- 42.Dyer KL, Pauliks LB, Das B, Shandas R, Ivy D, Shaffer EM, Valdes-Cruz LM. Use of myocardial performance index in pediatric patients with idiopathic pulmonary arterial hypertension. J Am Soc Echocardiogr. 2006;19:21–7. doi: 10.1016/j.echo.2005.07.010. [DOI] [PMC free article] [PubMed] [Google Scholar]
- 43.Eidem BW, O’Leary PW, Tei C, Seward JB. Usefulness of the myocardial performance index for assessing right ventricular function in congenital heart disease. Am J Cardiol. 2000;86:654–8. doi: 10.1016/s0002-9149(00)01047-x. [DOI] [PubMed] [Google Scholar]
- 44.Ishii M, Eto G, Tei C, Tsutsumi T, Hashino K, Sugahara Y, Himeno W, Muta H, Furui J, Akagi T, Fukiyama R, Toyoda O, Kato H. Quantitation of the global right ventricular function in children with normal heart and congenital heart disease: a right ventricular myocardial performance index. Pediatr Cardiol. 2000;21:416–21. doi: 10.1007/s002460010100. [DOI] [PubMed] [Google Scholar]
- 45.Tei C, Ling LH, Hodge DO, Bailey KR, Oh JK, Rodeheffer RJ, Tajik AJ, Seward JB. New index of combined systolic and diastolic myocardial performance: a simple and reproducible measure of cardiac function--a study in normals and dilated cardiomyopathy. J Cardiol. 1995;26:357–66. [PubMed] [Google Scholar]
- 46.Hayward CS, Kalnins WV, Kelly RP. Gender-related differences in left ventricular chamber function. Cardiovasc Res. 2001;49:340–50. doi: 10.1016/s0008-6363(00)00280-7. [DOI] [PubMed] [Google Scholar]
- 47.Kimmelstiel CD, Konstam MA. Heart failure in women. Cardiology. 1995;86:304–9. doi: 10.1159/000176894. [DOI] [PubMed] [Google Scholar]