

Abstract
The structural integrity of the Golgi complex is essential to its functions in the maturation, sorting, and transport of plasma membrane proteins. Previously, we demonstrated that in pancreatic duct CFPAC-1 cells, which express δF508 CFTR (cystic fibrosis transmembrane conductance regulator), the intracellular trafficking of carbonic anhydrase IV (CA IV), a membrane protein involved in HCO3 − secretion, was impaired. To determine whether these abnormalities were related to changes in the Golgi complex, we examined the ultrastructure and distribution of Golgi compartments with regard to the microtubule cytoskeleton in CFPAC-1 cells transfected or not with the wild-type CFTR. Ultrastructural and immunocytochemical analysis showed that in polarized CFPAC-1 cells, Golgi stacks were disconnected from one another and scattered throughout the cytoplasm. The colocalization of CA IV with markers of Golgi compartments indicated the ability of stacks to transfer this enzyme. This Golgi dispersal was associated with abnormal microtubule distribution and multiplicity of the microtubule-organizing centers (MTOCs). In reverted cells, the normalization of Golgi structure, microtubule distribution, and MTOC number was observed. These observations suggest that the entire biosynthetic/secretory pathway is disrupted in CFPAC-1 cells, which might explain the abnormal intracellular transport of CA IV. Taken together, these results point to the fact that the expression of δF508 CFTR affects the integrity of the secretory pathway.
Keywords: cystic fibrosis, Golgi complex, microtubules, protein trafficking, carbonic anhydrase IV, HCO3- secretion, pancreas, human
Cystic fibrosis (CF), the most common lethal inherited disease among Caucasians, is caused by mutations in the gene encoding the cystic fibrosis transmembrane conductance regulator (CFTR). CFTR is a cAMP-activated low-conductance chloride channel localized in the apical plasma membrane of secretory epithelial cells (Crawford et al. 1991). The most frequent mutation in the CFTR protein is a deletion of the phenylalanine at position 508 (δF508). This mutation belongs to a class of mutation in which CFTR protein fails to be properly processed and trafficked to plasma membrane (Cheng et al. 1990; Kartner et al. 1992). δF508 CFTR is retained in the endoplasmic reticulum–Golgi intermediate compartment (ERGIC) (Gilbert et al. 1998), then degraded by the ubiquitin-proteasome pathway (Jensen et al. 1995). The severe reduction or absence of CFTR in the apical plasma membrane of epithelial cells impairs several intracellular processes, including ionic exchange, in particular with enhanced Na+ absorption (Boucher et al. 1988) and reduced HCO3 − secretion in the intestine (Pratha et al. 2000) and pancreas (Kopelman et al. 1988; Smith and Welsh 1992; Lebenthal et al. 1993; Choi et al. 2001). Various studies using CF cells have demonstrated changes in the expression and/or intracellular trafficking of secreted or membrane proteins, including MRP8 and MRP14 (migration inhibitory factor-related proteins) (Fanjul et al. 1995), the Na+/H+ exchanger (NHE3) (Ahn et al. 2001), Cl−/HCO3 − exchangers, such as the downregulated in adenoma (DRA) or the putative anion transporter (PAT1) (Greeley et al. 2001), and the carbonic anhydrase IV (CA IV) (Fanjul et al. 2002). Regarding CA IV, usually transported to plasma membranes via the Golgi complex (Mairal et al. 1996), we showed a large reduction in its expression in the apical plasma membrane of human CF pancreatic duct cells (CFPAC-1 line), suggesting abnormalities in its intracellular trafficking (Fanjul et al. 2002).
The Golgi complex plays an important role in the maturation, sorting, and transport of newly synthesized secreted lysosomal and plasma membrane proteins. In mammalian cells, this organelle is built up of stacks of flattened cisternae grouped together in the pericentrosomal region. Adjacent stacks are connected to each other by lateral tubules, forming a continuous ribbon-like structure (Rambourg and Clermont 1990). Each stack has a polarized structure and may be considered to be composed of at least three compartments: the cis-Golgi network (CGN)/cis-Golgi, the medial-Golgi cisternae, and the trans-Golgi/trans-Golgi network (TGN). The CGN/cis-Golgi, which receives newly synthesized proteins from the ERGIC, is where the first Golgi-specific glycosylation reactions occur. Each medial-Golgi cisterna contains specific enzymes that sequentially act to allow the addition or trimming of carbohydrate moieties. The trans-Golgi/TGN ensures the final glycosylation reactions and the sorting of proteins to the plasma membrane and lysosomes. The structural integrity of the Golgi complex is indispensable in the accurate sorting and transport of proteins to their final destination. Thus, during mitosis, the Golgi complex breaks down into small vesicles and the protein transport along the secretory pathway is arrested (Lowe et al. 1998; Thyberg and Moskalewski 1998). Various drugs, such as brefeldin A and okadaic acid, have a profound effect on the integrity of Golgi stacks, causing perturbations in protein maturation, sorting, and trafficking (Fujiwara et al. 1988; Lucocq et al. 1991; Tamaki and Yamashina 2002). Microtubule-disrupting agents, such as nocodazole, also induce dispersal of Golgi stacks (Rogalski and Singer 1984; Thyberg and Moskalewski 1985; Cole et al. 1996), often leading to a retardation in the transport of secreted and plasma membrane proteins (Matter et al. 1990; Robin et al. 1995; Cole et al. 1996).
To determine whether the perturbations of CA IV traffic observed in CF cells result from changes in the Golgi complex, we analyzed the structure and distribution of this organelle with regard to the microtubule network in the pancreatic duct cell line CFPAC-1. We found a dispersal of Golgi stacks associated with disorganization of the microtubule cytoskeleton and an increase in the number of microtubule-organizing centers (MTOCs). Moreover, the reversion of CF cells by the wild-type CFTR led to the restoration of Golgi complex and microtubule distribution that allowed the correct trafficking of CA IV.
Materials and Methods
Cell Lines
We conducted this study using the cancerous human pancreatic duct cell lines CFPAC-1, CFPAC-PLJ-CFTR6, and CFPAC-PLJ6. The CFPAC-1 cell line was established from a hepatic metastasis in a 26-year-old Caucasian male bearing a pancreatic adenocarcinoma and with CF (homozygote δF508) (Schoumacher et al. 1990). The CFPAC-PLJ-CFTR6 and CFPAC-PLJ6 cell lines correspond to the CFPAC-1 cell line transfected, respectively, with the PLJ vector containing the wild-type CFTR and the mock vector (Drumm et al. 1990).
Antibodies
Tight junctions were visualized using rabbit polyclonal antiserum against occludin from Zymed Laboratories (San Francisco, CA). To visualize membrane compartments, we used mouse monoclonal antibody against ERGIC-53 protein, kindly provided by Dr. Hans-Peter Hauri (Department of Pharmacology, Biocenter of the University Basel, Basel, Switzerland), mouse monoclonal antibody to 58K protein (clone 58K-9) from Sigma (St Louis, MO), and mouse monoclonal antibody to γ-adaptin (clone 88) from Transduction Laboratories (Lexington, KY). Anti-α-tubulin (clone DM1A) and anti-γ-tubulin (clone GTU-88) monoclonal antibodies were purchased from Sigma. The rabbit polyclonal antiserum raised against the COOH terminal of human CA IV has been previously described (Fanjul et al. 2004). FITC-labeled goat anti-rabbit IgG antibodies and TRICT-labeled goat anti-mouse IgG antibodies were from Nordic Laboratories (Tilburg, The Netherlands).
Cell Culture and Growth Assay
The CFPAC-1, CFPAC-PLJ-CFTR6, and CFPAC-PLJ6 cell lines were maintained in Iscove's modified Dulbecco's medium containing 10% fetal calf serum (Gibco BRL; Grand Island, NY), without antibiotics, except G418 (1 mg/ml) (Sigma) for the transfected lines (CFPAC-PLJ-CFTR6 and CFPAC-PLJ6). Cell cultures were maintained by successive passages using trypsin (0.05%)-EDTA (0.02%) (Gibco BRL) and were seeded at a concentration of 2 × 10⁵ cells/ml in 25-cm2 flasks (Nunc; Roskilde, Denmark) and on glass coverslips coated with collagen I prepared from rat tail. Mycoplasma contamination was checked regularly using cultures in selective media and PCR (Mycoplasma PCR Primer Set; Stratagene, La Jolla, CA).
For growth assays, cells were seeded in Petri dishes at 1.7 × 10⁵ cells/ml. Media was changed daily. Cell proliferation was measured every day (day 1 to day 7) by counting cells with a Malassez hemocytometer (Marienfeld Laboratory Glassware; Lauda-Koenigshofen, Germany). Mitotic index was estimated on 4-day-old cultures fixed with Bouin's solution (Sigma) and stained with hemalum-eosin. For each cell line, the mitotic index was calculated on three 1,000-cell samples from three separate experiments. The percentage of multipolar mitoses (number of multipolar mitoses/total number of cells) was also established.
Osmium Impregnation
Golgi complexes were visualized by light microscopy after osmium impregnation. Cells grown for 4 days were rinsed with phosphate buffered saline (PBS), then fixed in situ (24 hr; +4C) with Champy's mixture: osmium tetroxide (1%)-chromic acid (1%)-potassium dichromate (3%). After several rinses with distilled water, cells were treated with 1% osmium tetroxide for 7 days at +37C, then dehydrated and mounted with Depex mounting medium (EMS; Fort Washington, PA).
Transmission Electron Microscopy
To determine the ultrastructure of the Golgi complex, cells were fixed with glutaraldehyde (2.5%)-paraformaldehyde (2%) in cacodylate buffer (0.1 M; pH 7.2) for 1 hr at +4C, postfixed with 1% osmium tetroxide (45 min; +4C), dehydrated, and embedded in epon-araldite resin. Ultra-thin sections were stained with uranyl acetate and lead citrate, then observed in a Hitachi H600 electron microscope (Hitachi; Tokyo, Japan).
Staining with Fluorescent Dyes
Mitochondria were labeled using the MitoTracker Red CMXRos probe (Molecular Probes, Inc.; Eugene, OR). Briefly, 4-day-old cultures were incubated with 1 nM MitoTracker Red CMXRos in culture medium for 1 hr at 37C. Cells were then washed and fixed with paraformaldehyde (3%; 20 min). Samples were examined using a confocal laser microscope (LSM 410; Carl Zeiss, Iena, Germany) with helium laser excitation (543 nm).
Immunofluorescence
Immunofluorescence reactions were carried out on cells maintained for 4–6 days on glass coverslips coated with collagen I.
Tight Junctions
To check the polarized state of CFPAC-1, CFPAC-PLJ-CFTR6, and CFPAC-PLJ6 cells, tight junctions were revealed using antibody to occludin. Cells were fixed in a 95% methanol/5% acetic acid mixture for 10 min at –20C. After rinsing and blocking nonspecific antibody binding sites with 1% bovine serum albumin (BSA) in PBS, cells were incubated successively with polyclonal rabbit immune serum directed against occludin (1:50; 1 hr) in PBS:BSA followed by goat anti-rabbit IgG serum coupled with FITC (1:400; 45 min).
Golgi Compartments
CFPAC-1, CFPAC-PLJ-CFTR6, and mock cells were fixed in paraformaldehyde (3%; 20 min; +4C), then permeabilized in baths with increasing concentrations of alcohol. After rinsing and blocking of nonspecific antibody binding sites in PBS:BSA, cells were incubated overnight at +4C, either with the mouse monoclonal antibody to ERGIC-53 (1:800), the mouse monoclonal antibody to 58K protein (1:50), or the mouse monoclonal antibody to γ-adaptin (1:50), diluted in PBS:BSA. After rinsing, cells were incubated with TRITC-labeled goat anti-mouse IgG antibodies (1:100; 45 min). The distribution of Golgi compartments was also analyzed in cells treated with nocodazole, a microtubule-disrupting agent. Four-day-old cell cultures were treated for 2 hr with nocodazole (50 μM) dissolved in DMSO, or with DMSO (5 μl/ml) for controls. After rinsing, they were fixed, permeabilized, and processed for immunofluorescence staining with antibody to the 58K protein as described above.
CA IV
To detect CA IV in the various membrane compartments, double-labeling reactions of CA IV/ERGIC-53, CA IV/58K protein, and CA IV/γ-adaptin were performed. Briefly, cells were fixed in paraformaldehyde (PFA) (3%; 20 min), permeabilized in baths with increasing concentrations of alcohol, and then incubated, first with the rabbit polyclonal CA IV immune serum (1:100), then with mouse monoclonal antibody directed against ERGIC-53 (1:800), 58K protein (1:50) or γ-adaptin (1:50). The antigen-antibody complexes were revealed after incubation with anti-rabbit IgG coupled with FITC (1:200) and with anti-mouse IgG coupled with TRITC (1:100).
Microtubules
The microtubule cytoskeleton was visualized using antibody to α-tubulin. Cells fixed in PFA (3%, 30 min) and permeabilized in baths with increasing concentrations of alcohol were incubated with mouse monoclonal anti-α-tubulin antibody (1:50). The antigen-antibody complexes were revealed after incubation with anti-mouse IgG coupled with TRITC (1:100). Some reactions were also performed on cells previously treated with nocodazole to check for microtubule depolymerization.
MTOCs were detected using mouse monoclonal antibody to γ-tubulin (1:50) according to the method described above for the detection of α-tubulin.
Controls
The specificity of the immunocytochemical reactions was determined by incubating cells solely with the anti-rabbit IgG coupled with FITC or anti-mouse IgG coupled with TRITC.
Immunofluorescence samples were mounted in Fluorostab medium (ICN Biomedicals; Aurora, OH) and examined by confocal microscopy with an argon laser (488 nm) for FITC excitation and a helium laser (543 nm) for TRITC excitation. Serial optical sections were collected in the Z axis at 1-μm intervals.
Results
Growth of CFPAC-1 and CFPAC-PLJ-CFTR6 Cells
CFPAC-1 and CFPAC-PLJ-CFTR6 cells displayed differences in their morphology and their growth in culture. In both lines, confluence was reached by day 5 and dome-like structures were observed. CFPAC-1 cells exhibited heterogeneous morphology. Two types of cells were observed: (a) epithelial cells (the majority) with an average diameter of 29 μm; and (b) fibroblast-like cells grouped in rows. On average, the latter measured 57 γm in length and 12 γm in width. In the CFPAC-PLJ-CFTR6 line, whole cells exhibited epithelial morphology, with a diameter ranging from 10 γm to 21 γm. For both cell lines, occludin immunoreactivity was seen as a border around the cells in the apical regions (Figures 1a and 1b), confirming the polarized state. CFPAC-1 and CFPAC-PLJ-CFTR6 cells, plated at a concentration of 1.7 × 10⁵ cells/ml, both presented a doubling time of 18 hr. However, cell density on day 7 differs between the two cell lines: 3.4 × 10⁶ cells/ml for CFPAC-1 and 6 × 10⁶ cells/ml for CFPAC-PLJ-CFTR6 cells. By day 4, the mitotic index was not significantly different between CFPAC-1 (4.8%) and CFPAC-PLJ-CFTR6 (4.6%) cells. The rate of multipolar mitosis, producing up to 4 mitotic spindles, was similar in both CFPAC-1 (0.24%) and CFPAC-PLJ-CFTR6 (0.29%) cells.
Figure 1.
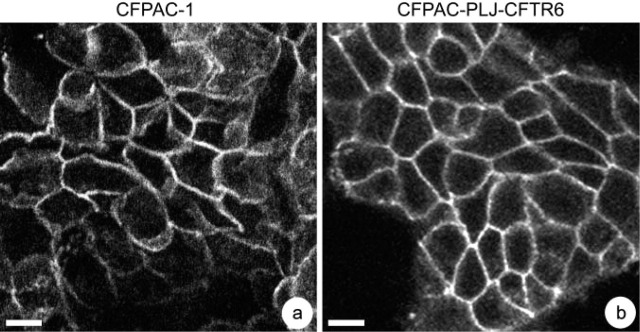
Demonstration of the polarized state of CFPAC-1 (a) and CFPAC-PLJ-CFTR6 (b) cells by revealing the tight junction using anti-occludin antibodies. Focal planes passing through the apical regions of cells show the presence of an occludin-immunoreactive border around all the cells. Bars: a = 20 γm; b =10 μm.
The morphology and growth of the CFPAC-PLJ6 cells were comparable to those observed on the CFPAC-1 cells.
Distribution of Golgi Complex
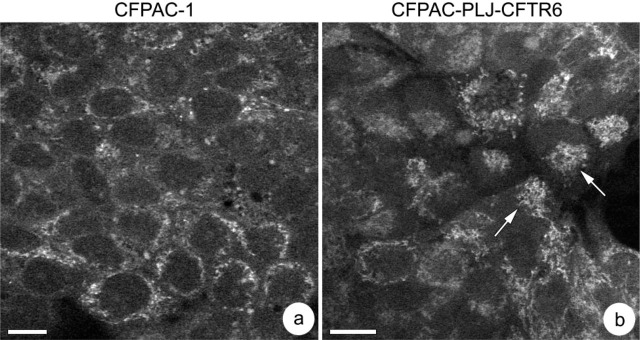
The different methods used to visualize the Golgi complex showed variations in its distribution and ultrastructure when compared in CFPAC-1 and CFPAC-PLJ-CFTR6 cells. In polarized CFPAC-1 cells, osmium impregnation revealed a large number of Golgi stacks dispersed throughout the cytoplasm (Figure 2a 1). Each Golgi stack contained chromophilic (Figure 2a 2, arrow) and chromophobic (Figure 2a 2, arrowhead) regions corresponding to the cis and trans faces, respectively. They often appeared in groups of two or three (Figure 2a 1, arrows). Electron microscopic examination confirmed this dispersed stack distribution. Figure 2b shows a polarized CFPAC-1 cell containing many small Golgi stacks disconnected from one another and scattered throughout the cytoplasm (Figure 2b, arrows). These stacks were unusual in that they were formed by dilated cisternae, often highly vesiculated (Figure 2c). In polarized CFPAC-PLJ-CFTR6 cells, Golgi stacks revealed by osmium impregnation were mostly grouped in the supranuclear cytoplasm (Figure 2d, arrows). Ultrastructural analysis showed a well-organized Golgi complex composed of large stacks with flattened cisternae (Figure 2e). Confocal microscopic examination of the immunocytochemical reactions using anti-58K protein antibodies demonstrated the presence of numerous Golgi stacks dispersed throughout the cytoplasm in polarized CFPAC-1 cells: (a) in focal planes passing through the bases of cells, few Golgi stacks were present (Figure 3a 1); (b) in medial planes, a large number of stacks either isolated, or in small clusters (Figures 3a 2 and 3a 3, arrows) appeared throughout the cytoplasm; and (c) in supranuclear planes, there were very few or none at all (Figure 3a 4). In polarized CFPAC-PLJ-CFTR6 cells, the distribution of Golgi stacks was different: they were absent in the basal cytoplasm (Figure 3b 1), few in number in the medial cytoplasmic regions (Figure 3b 2), and numerous and grouped in clusters in the supranuclear regions (Figures 3b 3 and 3b 4, arrows). We determined the number of cells presenting dispersed, partially dispersed, or clustered Golgi stacks using immunofluorescence images of different planes taken along the entire height of cells. For each cell line, we carried out counts of more than 200 cells per preparation (n=5). Statistical analyses of these data were performed using the non-parametric Mann-Whitney test. In the CFPAC-1 line, 90.1 ± 1.5% of the cells exhibited a dispersed and 4.1 ± 0.6% a clustered Golgi complex vs 12.4 ± 2.5% and 73.5 ± 4.1% in the CFPAC-PLJ-CFTR6 cell line (p<0.0001). A partially dispersed Golgi complex was observed in 5.7 ± 1.1% of CFPAC-1 cells and 14 ± 3% of CFPAC-PLJ-CFTR6 cells.
Figure 2.
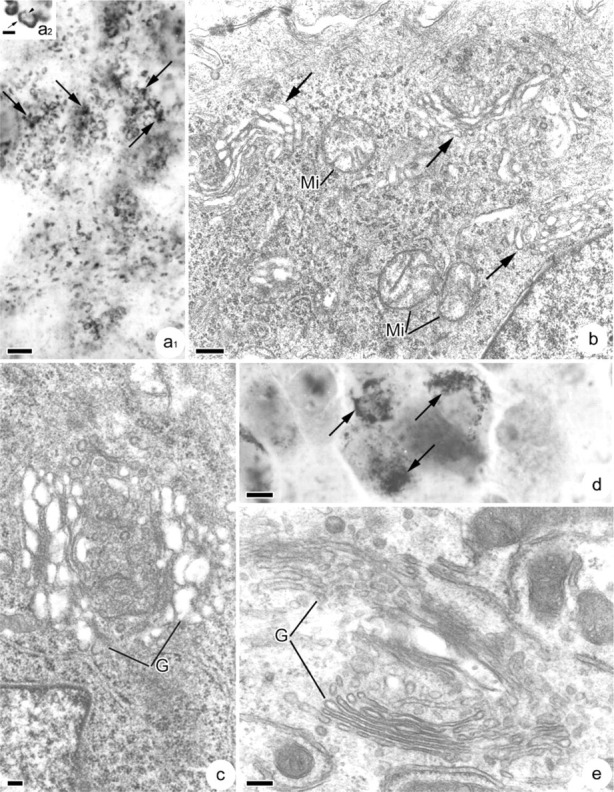
Characteristics of the Golgi complex in CFPAC-1 (a–c) and CFPAC-PLJ-CFTR6 (d,e) cells. (a1) Dispersal of the Golgi complex revealed by osmium impregnation. The arrows indicate the presence of associations between different Golgi stacks. Bar = 5 μm. (a2) High magnification showing the chromophilic (arrow) and chromophobic (arrowhead) faces of a Golgi stack revealed by osmium impregnation. Bar = 1 μm. (b) Electron microscopic image showing the presence of numerous Golgi stacks, scattered in the perinuclear cytoplasm (arrows). Mi, mitochondria. Bar = 300 nm. (c) Detail of the structure of a Golgi stack (G). Note the strong dilation and vesiculation of Golgi cisternae. Bar = 100 nm. (d) Golgi stacks grouped in the supranuclear regions (arrows) and revealed by osmium impregnation. Bar = 5 γm. (e) Detail of Golgi stacks (G) with numerous flattened cisternae. Bar = 300 nm.
Figure 3.
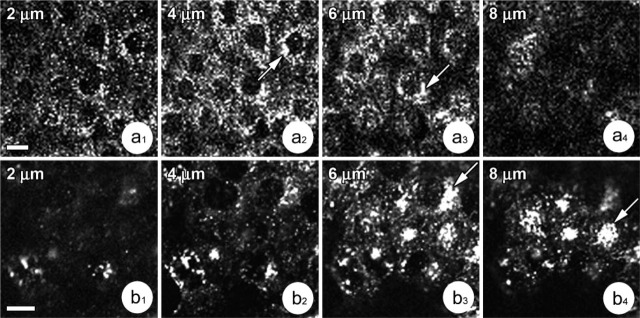
Distribution of the Golgi complex in polarized CFPAC-1 and CFPAC-PLJ-CFTR6 cells. Immunofluorescence using anti-58K protein antibody. (a1–a4) Focal series (2–8 γm from the base of the cells) showing the distribution of Golgi elements throughout the entire height of CFPAC-1 cells. Note the larger number and their scattering in the medial cytoplasm (planes, 4–6 μm). (b1–b4) Focal series (2–8 μm from the base of the cells) showing Golgi elements mainly clustered in a perinuclear or supranuclear region (planes, 6–8 μm, arrows) in CFPAC-PLJ-CFTR6 cells. Bars = 20 μm.
Our investigation of the Golgi complex was complemented by determining the distribution of the ERGIC and TGN. In polarized CFPAC-1 cells, ERGIC-53 and γ-adaptin immunoreactivity had the same distribution as that for 58K protein. Figures 4a and 4b show the dispersal in the perinuclear cytoplasm of the ERGIC and TGN, respectively. In polarized CFPAC-PLJ-CFTR6 cells, these compartments were clustered in a perinuclear or supranuclear cytoplasmic region (Figures 4c and 4d, arrows).
Figure 4.
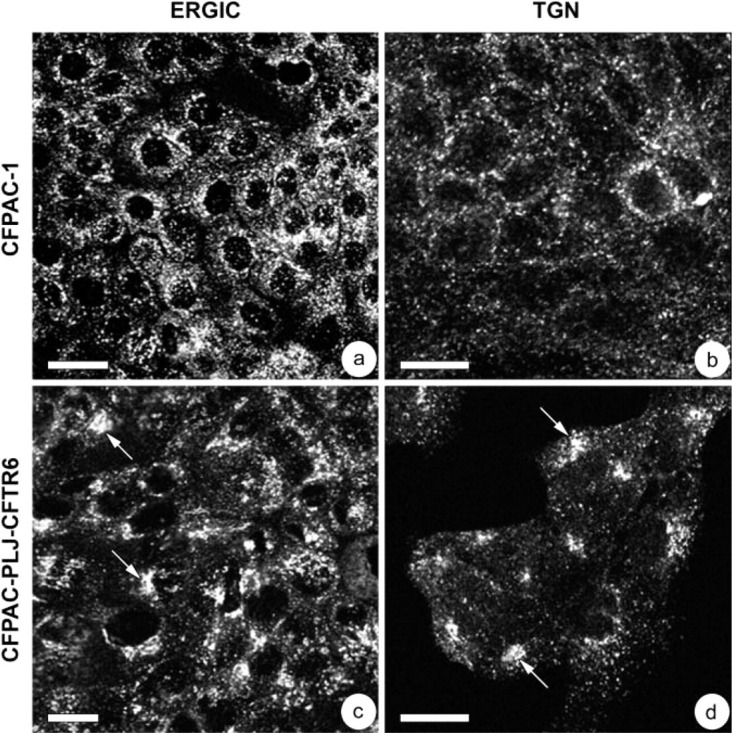
Distribution of the endoplasmic reticulum-Golgi intermediate compartment (ERGIC) (a,c) and trans-Golgi network (TGN) (b,d) in CFPAC-1 (a,b) and CFPAC-PLJ-CFTR6 (c,d) cells. Immunofluorescence using anti-ERGIC-53 (a,c) and anti-γ-adaptin (b,d) antibody. The ERGIC and TGN appeared dispersed throughout all the cytoplasm of CFPAC-1 cells (a,b), whereas they were clustered in supranuclear regions in CFPAC-PLJ-CFTR6 cells (c,d, arrows). Bars: a,c = 20 μm; b,d = 10 μm.
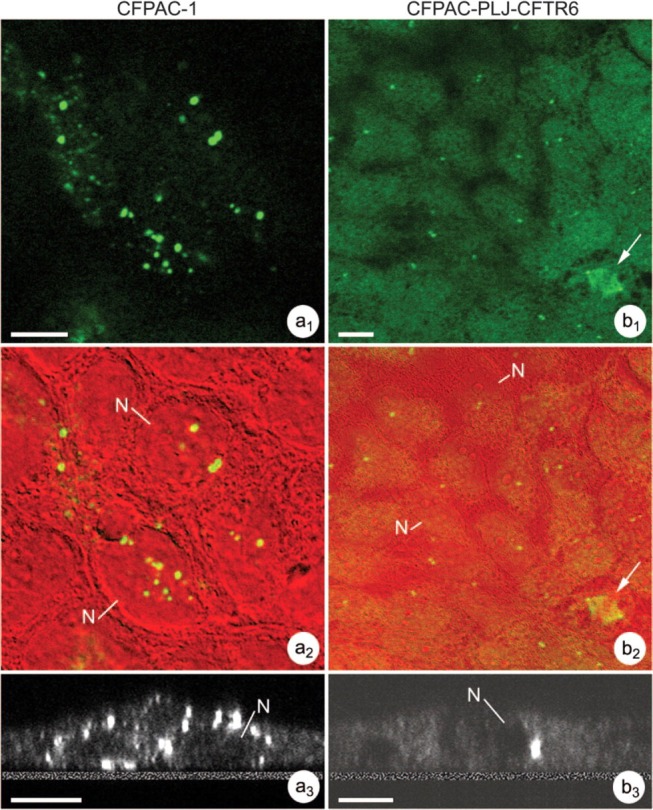
We used double labeling to localize CA IV in the different Golgi compartments. A dispersal of CA IV immunoreactivity (Figure 5a) similar to that for 58K protein (Figure 5b) was observed in polarized CFPAC-1 cells. Superimposing these two images showed that CA IV was clearly localized at the Golgi complex (Figure 5c). In polarized CFPAC-PLJ-CFTR6 cells, double labeling for CA IV (Figure 5d) and 58K protein (Figure 5e) indicated their colocalization in the supranuclear cytoplasm (Figure 5f). We also observed the colocalization of CA IV with ERGIC-53 and γ-adaptin in the two cell lines.
Figure 5.

Demonstration of CA IV in the Golgi complex of CFPAC-1 (a–c) and CFPAC-PLJ-CFTR6 (d–f) cells. CA IV/58K protein double labeling. (a,d) CA IV immunoreactivity. (b,e) 58K protein immunoreactivity. (c,f) Superimposition of 58K protein and CA IV immunoreactivity, showing their colocalization. Bars = 10 μm.
In CFPAC-PLJ6 cells, we obtained results identical to those for CFPAC-1 cells.
Microtubules and the Golgi Complex
Confocal microscopic examination of α-tubulin immunoreactivity showed differences in the distribution of microtubules between CFPAC-1 and CFPAC-PLJ-CFTR6 cells. In polarized CFPAC-1 cells, focal planes passing through the basal and medial cytoplasms displayed a network of dispersed microtubules that extended from the perinuclear regions to the periphery of cells (Figure 6a 1). In polarized CFPAC-PLJ-CFTR6 cells, focal planes passing through the medial cytoplasms showed α-tubulin immunoreactivity located along lateral plasma membranes (Figure 6b 1). In supranuclear cytoplasms of CFPAC-1 cells, α-tubulin immunoreactivity appeared as a network of dispersed filaments radiating from different focal points (Figure 6a 2), whereas in CFPAC-PLJ-CFTR6 cells it appeared in the form of a dense, tangled, filamentous network (Figure 6b 2). The addition of nocodazole to CFPAC-1 and CFPAC-PLJ-CFTR6 cell cultures resulted in complete microtubule depolymerization. The detection of the Golgi complex with anti-58K protein antibody revealed in CFPAC-1 cells treated with nocodazole a larger dispersal of Golgi elements (Figures 7a 1 and 7a2) than in control cells, in which the Golgi elements often appeared in small clusters (Figures 7b 1 and 7b2, arrows). The treatment of polarized CFPAC-PLJ-CFTR6 cells with nocodazole led to a dispersal of the Golgi complex (Figures 7c 1 and 7c2) comparable to that obtained in treated CFPAC-1 cells. In untreated CFPAC-PLJ-CFTR6 cells, Golgi components were clustered in the supranuclear cytoplasm (Figures 7d 1 and 7d 2, arrows).
Figure 6.

Distribution of microtubules in CFPAC-1 (a1,a2) and CFPAC-PLJ-CFTR6 (b1,b2) cells. (a1,a2) Focal planes showing the dispersion of microtubules throughout medial (plane, 4 μm) and supranuclear (plane, 6 μm) cytoplasms of CFPAC-1 cells. Bar = 20 μm. (b1,b2) Focal planes showing the presence of microtubules along the lateral membranes (plane, 4 μm) and their clustering in supranuclear cytoplasms (plane, 6 μm) of CFPAC-PLJ-CFTR6 cells. Bar = 20 μm.
Figure 7.
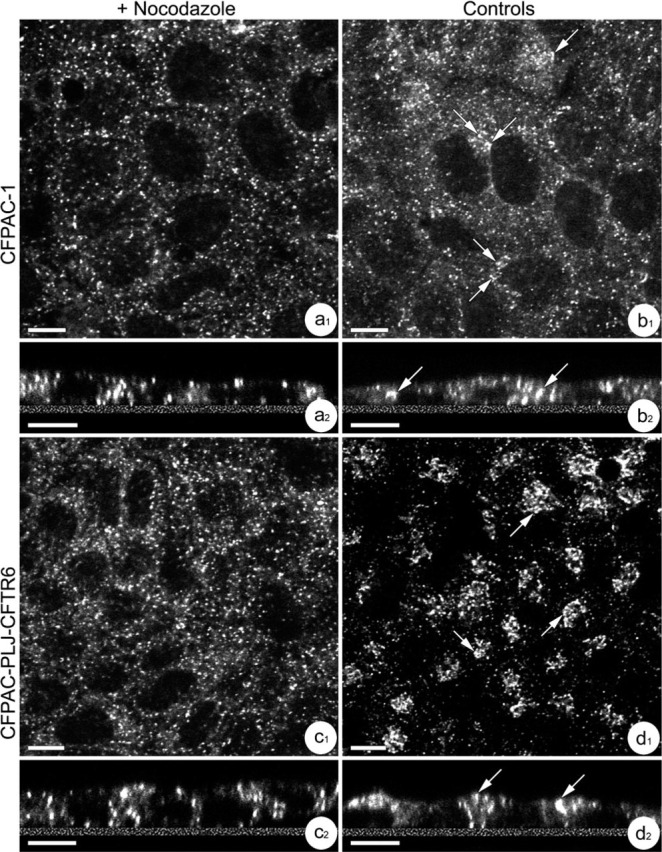
Effect of nocodazole on the distribution of Golgi complex revealed with anti-58K antibody in CFPAC-1 and CFPAC-PLJ-CFTR6 cells. (a1,a2,b1,b2) Distribution of the Golgi complex in nocodazole-treated (a1,a2) or untreated (b1,b2) CFPAC-1 cells. Note the homogeneous distribution of Golgi elements in the perinuclear cytoplasm observed from X-Y (a1) and X-Z (a2) optical sections. In untreated cells, observe the presence of some associations between Golgi elements in the perinuclear cytoplasms (b1,b2, arrows). Bars: = 10 μm. (c1,c2,d1,d2) Distribution of the Golgi complex in nocodazole-treated (c1,c2) or untreated (d1,d2) CFPAC-PLJ-CFTR6 cells. Note: (a) the homogeneous distribution of Golgi elements throughout the cytoplasm of the treated cells observed from X-Y (c1) and X-Z (c2) optical sections; and (b) the clustering of Golgi stacks (arrows) in the supranuclear cytoplasm of untreated cells from X-Y (d1) and X-Z (d2) sections. Bars = 10 μm.
To complete the analysis of microtubule cytoskeleton in CFPAC-1 and reverted cells, MTOCs were detected using anti-γ-tubulin antibody (Figure 8). In both cell lines, we observed γ-tubulin immunoreactivity in the form of spots corresponding to MTOCs. Their number was higher in the CFPAC-1 cells than in the CFPAC-PLJ-CFTR6 cells. Superimposition of the images of γ-tubulin immunoreactivity in CFPAC-1 (Figure 8a 1) and CFPAC-PLJ-CFTR6 (Figure 8b 1) cells onto those of the same fields observed by interference microscopy (Figures 8a 2 and 8b2) enabled the quantification of MTOCs per cell. Examination of images from X-Y and X-Z optical sections demonstrated: (a) several MTOCs per cell and their distribution throughout the cytoplasm in the CFPAC-1 line (Figures 8a 1–8a3); and (b) the presence of only one MTOC per cell localized near the nucleus in polarized CFPAC-PLJ-CFTR6 cells (Figures 8b 1–8b3). We determined the percentage of cells with more than three MTOCs from images of different planes taken along the entire height of the cells. For each cell line, more than 200 cells per preparation (n=3) were counted. In the CFPAC-PLJ-CFTR6 line, ∼12.5 ± 3.1% of the cells contained between 3 and 8 MTOCs, whereas in the CFPAC-1 line, 63.1 ± 12.4% of the cells contained an abnormally elevated number of MTOCs (between 3 and 107 MTOCs per cell).
Figure 8.
Microtubule-organizing centers (MTOCs) revealed with anti-γ-tubulin antibody in CFPAC-1 cells (a1–a3) compared with CFPAC-PLJ-CFTR6 (b1–b3) cells. (a1–a3) Immunofluorescence reaction revealing numerous MTOCs per cell in the CFPAC-1 line, as shown: (a) by the superimposition of the fluorescence image (a1) on that of the same field taken by interference microscopy (a2); (b) in X-Z optical section (a3). Bars = 5 μm. (b1–b3) Immunofluorescence reaction revealing one MTOC per cell in the CFPAC-PLJ-CFTR6 line, as shown: (a) by the superimposition of the fluorescence image (b1) on that of the same field taken by interference microscopy (b2); and (b) in X-Z optical section (b3). Note the presence of 2 centrosomes in a mitotic cell (b1,b2,arrows). N, nucleus. Bars = 5 μm.
Distribution of Mitochondria
To investigate whether the distribution of other organelles was disrupted in CFPAC-1 cells, mitochondria were visualized using a specific fluorescent probe. Examination showed that the mitochondria in CFPAC-1 cells are distributed throughout the cytoplasm, with a higher density around the nucleus (Figure 9a). In contrast, in reverted cells, they are clustered in a single perinuclear or supranuclear area (Figure 9b, arrows) and are relatively sparse elsewhere in the cytoplasm.
Figure 9.
Distribution of mitochondria in CFPAC-1 (a) and CFPAC-PLJ-CFTR6 (b) cells. Mitochondria are dispersed throughout the entire cytoplasm in CFPAC-1, whereas they are clustered in a perinuclear or supranuclear region (arrows) in reverted cells. Bars = 10 μm.
Discussion
In this study, we show a dispersal of the Golgi complex associated with changes in the distribution of microtubules and an increase in the number of MTOCs in CF pancreatic duct cells, causing perturbations in the classic biosynthetic/secretory pathway.
The human CF pancreatic duct cells of the CFPAC-1 line have been described as polarized cells (Schoumacher et al. 1990; Fanjul et al. 2002) in which ΔF508 CFTR is not targeted to the plasma membrane (Demolombe et al. 1994; Bannykh et al. 2000; Fanjul et al. 2002). In a recent study, we demonstrated perturbations in the intracellular trafficking of CA IV in CFPAC-1 cells (Fanjul et al. 2002). CA IV is thought to play a role in the pancreatic HCO3 − secretion (Mahieu et al. 1994; Ishiguro et al. 1996; Fanjul et al. 2004), a mechanism impaired in CF (Kopelman et al. 1988; Smith and Welsh 1992; Lebenthal et al. 1993; Choi et al. 2001). CA IV is localized in the luminal membrane of normal human pancreatic duct cells (Fanjul et al. 2004) and is trafficked via the Golgi complex (Mairal et al. 1996). Generally, the intracellular trafficking of plasma membrane proteins involves spatial organization and continuity of rough endoplasmic reticulum, ERGIC, and Golgi compartments. In the first part of this work, we analyzed the integrity of the biosynthetic/secretory pathway in polarized CFPAC-1 cells and in the same cells transfected with the wild-type CFTR. Our different analyses demonstrated the dispersal of the Golgi complex associated with dilation and vesiculation of cisternae in CFPAC-1 cells. Structural changes of the Golgi complex have previously been described under various physiological, pathological, and experimental conditions. This is most notably the case in cells undergoing mitosis, in which Golgi stacks are broken down into tubulovesicular clusters (Lowe et al. 1998; Thyberg and Moskalewski 1998). In CFPAC-1 cells, the dispersal of Golgi elements does not concern exclusively cells undergoing mitosis, given that the mitotic index did not surpass 5%, whereas ∼90% of the cells displayed changes in Golgi complex distribution. Moreover, contrary to what occurs in mitotic cells, the integrity of Golgi stacks in CFPAC-1 cells was maintained, as demonstrated by electron microscopy. These structural changes with preservation of the Golgi stacks are similar to those described in human cells subjected to intracellular pH changes, such as those in colorectal cancer (Kellokumpu et al. 2002) or hepatoma (Yoshida et al. 1999). Further experiments are nevertheless necessary to establish whether disorganization of the Golgi complex in CF cells—in which changes in intracellular pH have been observed (Barasch et al. 1991; Elgavish 1991; Coakley et al. 2000)—are actually due to alterations in intracellular pH.
The structural integrity and positioning of the Golgi apparatus are dependent on the microtubule cytoskeleton (Thyberg and Moskalewski 1993, 1999; Marsh et al. 2001). The distribution of Golgi stacks throughout the cytoplasm of CFPAC-1 cells could result from either a dysfunction in their attachment to microtubules or a change in microtubule distribution. With regard to the first possibility, the greater dispersal and fragmentation of Golgi elements observed in the CFPAC-1 cells treated with nocodazole is an argument in favor of their attachment to microtubules. However, this interpretation will require further experimental investigation. Regarding the second possibility, we demonstrated by immuncytochemistry an unusual distribution of the microtubule network in CFPAC-1 cells compared with reverted cells. Although in the reverted cells, microtubules extended from a supranuclear region corresponding to the centrosomal region and were also localized along the apico-basal axis, in ΔF508 CFPAC-1 cells, microtubules displayed a disorderly distribution and appeared to radiate from different focal points, distributed in a seemingly random fashion. This distinctive microtubule distribution suggested the existence of several nucleation sites. To test this hypothesis, we detected MTOCs using antibodies directed against γ-tubulin. Although most cells in the reverted line contained one or two MTOCs, 63% of the CFPAC-1 cells exhibited an abnormally large number of MTOCs, suggesting the presence of supernumerary centrosomes. A multiplicity of centrosomes often appears in cancerous cells and is associated with multipolar mitoses (Sato et al. 2001; Gisselsson et al. 2002). In the present study, the number of multipolar mitoses in CFPAC-1 cells was not significantly different from that in the reverted cells and cannot, therefore, explain the abnormally elevated number of MTOCs. The causes of the multiplicity of MTOCs in CFPAC-1 cells and their nature, whether they are centrosomes or other types of MTOCs, like those described in polarized epithelial cells (Meads and Schroer 1995), remain to be determined. A variety of data, however, suggesting that the Golgi complex plays a role in nucleation and the attachment of microtubules, could shed light on these two points (Chabin-Brion et al. 2001). These authors demonstrated the association of a cytosolic fraction of γ-tubulin with Golgi membranes and their capacity to nucleate microtubules. In CFPAC-1 cells, the numerous MTOCs could correspond to non-centrosomal nucleation sites of microtubules associated with Golgi stacks. In this case, the dispersal of the Golgi complex would be responsible for the large number of MTOCs and, consequently, the unusual distribution of the microtubule network.
The distinct distribution of mitochondria seen in CFPAC-1 cells compared with that in reverted cells may be related to disorganization of the microtubular cytoskeleton. It is known that microtubules are involved in mitochondrial distribution (Yaffe 1999) and, in addition, the fact that their distribution is similar to that of the Golgi complex in CFPAC-1 and CFPAC-PLJ-CFTR6 cells leads to the idea that they might be localized around the Golgi stacks. There, they would provide the energy needed for synthesis and secretion, as suggested recently by Dolman et al. (2005) in the case of acinar cells.
The structural integrity of the Golgi complex is essential to its physiological functions with regard to maturation and transport of proteins. Perturbations in intracellular trafficking and sorting of proteins were observed in rat parotid acinar cells in which the structure of the Golgi complex was disrupted by brefeldin A and okadaic acid (Tamaki and Yamashina 2002). In a similar way, the fragmentation of the Golgi complex induced by microtubule-depolymerizing drugs is correlated with a drastic retardation in the transport of membrane and secreted proteins (Matter et al. 1990; Robin et al. 1995; Cole et al. 1996). Furthermore, Graves et al. (2001) demonstrated that expression of misfolded mutated growth hormone (mutation Δ32–71) causes fragmentation of the Golgi apparatus and interferes with the trafficking of other non-mutant proteins. In the case of CFPAC-1 cells, the disturbances in the intracellular trafficking of CA IV to the apical plasma membrane are probably due to disorganization of the Golgi complex. The presence of CA IV in ERGIC, Golgi cisternae, and TGN pointed to the ability of Golgi stacks to transfer this protein despite their scattering. On the other hand, their dispersal, associated with that of microtubules, probably perturbs the formation and trafficking of transport vesicles carrying CA IV from the TGN toward the apical plasma membrane. It is unlikely that CA IV would be the only protein whose trafficking is perturbed. Dispersal of Golgi components would lead to disruption of the transport of other membrane or secretory proteins in CF cells, as has already been documented for MRP8 and MRP14 (migration inhibitory factor-related proteins) in CFPAC-1 cells (Fanjul et al. 1995). Perturbation of the secretory pathway could also explain why NHE3 expression is reduced in the luminal membrane of pancreatic duct cells from homozygote ΔF508 CFTR mice, as reported by Ahn et al. (2001). The fact that in reverted cells, both the Golgi complex and microtubules have a distribution consistent with that usually observed in polarized epithelial cells suggests the importance of CFTR in maintaining the integrity of the biosynthetic/secretory pathway. The molecular mechanism through which CFTR acts remains, nonetheless, to be determined.
Taken together, our results suggest that the disturbances in CA IV trafficking causing abnormalities in the pancreatic HCO3 − secretion in CF could result from the disorganization of the microtubule network associated with the dispersal of the Golgi complex.
Acknowledgments
This study was supported by the French Association Vaincre la Mucoviscidose and by the Ministère de l'Education Nationale, de la Recherche et de la Technologie.
We thank C. Baritaud for his technical assistance.
Literature Cited
- Ahn W, Kim KH, Lee JA, Kim JY, Choi JY, Moe OW, Milgram SL, et al. (2001) Regulatory interaction between the cystic fibrosis transmembrane conductance regulator and HCO3 - salvage mechanisms in model systems and the mouse pancreatic duct. J Biol Chem 276: 17236–17243 [DOI] [PubMed] [Google Scholar]
- Bannykh SI, Bannykh GI, Fish KN, Moyer BD, Riordan JR, Balch WE. (2000) Traffic pattern of cystic fibrosis transmembrane conductance regulator through the early exocytic pathway. Traffic 1: 852–870 [DOI] [PubMed] [Google Scholar]
- Barasch J, Kiss B, Prince A, Saiman L, Gruenert D, Al-Awqati Q. (1991) Defective acidification of intracellular organelles in cystic fibrosis. Nature 932: 70–73 [DOI] [PubMed] [Google Scholar]
- Boucher RC, Cotton CU, Gatzy JT, Knowles MR, Yankaskas JR. (1988) Evidence for reduced Cl- and increased Na+ permeability in cystic fibrosis human primary cell cultures. J Physiol 405: 77–103 [DOI] [PMC free article] [PubMed] [Google Scholar]
- Chabin-Brion K, Marceiller J, Perez F, Settegrana C, Drechou A, Durand G, Poüs C. (2001) The Golgi complex is a microtubuleorganizing organelle. Mol Biol Cell 12: 2047–2060 [DOI] [PMC free article] [PubMed] [Google Scholar]
- Cheng SH, Gregory RJ, Marshall J, Paul S, Souza DW, White GA, O'Riordan CR, et al. (1990) Defective intracellular transport and processing of CFTR is the molecular basis of most cystic fibrosis. Cell 63: 827–834 [DOI] [PubMed] [Google Scholar]
- Choi JY, Muallem D, Kiselyov K, Lee MG, Thomas PJ, Muallem S. (2001) Aberrant CFTR-dependent HCO3 - transport in mutations associated with cystic fibrosis. Nature 410: 94–97 [DOI] [PMC free article] [PubMed] [Google Scholar]
- Coakley RJ, Taggart C, Canny G, Greally P, O'Neill SJ, McElvaney NG. (2000) Altered intracellular pH regulation in neutrophils from patients with cystic fibrosis. Am J Physiol 279: L66–L74 [DOI] [PubMed] [Google Scholar]
- Cole NB, Sciaky N, Marotta A, Song J, Lippincott-Schwartz J. (1996) Golgi dispersal during microtubule disruption: regeneration of Golgi stacks at peripheral endoplasmic reticulum exit sites. Mol Biol Cell 7: 631–650 [DOI] [PMC free article] [PubMed] [Google Scholar]
- Crawford I, Maloney PC, Zeitlin PL, Guggino WB, Hyde SC, Turley H, Gatter KC, et al. (1991) Immunocytochemical localization of the cystic fibrosis gene product CFTR. Proc Natl Acad Sci USA 88: 9262–9266 [DOI] [PMC free article] [PubMed] [Google Scholar]
- Demolombe S, Baro I, Laurent M, Hongre AS, Pavirani A, Escande D. (1994) Abnormal subcellular localization of mutated CFTR protein in a cystic fibrosis epithelial cell line. Eur J Cell Biol 65: 214–219 [PubMed] [Google Scholar]
- Dolman NJ, Gerasimenko JV, Gerasimenko OV, Voronina SG, Petersen OH, Tepikin AV. (2005) Stable Golgi-mitochondria complexes and formation of Golgi Ca2+ gradients in pancreatic acinar cells. J Biol Chem 280: 15794–15799 [DOI] [PubMed] [Google Scholar]
- Drumm ML, Pope HA, Cliff WH, Rommens JM, Marvin SA, Tsui LC, Collins FS, et al. (1990) Correction of the cystic fibrosis defect in vitro by retrovirus-mediated gene transfer. Cell 62: 1227–1233 [DOI] [PubMed] [Google Scholar]
- Elgavish A. (1991) High intracellular pH in CFPAC: a pancreas cell line from a patient with cystic fibrosis is lowered by retrovirus-mediated CFTR gene transfer. Biochem Biophys Res Commun 180: 342–348 [DOI] [PubMed] [Google Scholar]
- Fanjul M, Alvarez L, Salvador C, Gmyr V, Kerr-Conté J, Pattou F, Carter N, et al. (2004) Evidence for a membrane carbonic anhydrase IV anchored by its C-terminal peptide in normal human pancreatic ductal cells. Histochem Cell Biol 121: 91–99 [DOI] [PubMed] [Google Scholar]
- Fanjul M, Renaud W, Merten M, Guy-Crotte O, Hollande E, Figarella C. (1995) Presence of MRP8 and MRP14 in pancreatic cell lines: differential expression and localization in CFPAC-1 cells. Am J Physiol 268: C1241–C1251 [DOI] [PubMed] [Google Scholar]
- Fanjul M, Salvador C, Alvarez L, Cantet S, Hollande E. (2002) Targeting of carbonic anhydrase IV to plasma membranes is altered in cultured human pancreatic duct cells expressing a mutated (ΔF508) CFTR. Eur J Cell Biol 81: 437–447 [DOI] [PubMed] [Google Scholar]
- Fujiwara T, Oda K, Yokota S, Takatsuki A, Ikehara Y. (1988) Brefeldin A causes disassembly of the Golgi complex and accumulation of secretory proteins in the endoplasmic reticulum. J Biol Chem 263: 18545–18552 [PubMed] [Google Scholar]
- Gilbert A, Jadot M, Leontieva E, Wattiaux-De Coninck S, Wattiaux R. (1998) ΔF508 CFTR localizes in the endoplasmic reticulum-Golgi intermediate compartment in cystic fibrosis cells. Exp Cell Res 242: 144–152 [DOI] [PubMed] [Google Scholar]
- Gisselsson D, Jonson T, Yu C, Martins C, Mandahl N, Wiegant J, Jin Y, et al. (2002) Centrosomal abnormalities, multipolar mitoses, and chromosomal instability in head and neck tumours with dysfunctional telomeres. Br J Cancer 87: 202–207 [DOI] [PMC free article] [PubMed] [Google Scholar]
- Graves TK, Patel S, Dannies PS, Hinkle PM. (2001) Misfolded growth hormone causes fragmentation of the Golgi apparatus and disrupts endoplasmic reticulum-to-Golgi traffic. J Cell Sci 114: 3685–3694 [DOI] [PubMed] [Google Scholar]
- Greeley T, Shumaker H, Wang Z, Schweinfest CW, Soleimani M. (2001) Downregulated in adenoma and putative anion transporter are regulated by CFTR in cultured pancreatic duct cells. Am J Physiol 281: G1301–1308 [DOI] [PubMed] [Google Scholar]
- Ishiguro H, Steward MC, Wilson RW, Case RM. (1996) Bicarbonate secretion in interlobular ducts from guinea-pig pancreas. J Physiol 495: 179–191 [DOI] [PMC free article] [PubMed] [Google Scholar]
- Jensen TJ, Loo MA, Pind S, Williams DB, Goldberg AL, Riordan JR. (1995) Multiple proteolytic systems, including the proteasome, contribute to CFTR processing. Cell 83: 129–135 [DOI] [PubMed] [Google Scholar]
- Kartner N, Augustinas O, Jensen TJ, Naismith AL, Riordan JR. (1992) Mislocalization of ΔF508 CFTR in cystic fibrosis sweat gland. Nat Genet 1: 321–327 [DOI] [PubMed] [Google Scholar]
- Kellokumpu S, Sormunen R, Kellokumpu I. (2002) Abnormal glycosylation and altered Golgi structure in colorectal cancer: dependence on intra-Golgi pH. FEBS Lett 516: 217–224 [DOI] [PubMed] [Google Scholar]
- Kopelman H, Corey M, Gaskin K, Durie P, Weizman Z, Forstner G. (1988) Impaired chloride secretion, as well as bicarbonate secretion, underlies the fluid secretory defect in the cystic fibrosis pancreas. Gastroenterology 95: 349–355 [DOI] [PubMed] [Google Scholar]
- Lebenthal E, Lerner A, Rolston DDK. (1993) The pancreas in cystic fibrosis. In Go VLW, Dimagno EP, Gardner JD, Lebenthal E, Reber HA, Scheele GA. eds. The Pancreas: Biology, Pathobiology, and Disease. New York, Raven Press, 1041–1081 [Google Scholar]
- Lowe M, Nakamura N, Warren G. (1998) Golgi division and membrane traffic. Trends Cell Biol 8: 40–44 [DOI] [PubMed] [Google Scholar]
- Lucocq J, Warren G, Pryde J. (1991) Okadaic acid induces Golgi apparatus fragmentation and arrest of intracellular transport. J Cell Sci 100: 753–759 [DOI] [PubMed] [Google Scholar]
- Mahieu I, Becq F, Wolfensberger T, Gola M, Carter N, Hollande E. (1994) The expression of carbonic anhydrases II and IV in the human pancreatic cancer cell line (Capan-1) is associated with bicarbonate ion channels. Biol Cell 81: 131–141 [DOI] [PubMed] [Google Scholar]
- Mairal A, Fanjul M, Hollande E. (1996) Targeting of carbonic anhydrase IV is linked to the polarization of human pancreatic duct cells (Capan-1) in culture. Gastroenterol Clin Biol 20: 581–590 [PubMed] [Google Scholar]
- Marsh BJ, Mastronarde DN, Buttle KF, Howell KE, McIntosh JR. (2001) Organellar relationships in the Golgi region of the pancreatic beta cell line, HIT-T15, visualized by high-resolution electron tomography. Proc Natl Acad Sci USA 98: 2399–2406 [DOI] [PMC free article] [PubMed] [Google Scholar]
- Matter K, Bucher K, Hauri HP. (1990) Microtubule perturbation retards both the direct and the indirect apical pathway but does not affect sorting of plasma membrane proteins in intestinal epithelial cells (Caco-2). EMBO J 9: 3163–3170 [DOI] [PMC free article] [PubMed] [Google Scholar]
- Meads T, Schroer TA. (1995) Polarity and nucleation of microtubules in polarized epithelial cells. Cell Motil Cytoskel 32: 273–288 [DOI] [PubMed] [Google Scholar]
- Pratha VS, Hogan DL, Martensson BA, Bernard J, Zhou R, Isenberg JI. (2000) Identification of transport abnormalities in duodenal mucosa and duodenal enterocytes from patients with cystic fibrosis. Gastroenterology 118: 1051–1060 [DOI] [PubMed] [Google Scholar]
- Rambourg A, Clermont Y. (1990) Three-dimensional electron microscopy: structure of the Golgi apparatus. Eur J Cell Biol 51: 189–200 [PubMed] [Google Scholar]
- Robin P, Rossignol B, Raymond MN. (1995) Effect of microtubule network disturbance by nocodazole and docetaxel (Taxotere) on protein secretion in rat extraorbital lacrimal and parotid glands. Eur J Cell Biol 67: 227–237 [PubMed] [Google Scholar]
- Rogalski AA, Singer SJ. (1984) Associations of elements of the Golgi apparatus with microtubules. J Cell Biol 99: 1092–1100 [DOI] [PMC free article] [PubMed] [Google Scholar]
- Sato N, Mizumoto K, Nakamura M, Machara N, Minamishima YA, Nishio S, Nagai E, et al. (2001) Correlation between centrosome abnormalities and chromosomal instability in human pancreatic cancer cells. Cancer Genet Cytogenet 126: 13–19 [DOI] [PubMed] [Google Scholar]
- Schoumacher RA, Ram J, Iannuzzi MC, Bradbury NA, Wallace RW, Tom Hon C, Kelly DR, et al. (1990) A cystic fibrosis pancreatic adenocarcinoma cell line. Proc Natl Acad Sci USA 87: 4012–4016 [DOI] [PMC free article] [PubMed] [Google Scholar]
- Smith JJ, Welsh MJ. (1992) cAMP stimulates bicarbonate secretion across normal but not cystic fibrosis airway epithelia. J Clin Invest 89: 1148–1153 [DOI] [PMC free article] [PubMed] [Google Scholar]
- Tamaki H, Yamashina S. (2002) Structural integrity of the Golgi stack is essential for normal secretory functions of rat parotid acinar cells: effects of brefeldin A and okadaic acid. J Histochem Cytochem 50: 1611–1623 [DOI] [PubMed] [Google Scholar]
- Thyberg J, Moskalewski S. (1985) Microtubules and the organization of the Golgi complex. Exp Cell Res 159: 1–16 [DOI] [PubMed] [Google Scholar]
- Thyberg J, Moskalewski S. (1993) Relationship between the Golgi complex and microtubules enriched in detyrosinated or acetylated α-tubulin: studies on cells recovering from nocodazole and cells in the terminal phase of cytokinesis. Cell Tissue Res 273: 457–466 [DOI] [PubMed] [Google Scholar]
- Thyberg J, Moskalewski S. (1998) Partitioning of cytoplasmic organelles during mitosis with special reference to the Golgi complex. Microsc Res Tech 40: 354–368 [DOI] [PubMed] [Google Scholar]
- Thyberg J, Moskalewski S. (1999) Role of microtubules in the organization of the Golgi complex. Exp Cell Res 246: 263–279 [DOI] [PubMed] [Google Scholar]
- Yaffe MP. (1999) The machinery of mitochondrial inheritance and behavior. Science 283: 1493–1497 [DOI] [PubMed] [Google Scholar]
- Yoshida T, Kamiya T, Imanaka-Yoshida K, Sakakura T. (1999) Low cytoplasmic pH causes fragmentation and dispersal of the Golgi apparatus in human hepatoma cells. Int J Exp Path 80: 51–57 [DOI] [PMC free article] [PubMed] [Google Scholar]