

Abstract
N-myc downregulated gene 1 (NDRG1) is a 43-kD protein whose mRNA is induced by DNA damage, hypoxia, or prolonged elevation of intracellular calcium. Although NDRG1 is also upregulated during cell differentiation, there are few studies on NDRG1 expression during postnatal development. Here we investigated the expression and cellular distribution of NDRG1 protein in rat kidney and brain during postnatal development. Immunohistochemical analysis revealed that the cellular localization of NDRG1 protein in the kidney changed from the proximal convoluted tubules to the collecting ducts between postnatal days 10 and 20. In the brain, a change in cellular expression was also found from the hippocampal pyramidal neurons to the astrocytes in the gray matter during the same postnatal period. These alterations in the cellular distribution of NDRG1 were associated with shifts in the molecular assembly on Western blots. Under non-reduced conditions, the main NDRG1 band was found only around 215 kD in both kidney and brain during the early postnatal stage. After postnatal day 10, the immunoreactive bands shifted to 43 kD in the kidney and 129 kD in the brain. These changes in the cellular distribution and state of assembly may correlate with the functional maturation of both organs.
Keywords: NDRG1, differentiation, brain, kidney, cellular localization, immunohistochemistry, Western blotting
N-myc downregulated gene 1 (NDRG1) is a 43-kD cytoplasmic protein consisting of one of the four members of the NDRG family (Zhou et al. 1998). The NDRG family does not share any homologous motifs with any other known proteins (Zhou et al. 2001). The expression of NDRG1 mRNA and NDRG1 protein is repressed in cell transformation and by N-myc and c-myc (van Belzen et al. 1997; Kurdistani et al. 1998, Okuda and Kondoh 1999; Shimono et al. 1999; Guan et al. 2000; Rutherford et al. 2001). In contrast, NDRG1 is upregulated in growth-arrested differentiating cells and under conditions of cellular stress, such as DNA damage, low glucose concentration, severe hypoxia, and high intracellular calcium concentration induced by many agents, including nickel compounds, okadaic acid, homocysteine, and calcium ionophore (Kokame et al. 1996; van Belzen et al. 1997,1998; Kurdistani et al. 1998; Zhou et al. 1998; Piquemal et al. 1999; Salnikow et al. 1999,2000,2002; Ulrix et al. 1999; Park et al. 2000). Recently, a nonsense mutation in the NDRG1 gene has been reported to be causative for hereditary motor and sensory neuropathy-Lom (HMSNL), a severe peripheral neuropathy characterized by Schwann cell dysfunction and progressive axon loss in the peripheral nervous system (Kalaydjieva et al. 2000). This suggests that NDRG1 may function in the peripheral nervous system and be necessary for axon survival. Therefore, although the main function of NDRG1 remains to be identified, NDRG1 is likely to have two biological roles, one in cell differentiation and the other in response to some types of stress on cells.
Previous studies regarding expression of the NDRG family have mostly been at the mRNA level. NDRG1 mRNA was reported to be ubiquitously expressed in human and rat heart, brain, kidney, placenta, lung, liver, skeletal muscle, and pancreas. The kidney was the organ with the most abundant NDRG1 mRNA. (Kokame et al. 1996; van Belzen et al. 1997; Nishie et al. 2001; Zhou et al. 2001; Lachat et al. 2002). NDRG2 mRNA was strongly expressed in brain, heart, and skeletal muscle, while NDRG3 mRNA was strongly expressed in brain. NDRG2 and NDRG3 also showed ubiquitous weak expression in other organs. NDRG4 mRNA was selectively expressed in brain and heart. In particular, NDRG4-B, which is one of the three isoforms of NDRG4, was expressed only in brain (Zhou et al. 2001). Therefore, these results suggest the specific importance of the NDRG family in the brain. On the other hand, there are only a couple of studies on NDRG1 protein expression in vivo (van Belzen et al. 1997; Cangul et al. 2002; Lachat et al. 2002). These studies have been carried out only on human surgical specimens. Although high expression of NDRG1 protein was noted not only in a variety of cancer cells but also in normal kidney, NDRG1 protein has not been observed in normal brain tissues. Moreover, although NDRG1 had been thought to be involved in cell differentiation, there are only two studies on NDRG1 mRNA expression during embryonal development (Okuda and Kondoh 1999; Shimono et al. 1999) and no studies on NDRG1 protein expression during postnatal development.
To study NDRG1 expression at the protein level during postnatal development in rat kidney and brain, we raised an antiserum against a repeated sequence in the C-terminal region of NDRG1. This antiserum was specific for NDRG1 because the tandem repeats are characteristic of NDRG1 and are not present in other members of the NDRG family (Zhou et al. 2001; Qu et al. 2002). Here we demonstrate that NDRG1 protein exists in brain as well as kidney, and that regional and cell type changes in NDRG1 expression occur during postnatal rat development. Moreover, we suggest the possibility that NDRG1 forms a polymer in vivo.
Materials and Methods
Animals and Tissue Preparations
The animal experiments in this study were approved by the Committee for Ethical Animal Experiments of Kyushu University (no. 09-058-0). Pregnant Wistar rats were purchased from Kyudo Co. (Saga, Japan). After birth, postnatal 1-day (P1), 3-day (P3), 7-day (P7), 8-day (P8), 10-day (P10), 14-day (P14), 21-day (P21), 28-day (P28), 35-day (P35), and 42-day (P42) rats were selected and anesthetized deeply with ether or had hypothermia induced by placing the neonatal rats directly on ice. The rats were then decapitated. The brains and kidneys were immediately removed, and frozen in chilled isopentane for Western blotting or fixed in a solution of ethanol and acetic acid (19:1) overnight for histological examination.
Production of Anti-NDRG1 Antisera
A cysteine-conjugated peptide corresponding to the internal sequence of human NDRG1 (TSEGTRSRSC), which corresponded to the tandem repeat region (Zhou et al. 2001; Qu et al. 2002), was synthesized. The terminal cysteine residue was coupled with keyhole limpet hemocyanin (KLH) and then used to immunize rabbits (Masuda et al. 2003).
Immunohistochemistry
Paraffin-embedded sections from rats at each time period were used for histological examination. Coronal sections of the cerebrum at the level of the caudate putamen and the dorsal hippocampi, and sagittal sections of the cerebellum and the kidney, were routinely stained with hematoxylin and eosin (H&E). Immunohistochemistry (IHC) was carried out using the labeled biotin-streptavidin method. Paraffin-embedded sections were cut at 5-μm thickness, then depar-affinized in xylene, hydrated in ethanol, and incubated with 0.3% H2O2 in absolute methanol for 30 min at room temperature to inhibit endogenous peroxidase. After washing with Tris-HCl buffer (50 mM Tris-HCl, pH 7.6), the sections were incubated at 4C overnight with a rabbit polyclonal antiserum against NDRG1 at a dilution of 1:2000 in PBS containing 5% normal goat serum. The sections were then sequentially incubated with a biotinylated secondary antibody diluted 1:200 and a peroxidase-conjugated streptavidin-biotin complex diluted 1:100 (Amersham; Poole, UK). The colored reaction product was developed with 3,3′-diaminobenzidine tetrahydrochloride (DAB) solution. The sections were lightly counterstained with hematoxylin.
Because the immunocytochemical localization of αB-crystallin in rat kidney is restricted to the zonal structures (Iwaki et al. 1990,1991), double labeling with the anti-NDRG1 antiserum and an anti-αB-crystallin antibody was conducted on P21 and P42 kidney sections. The sections were rehydrated and endogenous peroxidase activity was blocked with 0.3% H2O2 in absolute methanol for 30 min. After washing with Tris-HCl buffer, the sections were incubated with the anti-NDRG1 antiserum overnight at 4C. The bound antiserum was visualized by the biotin-streptavidin method using 3-amino-9-ethylcarbazole (AEC; Vector Laboratories, Burlingame, CA) as the chromogen, which yields a brownish-red product. After the immunoreactive structures were photographed, the AEC sections were destained in 99% ethanol, completely immersed in 0.01 M citrate buffer, pH 6.0, and autoclaved at 121C for 10 min to remove the immunoreaction products. The sections were then incubated at 4C overnight with a polyclonal rabbit antibody against αB-crystallin (Iwaki et al. 1989), and the immunoreactivity was visualized by the biotin-streptavidin method using AEC. After the immunoreactive structures were photographed, sections were decolorized and the immunoreaction products were removed using the methods described above. H&E staining was then performed.
For double immunofluorescence of brain sections, specimens from P21 rats were incubated with combinations of the polyclonal antiserum against NDRG1 and a monoclonal antibody against GFAP (clone GA5; Novocastra Laboratories, Newcastle, UK) at 4C overnight. The immunoreactivities were visualized with FITC-conjugated anti-mouse IgG and Texas red-conjugated anti-rabbit IgG (Amersham), and the sections were observed under a confocal laser microscope (LSM-GB200; Olympus, Tokyo, Japan).
Western Blotting
Fresh frozen samples from the kidneys and cerebrums of P1, P3, P7, P8, P10, P14, P21, P28, P35, and P42 rats were homogenized in a protein lysis buffer, consisting of 20 mM Tris-HCl (pH 7.4) containing 10% sucrose and protease inhibitors (protease inhibitor cocktail, Complete Mini; Roche Diagnostic, Mannheim, Germany), and centrifuged at 800 × g for 10 min at 4C. The supernatants were collected and the protein concentrations were determined using the Coomassie Plus Protein Assay Reagent (Pierce, Rockford, IL) with bovine serum albumin as the standard. Protein samples were denatured in electrophoresis sample buffer (62.5 mM Tris-HCl, pH 6.8, 5% SDS, 5% glycerol, 3 mM EDTA, and 0.02% bromophenol blue) with or without a reducing agent (4% 2-mercaptoethanol), and each sample (10 μg/lane) was separated by 7.5% SDS-polyacrylamide gel electrophoresis and transferred to a polyvinylidene difluoride membrane (PDVF; Millipore, Bedford, MA). After blocking with 5% non-fat dry milk with 0.05% Tween-20 in Tris-buffered saline for 1 hr at RT, the membranes were incubated overnight with the anti-NDRG1 antiserum (1:2000) in the blocking buffer, then washed and incubated with a peroxidase-conjugated secondary antibody (1:20,000; Chemicon, Temecula, CA) for 1 hr. The immunoreactive proteins were visualized with enhanced chemiluminescence (ECL; Amersham).
Results
Specificity of the Antiserum
The specificity of the antiserum raised against the NDRG1 protein was shown by the following results. NDRG1 protein with the expected molecular mass of 43 kD was recognized with a strong signal in the total homogenates of P7 rat kidney and cerebrum under reduced conditions (Figure 1). No signal was observed in the absence of the primary antiserum. Moreover, this antiserum was previously reported to recognize specifically both phosphorylated and unphosphorylated NDRG1 protein by Western blotting of renal cancer cell lines (Masuda et al. 2003).
Figure 1.

Representative Western blots of P7 rat kidney (A) and cerebrum (B) probed with the anti-NDRG1 antibody under reduced conditions. Each lane was loaded with 10 μg of protein. Molecular markers are given in kD on the right. The antibody reacted strongly with each sample at 43 kD. Faint bands around 129 and 172 kD were also seen in the cerebral sample. The lanes without primary antibody showed no positive bands (control). Actin is shown as a loading control.
Immunohistochemistry
In the kidney, the most prominent NDRG1-specific staining in the early stage of development was found in the proximal convoluted tubules in the cortex, which showed membrane as well as cytoplasmic labeling (Figure 2). Although the immunoreactivity of the proximal convoluted tubules was more apparent in the juxtamedullary cortex than in the peripheral cortex at P1 and P3, obvious immunoreactivity of peripheral proximal convoluted tubules was gradually recognized by P7 and was evident from P10 to P14 (Table 1). However, the immunoreactivity of the proximal convoluted tubules decreased thereafter and disappeared by P28. The immunoreactivity was not found in the glomerulus during postnatal development. On the other hand, although the immunoreactivity for NDRG1 could not be recognized in the outer medulla in the early postnatal stage, NDRG1 staining was gradually disclosed in some tubular structures in this region after P10 (Figures 2J-2L). The pars recta of the proximal convoluted tubules and the thin limb of the intermediate tubules, which are contiguous with the pars recta of the proximal convoluted tubules, exist in the outer stripe and inner stripe of the outer medulla, respectively. Because αB-crystallin has been reported to stain the pars recta of proximal convoluted tubules and the thin limb of intermediate convoluted tubules in the outer medulla (Iwaki et al. 1990,1991), we performed multiple staining of NDRG1, αB-crystallin, and H&E on the same sections to confirm whether the structures immunoreactive for NDRG1 were proximal or intermediate convoluted tubules (Figure 3). The NDRG1 antiserum stained columnar cells with a bright cytoplasm and clear cell boundary. On the other hand, the αB-crystallin antibody stained eosinophilic cuboidal or squamous cells with an unclear cell boundary. Thus, the NDRG1-immunoreactive tubular structures did not correspond histologically to the pars recta of proximal convoluted tubules or the thin limbs of intermediate convoluted tubules, but instead to collecting ducts.
Figure 2.
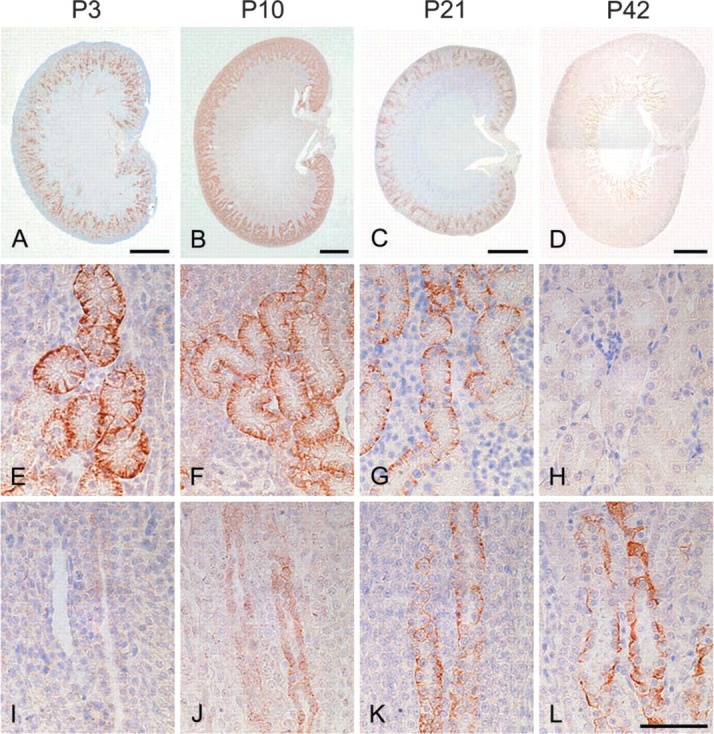
IHC for NDRG1 in the developing rat kidney at P3 (A,E,I), P10 (B,F,J), P21 (C,G,K), and P42 (D,H,L). (A-D) Sagittal sections of kidneys. (E-H) IHC of the cortical region. (I-L) IHC of the outer stripe of the outer medulla. The immunoreactivity was first evident in the proximal convoluted tubules in the cortical region during the first 2 postnatal weeks and gradually decreased thereafter. On the other hand, although immunoreactivity was not apparent in the renal medulla during the early postnatal stage, NDRG1 staining was gradually recognized in collecting ducts in the outer stripe of the outer medulla. Bars: A,B = 1 mm; C,D = 2 mm; L = 50 μm.
Table 1.
NDRG1 immunoreactivity in the kidney a
| Postnatal day | |||||||||||
|---|---|---|---|---|---|---|---|---|---|---|---|
| Zone | Structure | 1 | 3 | 7 | 8 | 10 | 14 | 21 | 28 | 35 | 42 |
| Cortex | Glomeruli | − | − | − | − | − | − | − | − | − | − |
| Proximal convoluted tubules | + | + | ++ | ++ | ++ | ++ | + | − | − | − | |
| Distal convoluted tubules | − | − | − | − | − | − | − | − | − | − | |
| Outer stripe | Pars recta of proximal convoluted tubules | − | − | − | − | − | − | − | − | − | − |
| Thick ascending limbs | − | − | − | − | − | − | − | − | − | − | |
| Collecting ducts | − | − | − | − | ± | ± | + | + | ++ | ++ | |
| Inner stripe | Thin limbs | − | − | − | − | − | − | − | − | − | − |
| Thick ascending limbs | − | − | − | − | − | − | − | − | − | − | |
| Collecting ducts | − | − | − | − | ± | ± | + | + | ++ | ++ | |
| Inner medulla | Thin limbs | − | − | − | − | − | − | − | − | − | − |
| Collecting ducts | − | − | − | − | − | − | − | − | − | − | |
−, immunonegative; ±, weak immunoreactivity; +, moderate immunoreactivity; ++, strong immunoreactivity.
Figure 3.
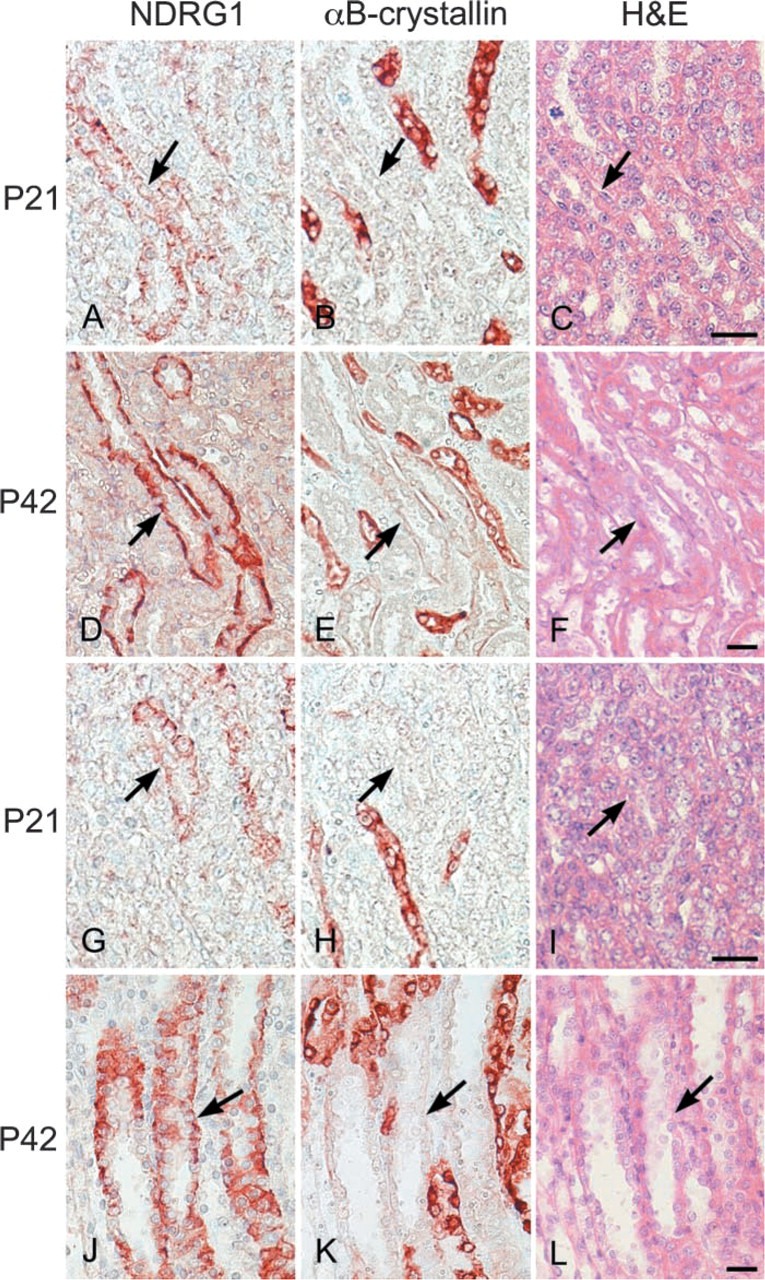
Double IHC performed on the same paraffin sections from P21 (A,B,G,H) and P42 (D,E,I,K) rat kidneys showing different localizations of NDRG1 (A,D,G,I) and αB-crystallin (B,E,H,K). H&E staining was also performed on the same sections from P21 (C,I) and P42 (F,L) rat kidneys. (A-C) Outer stripe of the outer medulla of the P21 rat kidney. Arrows in A-C indicate the same tubular structure. (D-F) Outer stripe of the outer medulla of the P42 rat kidney. Arrows in D-F indicate the same tubular structure. (G-I) Inner stripe of the outer medullar of the P21 rat kidney. Arrows in G-I indicated the same tubular structure. (J-L) Inner stripe of the outer medullar of the P42 rat kidney. Arrows in J-L indicate the same tubular structure. Immunoreactivity of NDRG1 is found at the collecting ducts, while that of αB-crystallin is localized at the pars recta of proximal convoluted tubules and thin limb of intermediate convoluted tubules. Bars = 20 μm.
In the brain, the most prominent NDRG1-specific staining in the early developmental stage was found in the pyramidal neurons of the hippocampal CA2, CA3, and CA4 regions (Table 2; Figure 4). These cells exhibited cytoplasmic staining for NDRG1 and the immunoreactivity gradually increased after birth and reached the maximal level from P8 to P10. Thereafter, the immunoreactivity in the pyramidal neurons decreased and disappeared by P14. The pyramidal neurons in the CA1 regions were also immunoreactive with the NDRG1 antiserum, but the immunoreactivity was weak compared with that of the pyramidal neurons in the CA2, CA3, and CA4 regions. On the other hand, NDRG1 immunoreactivity for glial cells was not apparent in either the neocortex or cerebellum in the early postnatal stage, but then NDRG1-immunoreactive astrocytes were gradually recognized in the hippocampus (Figure 4G and 4H) and the neocortex (Figure 4K and 4L) after P10 and were apparent after P21. This was confirmed by double immunostaining using the NDRG1 antiserum and GFAP antibody (Figure 5). We also found immunoreactivity on Bergmann glia and astrocytes around the dentate nucleus of the cerebellum from the end of the second postnatal week (Figure 4O and 4P). Faint immunoreactivity in astrocytes in the caudate putamen region was also recognized after P14. However, astrocytes in the white matter hardly showed immunoreactivity for the NDRG1 antiserum during postnatal development. Neurons in the neocortex and Purkinje cells of the cerebellum did not demonstrate immunoreactivity against the NDRG1 antiserum during postnatal development (Figures 4I-4P). Immunoreactivity was not found in either the kidney or brain in the absence of the primary antibody.
Table 2.
NDRG1 immunoreactivity in the brain a
| Postnatal day | |||||||||||
|---|---|---|---|---|---|---|---|---|---|---|---|
| Area | 1 | 3 | 7 | 8 | 10 | 14 | 21 | 28 | 35 | 42 | |
| Neocortex | Neurons | − | − | − | − | − | − | − | − | − | − |
| Astrocytes | − | − | − | − | ± | + | ++ | ++ | + + | ++ | |
| Hippocampus | Pyramidal neurons | ||||||||||
| CA1 | − | − | ± | + | + | − | − | − | − | − | |
| CA2 | − | ± | + | ++ | + + | − | − | − | − | − | |
| CA3 | − | ± | + | ++ | + + | − | − | − | − | − | |
| CA4 | − | ± | + | ++ | + + | − | − | − | − | − | |
| Dentate gyrus | − | − | − | − | − | − | − | − | − | − | |
| Astrocytes | − | − | − | − | ± | + | ++ | ++ | + + | ++ | |
| White matter | Astrocytes | − | − | − | − | − | − | − | − | − | − |
| Caudate putamen | Astrocytes | − | − | − | − | − | ± | ± | ± | ± | ± |
| Thalamus | Astrocytes | − | − | − | − | − | ± | ± | ± | ± | ± |
| Cerebellum | Cortex | ||||||||||
| Purkinje cells | − | − | − | − | − | − | − | − | − | − | |
| Bergmann glia | − | − | − | − | − | ± | + | ++ | + + | ++ | |
| Granule cells | − | − | − | − | − | − | − | − | − | − | |
| Astrocytes | − | − | − | − | − | ± | + | ++ | + + | ++ | |
| Medullary substance Dentate nucleus | − | − | − | − | − | − | − | − | − | − | |
| Neurons | − | − | − | − | − | − | − | − | − | − | |
| Astrocytes | − | − | − | − | − | ± | + | ++ | + + | ++ | |
-, immunonegative; ±, weak immunoreactivity; +, moderate immunoreactivity; ++, strong immunoreactivity.
Figure 4.
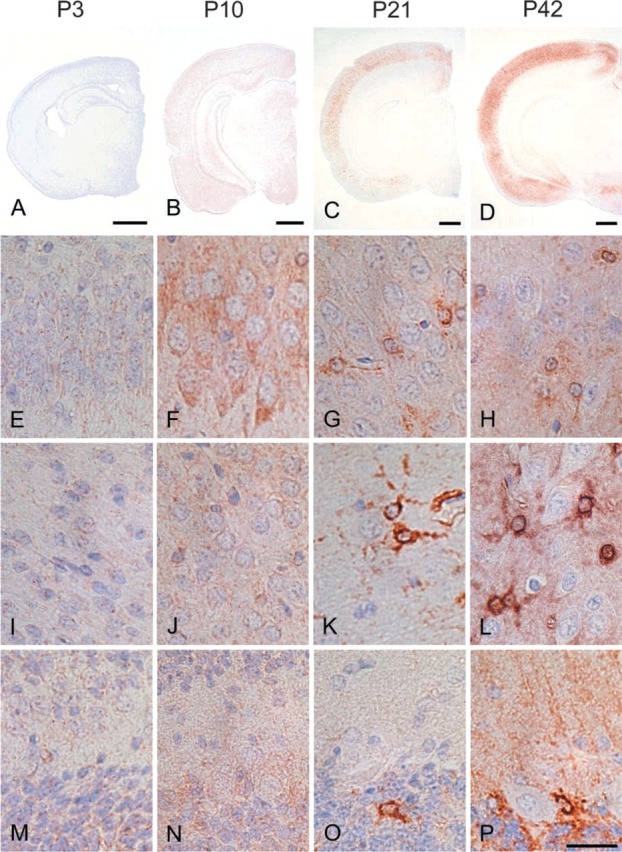
IHC of rat forebrain (A-D), hippocampal CA2 (E-H), cerebral neocortex (I-L), and cerebellar cortex (M-P) probed with the antibody against NDRG1 at P3 (A,E,I,M), P10 (B,F,J,N), P21 (C,G,K,O), and P42 (D,H,L,P). The immunoreactivity of hippocampal pyramidal neurons became strong around P10 and gradually reduced thereafter. On the other hand, the immunoreactivity of astrocytes gradually increased after the beginning of the third postnatal week and became intense after P21. Bars: A-D = 1 mm; P = 50 μm.
Figure 5.
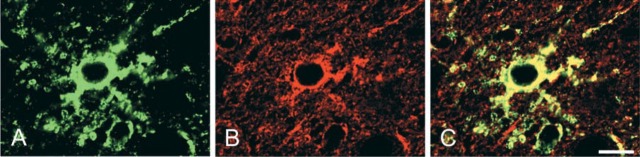
Double immunofluorescence of P21 rat cerebral neocortex for NDRG1 (A: FITC, green) and GFAP (B: Texas red, red), and the merged image (C). Overlapping of NDRG1 and GFAP is indicated by yellow. Bar = 10 μm.
Western Blotting
Western blotting for protein samples with the reducing agent revealed that the anti-NDRG1 antiserum reacted only with a 43-kD band in the kidney samples (Figure 6A). On the other hand, three bands at 43, 129, and 172 kDa were present in the cerebral samples (Figure 6C). In particular, the expression of the 129-kD rather than the 43-kD band gradually strengthened after P14.
Figure 6.

Western blots of rat kidneys (A,B) and cerebrums (C,D) probed with the anti-NDRG1 antibody. (A,C) Reduced conditions. (B,D) Non-reduced conditions. Days after birth are indicated above each figure. Molecular markers are given in kD at right. Under reduced conditions, the antibody reacted only with a 43-kD band in the kidney samples, but recognized bands around 43, 129, and 172 kD in the cerebral samples. On the other hand, under non-reduced conditions, an immunoreactive band was evident only around 215 kD during the early postnatal stage in both the kidney and cerebral samples. With development, this band around 215 kD gradually disappeared and bands around 43 and around 129 and 172 kD appeared after P14 in the kidney and cerebral samples, respectively. Actin is shown as a loading control. Data in this figure are representative of three independent experiments exhibiting similar results.
The molecular weight of a single polypeptide of NDRG1 was apparently 43 kD, because a band at 43 kD was recognized in SDS-PAGE under reduced condition in all kidney and cerebral samples. However, it was possible that the molecular weight of functional NDRG1 in vivo was not only 43 kD, because the cerebral samples also showed 129- and 172-kD bands. Therefore, in order not to cleave disulfide bonds and to protect the higher-order structure of NDRG1, we performed Western blotting on non-reduced samples (Figure 6B and 6D). For the protein samples from the kidney, only a 215-kD band was recognized in the early postnatal stage, and this 215-kD band gradually disappeared after P21. On the other hand, the 43-kD band gradually appeared after P10 and then became more intense. Faint bands at 129 kD were seen in the samples of P8, P10, and P14 rats. For the protein samples from the cerebrum, the band around 215 kD was gradually recognized in the early postnatal stage and disappeared after postnatal day 10, while the bands around 129 and 172 kD were recognized from P14. The band at 43 kD, which was demonstrated in the reduced protein samples, could not be recognized.
Discussion
Here we describe the expression and localization of NDRG1 protein in developing postnatal rat kidney and brain. Our study revealed that the localization of NDRG1 protein altered in the kidney and brain during postnatal development. Moreover, our results suggest that NDRG1 may form polymers that were regulated with development in both the kidney and brain.
Expression of NDRG1 Protein in Developing Rat Brain and Kidney
The present study revealed the existence of NDRG1 protein, not only in postnatal rat kidney but also in brain, by both IHC and Western blotting. The immunoreactivity observed in the kidney was almost consistent with previous findings concerning NDRG1 mRNA expression and NDRG1 protein localization in the kidney (Cangul et al. 2002; Lachat et al. 2002). However, the immunoreactivity in the brain was not comparable with previous studies. High expression of NDRG1 protein was found in brain tumor tissue, while immunoreactivity for the NDRG1 antibody has not previously been recognized in normal adult human brain (Cangul et al. 2002; Lachat et al. 2002). The difference between our study and previous reports concerning the NDRG1 protein expression in normal brain tissue may be due to a difference in species, maturity, antibodies, or tissue preparations. However, a difference due to species specificity is unlikely because NDRG1 is highly conserved in different mammals, as revealed by database searches and phylogenetic analysis (Qu et al. 2002). In addition, because NDRG1 protein was evident in P42 rat brain and high NDRG1 protein expression was also recognized in adult rat brain analyzed by IHC and Western blotting (data not shown), a difference due to brain maturity also appears unlikely. Therefore, we consider that the NDRG1 protein expressed in rat brain in our study is mainly due to the immunological characteristics of our NDRG1 antiserum or the tissue preparation. Because the Western blotting in our study revealed a strong signal at the expected molecular weight of 43 kD, our antiserum seemed to be highly specific for NDRG1.
Altered Localization of NDRG1 Protein in Postnatal Rat Kidney
In the IHC study, we found that the localization of NDRG1 protein altered around the end of the second postnatal week. In the kidney, we found strong immunoreactivity for NDRG1 in the proximal convoluted tubules of the cortical region during the first 2 weeks which disappeared by P28, whereas NDRG1 immunoreactivity was gradually recognized in the collecting ducts in the outer stripe of the medulla from P10. Neonatal rat kidneys are immature and nephrogenesis continues after birth, proceeding in a centrifugal pattern. The juxtamedullary convoluted tubules are the most highly developed at birth, and there is a progression of maturation of convoluted tubules towards the periphery during the postnatal period (Edwards et al. 1981). Although the collecting ducts in the medulla are immature in the early postnatal stage, they are rapidly elongated from at least the end of the second postnatal week (Edwards et al. 1981; Nigam et al. 1996). Functionally, the activity of most of the transporting systems related to the acid-base equilibrium are activated gradually after birth. The enzyme aromatic l-amino-acid decarboxylase (AADC), which is used as a marker of proximal convoluted tubule differentiation, exists only on the proximal convoluted tubules in the deep cortex during the first postnatal week and is gradually recognized on the proximal convoluted tubules in the outer cortex starting at P8 (Nigam et al. 1996). In addition, with respect to the collecting ducts in the medulla, the responsiveness to arginine vasopressin and the activity of Na+,K+-ATP-ase rapidly increase after the beginning of the third postnatal week (Edwards et al. 1981; Nigam et al. 1996). Therefore, the strong NDRG1 expression recognized on the proximal convoluted tubules in the cortex during the first 2 postnatal weeks appears to reflect the morphological and functional differentiation of the proximal convoluted tubules. Similarly, the immunoreactivity of the collecting ducts in the medulla detected from the end of the second postnatal week would be due to the differentiation and maturation of the collecting ducts.
Altered Localization of NDRG1 Protein in Postnatal Rat Brain
In the brain, we found strong immunoreactivity for NDRG1 on the hippocampal pyramidal neurons from P8 to P10, which disappeared by P14, whereas NDRG1 staining was gradually recognized on the astrocytes in the hippocampus, neocortex, and cerebellum from the end of the second postnatal week.
Hippocampal pyramidal neurons undergo morphological and functional differentiation during P1-P12. The appearance of pyramidal neurons changes from oval cells with packed nuclei and scant cytoplasm to large triangular cells during the early postnatal stage, occurring abruptly between P7 and P11 (López-Gallardo and Prada 2001). In addition, synaptogenesis occurs during the first 2 postnatal weeks. The functional maturation of the GABAergic and excitatory glutamatergic synaptic transmissions onto the hippocampal pyramidal neurons takes place during this period (Scheetz and Constantine-Paton 1994; Gubellini et al. 2001; Khazipov et al. 2001). The numbers of GABA and NMDA receptor sites increase rapidly after birth. They are greatest during the second postnatal week, after which there is a decrease to the adult level, which is attained at the end of the third postnatal week (Tasker 2001). Moreover, the neuronal glutamate transporter EAAC1 is also enriched in pyramidal neurons between P5 and P16 (Rothstein et al. 1994; Furuta et al. 1997). Therefore, the transient strong expression of NDRG1 on hippocampal pyramidal neurons in the early developmental stage may reflect the metabolic changes in the immature brain.
Development of astrocytes begins at the postnatal stage. During the maturation of glial cells, vimentin (VIM)-positive radial glial cells transform into GFAP-immunoreactive astrocytes. The radial glial cells disappear by P21 with the greatest rate of disappearance between P8 and P15 (Miller and Robertson 1993; Munekawa et al. 2000). Between birth and P20, GFAP is increased to the adult pattern in mature-shaped astrocytes (Pixley and de Vellis 1984; Kaur et al. 1989; Domaradzka-Pytel et al. 2000). Therefore, the strong NDRG1 expression recognized on the hippocampal pyramidal cells from P8 to P10 and on the astrocytes from the end of the second postnatal week appears to reflect their morphological and functional differentiation.
Interestingly, we found NDRG1-immunopositive astrocytes only in the regions where neurons existed, and the astrocytes in the white matter were hardly immunoreactive for NDRG1. This distribution of NDRG1-immunoreactive astrocytes resembles that of glutamate transporter GLAST- and GLT-1-immunoreactive astrocytes (Lehre et al. 1995; Furuta et al. 1997). Moreover, the processes of Bergmann glia, which covered the dendrites of Purkinje cells, were also immunoreactive for the NDRG1 antiserum. These findings suggest that, although the exact function of NDRG1 remains unresolved, the NDRG1 protein of astrocytes may have a certain role in neuron survival.
Formation of the NDRG1 Polymer as a Functional Molecule
NDRG1 protein is a 43-kD molecule overexpressed under several conditions, such as severe hypoxia. In this study, the Western blotting using a specific antibody for NDRG1 under reduced conditions showed the existence of an immunoreactive band around 43 kD. Therefore, the molecular weight of a single polypeptide of NDRG1 was confirmed to be 43 kD. However, in the cerebral samples we recognized other bands around 129 and 172 kD, which may correspond to the trimeric and tetrameric bands. Therefore, we consider that the NDRG1 antiserum also specifically recognized these bands. Because NDRG1 is a cysteine-rich protein having eight cysteines in its amino acid sequence (Qu et al. 2002), we suspected that the NDRG1 protein in vivo formed a polymer or protein complex by disulfide bonding. The Western blotting against kidney and cerebral samples in the absence of a reducing agent in order not to cleave disulfide bonds revealed that an NDRG1-immunoreactive band only existed at around 215 kD during the early postnatal stage. With development, this 215-kD band gradually disappeared and bands around 43 kD in kidney samples and around 129 and 172 kD in cerebrum samples increased from the end of the second postnatal week. The time when the molecular weight change was recognized by Western blotting agreed with the time when the change in NDRG1 localization was detected by IHC. Therefore, in both kidney and brain, NDRG1 protein as a functional molecule in vivo may change its molecular weight during postnatal development. NDRG1 protein may form pentamers in the proximal and intermediate convoluted tubules of the kidney cortex and in hippocampal pyramidal cells during the early postnatal stage. NDRG1 protein would exist as a monomer in the collecting ducts of the renal medulla and may also form trimers in astrocytes after the end of the second postnatal week. These different immunostaining and Western blotting patterns suggest the existence of diverse molecular forms of NDRG1 in postnatal rat development. However, there still remain some limitations to the interpretation of our results. First, we could not exclude the possibility that the NDRG1 antiserum crossreacts with other proteins and the possibility that NDRG1 has unknown spliced form variants because of insensitivity of 129- and 172-kD bands to the reducing reagent. Second, because our protein lysis buffer did not contain any detergents, such as Triton X-100, Western blotting against kidney samples may not include the results of NDRG1 protein existing in the membrane fraction. Further studies are required to clarify these points and to explore the biological function of NDRG1.
Acknowledgments
We wish to thank Ms Kazue Hatanaka and Ms Mikiko Sato for their skillful technical assistance.
Literature Cited
- Cangul H, Salnikow K, Yee H, Zagzag D, Commes T, Costa M. (2002) Enhanced expression of a novel protein in human cancer cells: a potential aid to cancer diagnosis. Cell Biol Toxicol 18:87–96 [DOI] [PubMed] [Google Scholar]
- Domaradzka—Pytel B, Ludkiewicz B, Jagalska—Majewska H, Mory SJ. (2000) Immunohistochemical study of microglial and astroglial cells during postnatal development of rat striatum. Folia Morphol (Warsz) 58:315–323 [PubMed] [Google Scholar]
- Edwards BR, Mendel DB, LaRochelle FT, Stern JP, Valtin H. (1981) Postnatal development of urinary concentrating ability in rats: changes in renal anatomy and neurohypophysial hormones. In Spitzer A, ed. The Kidney During Development: Morphology and Function. New York, Masson, 233–240 [Google Scholar]
- Furuta A, Rothstein JD, Martin LJ. (1997) Glutamate transporter protein subtypes are expressed differentially during rat CNS development. J Neurosci 17:8363–8375 [DOI] [PMC free article] [PubMed] [Google Scholar]
- Guan RJ, Ford HL, Fu Y, Li Y, Shaw LM, Pardee AB. (2000) Drg-1 as a differentiation-related, putative metastatic suppressor gene in human colon cancer. Cancer Res 60:749–755 [PubMed] [Google Scholar]
- Gubellini P, Ben-Ari Y, Gaïarsa JL. (2001) Activity- and age-dependent GABAergic synaptic plasticity in the developing rat hippocampus. Eur J Neurosci 14:1937–1946 [DOI] [PubMed] [Google Scholar]
- Iwaki T, Iwaki A, Liem RKH, Goldman JE. (1991) Expression of άB-crystallin in the developing rat kidney. Kidney Int 40:52–56 [DOI] [PubMed] [Google Scholar]
- Iwaki T, Kume—Iwaki A, Goldman JE. (1990) Cellular distribution of άB-crystallin in non-lenticular tissues. J Histochem Cytochem 38:31–39 [DOI] [PubMed] [Google Scholar]
- Iwaki T, Kume—Iwaki A, Liem RKH, Goldman JE. (1989) άB-crystallin is expressed in non-lenticular tissues and accumulates in Alexander's disease brain. Cell 57:71–78 [DOI] [PubMed] [Google Scholar]
- Kalaydjieva L, Gresham D, Gooding R, Heather L, Bass F, de Jonge R, Blechschmidt K, et al. (2000) N-myc downstream-regulated gene 1 is mutated in hereditary motor and sensory neuropathy-Lom. Am J Hum Genet 67:47–58 [DOI] [PMC free article] [PubMed] [Google Scholar]
- Kaur C, Ling EA, Wong WC. (1989) Development of the various glial cell types in the cerebral cortex of postnatal rats. Acta Anat 136:204–210 [DOI] [PubMed] [Google Scholar]
- Khazipov R, Esclapez M, Caillard O, Bernard C, Khalilov I, Tyzio R, Hirsch J, et al. (2001) Early development of neuronal activity in the primate hippocampus in utero. J Neurosci 21:9770–9781 [DOI] [PMC free article] [PubMed] [Google Scholar]
- Kokame K, Kato H, Miyata T. (1996) Homocystein-respondent genes in vascular endothelial cells identified by differential display analysis. J Biol Chem 271:29659–29665 [DOI] [PubMed] [Google Scholar]
- Kurdistani SK, Arizti P, Reimer CL, Sugrue MM, Aaronson SA, Lee SW. (1998) Inhibition of tumor cell growth by RTP/rit42 and its responsiveness to P53 and DNA damage. Cancer Res 58:4439–4444 [PubMed] [Google Scholar]
- Lachat P, Shaw P, Gebhard S, van Belzen N, Chaubert P, Bosman FT. (2002) Expression of NDRG1, a differentiation-related gene, in human tissues. Histochem Cell Biol 118:399–408 [DOI] [PubMed] [Google Scholar]
- Lehre KP, Lewy LM, Ottersen OP, Storm-Mathisen J, Danbolt NC. (1995) Differential expression of two glial glutamate transporters in the rat brain: quantitative and immunocytochemical observations. J Neurosci 15:1835–1853 [DOI] [PMC free article] [PubMed] [Google Scholar]
- López-Gallardo M, Prada C. (2001) Spatial and temporal patterns of morphogenesis of hippocampal pyramidal cells: study in the early postnatal rat. Hippocampus 11:118–131 [DOI] [PubMed] [Google Scholar]
- Masuda K, Ono M, Okamoto M, Morikawa W, Otsubo M, Migita T, Tsuneyoshi M, et al. (2003) Down-regulation of Cap43 gene by von Hippel-Lindau tumor suppressor protein in human renal cancer cells. Int J Cancer 105:803–810 [DOI] [PubMed] [Google Scholar]
- Miller MW, Robertson S. (1993) Prenatal exposure to ethanol alters the postnatal development and transformation of radial glia to astrocytes in the cortex. J Comp Neurol 337:253–266 [DOI] [PubMed] [Google Scholar]
- Munekawa K, Tamada Y, Iijima N, Hayashi S, Ishihara A, Inoue K, Tanaka M, et al. (2000) Development of astroglial elements in the suprachiasmatic nucleus of the rat: with special reference to the involvement of the optic nerve. Exp Neurol 166:44–51 [DOI] [PubMed] [Google Scholar]
- Nigam SK, Aperia AC, Brenner BM. (1996) Development and maturation of the kidney. In Brenner BM, ed. The Kidney. Philadelphia, WB Saunders, 72–98 [Google Scholar]
- Nishie A, Masuda K, Otsubo M, Migata T, Tsuneyoshi M, Kohno K, Shuin T, et al. (2001) High expression of the Cap43 gene in infiltrating macrophages of human renal cell carcinomas. Clin Cancer Res 7:2145–2151 [PubMed] [Google Scholar]
- Okuda T, Kondoh H. (1999) Identification of new genes Ndr2 and Ndr3 which are related to Ndr1/RTP/Drg1 but show distinct tissue specificity and response to N-myc. Biochem Biophys Res Commun 266:208–215 [DOI] [PubMed] [Google Scholar]
- Park H, Adams MA, Lachat P, Bosman F, Pang SC, Graham CH. (2000) Hypoxia induces the expression of a 43-kDa protein (PROXY-1) in normal and malignant cells. Biochem Biophys Res Commun 276:321–328 [DOI] [PubMed] [Google Scholar]
- Piquemal D, Joulia D, Balaguer P, Basset A, Marti J, Commes T. (1999) Differential expression of the RTP/Drg1/Ndr1 gene product in proliferating and growth arrested cells. Biochim Biophys Acta 1450:364–373 [DOI] [PubMed] [Google Scholar]
- Pixley SK, de Vellis J. (1984) Transition between immature radial glia and mature astrocytes studied with a monoclonal antibody to vimentin. Brain Res 317:201–209 [DOI] [PubMed] [Google Scholar]
- Qu X, Zhai Y, Wei H, Zhang C, Xing G, Yu Y, He F. (2002) Characterization and expression of three novel differentiation-related genes belong to the human NDRG gene family. Mol Cell Biochem 229:35–44 [DOI] [PubMed] [Google Scholar]
- Rothstein JD, Martin L, Levey AI, Dykes-Hoberg M, Jin L, Wu D, Nash N, et al. (1994) Localization of neuronal and glial glutamate transporters. Neuron 13:713–725 [DOI] [PubMed] [Google Scholar]
- Rutherford MN, Bayly GRL, Matthews BP, Okuda T, Dinjens WMN, Kondoh H, LeBrun DP. (2001) The leukemogenic transcription factor E2a-Pbx1 induces expression of the putative N-myc and p53 target gene NDRG1 in Ba/F3 cells. Leukemia 15:362–370 [DOI] [PubMed] [Google Scholar]
- Salnikow K, Blagosklonny MV, Ryan H, Johnson R, Coata M. (2000) Carcinogenic nickel induces genes involved with hypoxic stress. Cancer Res 60:38–41 [PubMed] [Google Scholar]
- Salnikow K, Kluz T, Costa M. (1999) Role of Ca2+ in the regulation of nickel-inducible Cap43 gene expression. Toxicol Appl Pharmacol 160:127–132 [DOI] [PubMed] [Google Scholar]
- Salnikow K, Kluz T, Costa M, Piquemal D, Demidenko ZN, Xie K, Blagosklonny MV. (2002) The regulation of hypoxic genes by calcium involves c-Jun/AP-1, which cooperates with hypoxia-inducible factor 1 in response to hypoxia. Mol Cell Biol 22:1734–1741 [DOI] [PMC free article] [PubMed] [Google Scholar]
- Scheetz AJ, Constantine-Paton M. (1994) Modulation of NMDA receptor function: implications for vertebrate neural development. FASEB J 8:745–752 [DOI] [PubMed] [Google Scholar]
- Shimono A, Okuda T, Kondoh H. (1999) N-myc-dependent repression of Ndr1, a gene identified by direct subtraction of whole mouse embryo cDNAs between wild type and N-myc mutant. Mech Dev 83:39–52 [DOI] [PubMed] [Google Scholar]
- Tasker RC. (2001) Hippocampal selective regional vulnerability and development. Dev Med Child Neurol Suppl 86:6–7 [DOI] [PubMed] [Google Scholar]
- Ulrix W, Swinnen JV, Heyns W, Verhoeven G. (1999) The differentiation-related gene 1, Drg1, is markedly upregulated by androgens in LNCaP prostatic adenocarcinoma cells. FEBS Lett 455:23–26 [DOI] [PubMed] [Google Scholar]
- van Belzen N, Dinjens WNM, Diesveld MPG, Groen NA, van der Made ACJ, Nozawa Y, Vlietstra R, et al. (1997) A novel gene which is up-regulated during colon epithelial cell differentiation and down-regulated in colorectal neoplasms. Lab Invest 77:85–92 [PubMed] [Google Scholar]
- van Belzen N, Dinjens WNM, Eussen BHJ, Bosman FT. (1998) Expression of differentiation-related genes in colorectal cancer: possible implications for prognosis. Histol Histopathol 13:1233–1242 [DOI] [PubMed] [Google Scholar]
- Zhou D, Salnikow K, Costa M. (1998) Cap43, a novel gene specifically induced by Ni2+ compounds. Cancer Res 58:2182–2189 [PubMed] [Google Scholar]
- Zhou RH, Kokame K, Tsukamoto Y, Yutani C, Kato H, Miyata T. (2001) Characterization of the human NDRG gene family: a newly identified member, NDRG4, is specifically expressed in brain and heart. Genomics 73:86–97 [DOI] [PubMed] [Google Scholar]