Abstract
Flagella are extracellular organelles that propel bacteria. Each flagellum consists of a basal body, a hook, and a filament. The major protein of the filament is flagellin. Induction of flagellin gene expression coincides with secretion of FlgM. The role of FlgM is to inhibit FliA (σ28), a flagellum-specific RNA polymerase responsible for flagellin transcription. To prevent premature polymerization of newly synthesized flagellin molecules, FliS, the flagellin-specific chaperone, binds flagellin and facilitates its export. In this study, the interaction between FlgM and FliS from Salmonella enterica serovar Typhimurium was characterized using gel shift, intrinsic tryptophan fluorescence, circular dichroism, limited proteolysis, and cross-linking. We have demonstrated that (i) FliS and FlgM interact specifically, forming a 1:1 complex, (ii) the FliS binding site on FlgM is proximal to or even overlaps the binding site for FliA, and (iii) FliA competes with FliS for FlgM binding.
INTRODUCTION
A flagellum is a unique structure that allows bacteria to propel themselves toward favorable environments (1, 2). It consists of a basal body, a long filament, and a hook connecting them (3). To assemble the flagellum in Salmonella enterica serovar Typhimurium, complex and precisely regulated machinery is required (for a review, see reference 4). This mechanism involves more than 60 proteins that are expressed in a hierarchical order.
Flagellar genes are organized in operons, the transcription of which depends upon the stage of assembly. These operons are organized into a transcriptional hierarchy of three promoter types grouped as classes 1, 2, and 3 (5, 6). The class 1 promoter region is under complex regulatory control and directs transcription of the flhDC operon in response to environmental cues. Proteins FlhD and FlhC, encoded by this operon, form a complex that acts as an activator for σ70-dependent transcription from class 2 promoters (7). Genes transcribed by the class 2 promoters code for proteins necessary for the synthesis and assembly of the basal body and the hook in addition to the fliA regulatory gene. The fliA gene codes for an alternative transcription factor, σ28, that directs RNA polymerase transcription of flagellar class 3 promoters. The class 3 promoters direct transcription of genes required after hook-basal body (HBB) completion, such as the fliC flagellin (FliC) gene, the major protein of the filament, and genes of the chemosensory system.
The flagellum-specific export system is evolutionarily related to a specialized type III secretion (T3S) system found in pathogenic bacteria that is used for bacterial toxin export (8, 9). In this system, special proteins that facilitate the export, so-called T3S chaperones, are necessary. Flagellin has to be exported through the hollow core of the filament to be assembled at its distal end. The N- and C-terminal regions of flagellin molecules are disordered in solution and become structured during polymerization (filament assembly) (10, 11). To prevent premature polymerization of newly synthesized flagellin molecules, FliS, the flagellin-specific T3S chaperone, binds in 1:1 stoichiometry to the C-terminal region of flagellin and facilitates its export (12–14).
Flagellin synthesis and assembly of the filament occur only after HBB assembly. FlgM, which is transcribed from class 2 and 3 promoters, is a key protein in the coordination of gene expression and filament assembly (15). The role of FlgM is to inhibit FliA, the flagellum-specific σ28 factor that is responsible for transcription of late flagellar genes, including flagellin (16, 17). FlgM interacts with FliA and prevents flagellar class 3 promoter transcription prior to the formation of the HBB. After the HBB is assembled, FlgM is exported from the cell, releasing FliA to transcribe the class 3 flagellin genes (18).
FlgM is exported via the same pathway as flagellin; however, none of the three flagellar T3S chaperones, including FliS, FlgN, and FliT, assists in FlgM secretion (19, 20). On the contrary, in FliS null mutants, secretion of FlgM was increased. Thus, FliS may act as an inhibitor of this secretion. In the absence of FliA, levels of FlgM outside bacteria decreased 100-fold (20). It was shown that FlgM export depended on its ability to bind FliA; therefore, it was concluded that FliA may also act as the T3S chaperone responsible for FlgM export. FlgM is an intrinsically disordered protein that becomes more structured upon binding of FliA (21). However, transcription of the flgM gene occurs prior to fliA gene transcription (18), and FlgM is relatively stable even in the absence of FliA (20). FliS, a T3S chaperone and negative inhibitor of FlgM secretion, may bind to FlgM so as to keep it stable before FliA is expressed in cells. Indeed, recently FliS has been identified as an FlgM binding partner by bacterial two-hybrid screening (22).
In this study, we demonstrate and characterize the interaction between FlgM and FliS from S. Typhimurium by using several different approaches: gel shift, fluorescence, limited proteolysis, circular dichroism (CD), and cross-linking. We have determined the stoichiometry of the FliS/FlgM complex and studied competition for FlgM binding between FliS and FliA. We show that removal of eight residues from the C terminus of FlgM results in the loss of FliS binding with no effect on the interaction with FliA.
MATERIALS AND METHODS
Plasmid construction and purification.
The fliS gene from S. Typhimurium was amplified by PCR from genomic DNA (strain SJW1412) using forward primer 5′-ACATGTACACCGCGAGCGGTATC-3′ and reverse primer 5′-GGATCCATTAACGAGACTCCTGGAAAGATG-3′, which contain PciI and BamHI restriction sites. The PCR product was ligated into the pGEM-T vector (Promega) and then subcloned and inserted into pET-52b(+) expression vector (Novagen). The construct was verified by DNA sequencing.
The flgM gene from S. Typhimurium was amplified by PCR from genomic DNA (strain SJW1412) using forward primer 5′CATATGAGCATTGACCGTACCTC-3′ and reverse primer 5′-CTCGAGATTATTTACTCTGTAAGTAGCTCTG-3′, which contain NdeI and XhoI restriction sites. The PCR product was ligated into the pGEM-T vector (Promega) and then subcloned and inserted into pET-22b(+) expression vector (Novagen). This construct was also verified by DNA sequencing. Purification of plasmids was performed according to the protocol for the Gene Jet plasmid miniprep kit (Thermo Scientific).
Site-directed mutagenesis.
Mutagenesis was performed using a QuikChange site-directed mutagenesis kit (Stratagene, La Jolla, CA). The plasmid encoding flgM was amplified by PCR using Pfu Turbo DNA polymerase (Agilent Technologies) and two complementary sets of oligonucleotides. The original plasmid was digested using DpnI (New England BioLabs), and the mixture was used to transform Escherichia coli MAX Efficiency DH5α. To change Ala 90 to a stop codon, the following oligonucleotides were used: 5′-CTCGCTCATTCGCGAGTAGCAGAGCTACTTACAGAG-3′ and 5′-CTCTGTAAGTAGCTCTGCTACTCGCGAATGAGCGAG-3′. After plasmid purification, the presence of the mutations was confirmed by DNA sequencing.
Protein expression and purification.
FliS from S. Typhimurium was overproduced in Escherichia coli cells of strain BL21(DE3) in autoinducible ZYP medium (23) supplemented with 100 μg/ml carbenicillin. Bacteria were collected by centrifugation at 8,000 rpm for 10 min (Beckman Coulter rotor JA-10) and then suspended in buffer A (20 mM Tris-HCl, 10 mM NaCl [pH 8.0]) containing 1 mM Pefabloc, 1 mM TLCK (Nα-p-tosyl-l-lysine chloromethyl ketone), and 1 tablet of EDTA-free protease inhibitor cocktail (Roche). After sonication in ice, the suspension was centrifuged at 16,000 rpm for 30 min at 4°C (Beckman Coulter rotor JA-17). Since the protein was in inclusion bodies, the pellet was suspended in 20 mM Tris-HCl plus 10 mM NaCl (pH 8.0) containing 7 M urea. The sample was centrifuged at 100,000 rpm for 1 h (Beckman Coulter rotor TLA-120.1), and the supernatant was used for final purification by fast protein liquid chromatography (FPLC) using a HiTrap QFF column. Protein was eluted with a 100 to 400 mM NaCl gradient in 20 mM Tris-HCl (pH 8.0) containing 7 M urea. After chromatography, FliS was collected and renatured over a period of 12 h by gradient dialysis against 50 mM Tris-HCl (pH 7.5) with decreasing concentrations of urea (7, 5, 3, 1, and 0 M). The final step of dialysis was repeated overnight.
FliA was overproduced in E. coli BL21(DE3) cells grown in LB medium containing 100 μg/ml carbenicillin. IPTG (isopropyl-β-d-thiogalactopyranoside) (1 mM) was added when the optical density at 600 nm (OD600) reached 0.4 to 0.6. Further purification of FliA was similar to that described above for FliS.
FlgM (wild type or truncated) was overproduced in E. coli BL21(DE3) in autoinducible ZYP medium with 100 μg/ml carbenicillin. After pelleting, bacteria were suspended in 10 mM HEPES (pH 7.5) containing 1 mM Pefabloc, 1 mM TLCK, and 1 tablet of protease inhibitor cocktail. After sonication, the suspension was centrifuged at 16,000 rpm for 30 min at 4°C (Beckman Coulter rotor JA-17). FlgM was soluble; therefore, after sterile filtration (0.22-μm-pore PES membrane; Millipore), supernatant was passed over a HiTrap SP HP column using FPLC. Protein was eluted with a linear 0 to 0.5 M NaCl gradient in 10 mM HEPES (pH 7.5).
Protein concentrations were determined with a bicinchoninic acid (BCA) protein assay kit (Thermo Scientific) and by measuring the differences in their spectra in 6 M guanidine-HCl between pH 12.5 and 7.0, using extinction coefficients of 2,357 per tyrosine and 830 per tryptophan at 294 nm (24). Secondary structure prediction employed Jpred http://www.compbio.dundee.ac.uk/www-jpred/. The protein isoelectric points (pI) were calculated with protparam (http://web.expasy.org/protparam/) and were as follows: 4.62 for FliS, 9.82 for FlgM, and 5.12 for FliA.
Masses of purified proteins were determined by mass spectrometry (MS) at the Keck facility, Yale University, and were as follows: 14,684 Da for FliS, 10,435 Da for FlgM, and 27,508 Da/29,368 Da for the double band of purified FliA (calculated masses are 14,687, 10,568, and 27,473 Da, respectively). The differences in masses show that N-terminal Met was removed from FlgM after expression and that FliA may also be modified. Although both the mass and calculated pI of FliA are higher than those of FliS, the mobility of FliA in the native gel is close to that of FliS, indicating that putative modifications decrease the pI of FliA. For limited proteolysis, trypsin was added to FliS, FlgM, or the FliS/FlgM complex in a 1:200 (wt/wt) ratio. After 30 min, proteolysis was stopped by adding Pefabloc, and the proteolytic mixtures were sent for mass spectrometry.
Gel shift and titration experiments.
FliS, FliA, and an FliS-FliA mixture in 50 mM Tris-HCl (pH 7.5) were titrated with different concentrations of FlgM in 10 mM HEPES (pH 7.5). Protein stock solutions (180 μM FliS, 64 μM FliA) or their 1:1 molar ratio mixture were diluted with different concentrations of FlgM to molar ratios of 0.125, 0.25, 0.5, 0.75, 1.0, 1.25, 1.5, 1.75, 2.0, and 2.5. Complex formation was analyzed using nondenaturing gel electrophoresis in 9% polyacrylamide gels polymerized in the presence of 10% glycerol without SDS (as described in reference 25). Gels stained with Coomassie R-250 were scanned and quantified using Molecular Imager ChemiDoc XRS+ with Image Lab software (Bio-Rad). Scanning results of parts of the gels where protein samples were not loaded were used as the background.
CD and fluorescence experiments.
CD spectra of 5 μM samples were measured using an Aviv model 400 spectropolarimeter (Lakewood, NJ) in 1-mm cuvettes. Tryptophan emission spectra were recorded with a PTI fluorometer (Photon Technology International, Lawrenceville, NJ) with a 2-nm slit width, from 300 to 400 nm with excitation at 295 nm for intrinsic tryptophan fluorescence. A 300 μM FlgM stock solution in 10 mM HEPES (pH 7.5) and a 180 μM FliS stock solution in 50 mM Tris-HCl (pH 7.5) were used. Fluorescence emission spectra were recorded for individual proteins at 10 μM concentrations and their 1:1 mixture (10 μM FliS, 10 μM FlgM) in the presence of 100 mM NaCl, using buffer containing 100 mM NaCl as a control. The experiment was run in separate cuvettes in parallel using a four-cuvette holder. The spectra recorded for each sample were corrected by subtraction of the signal for the buffer in the corresponding cuvette.
Cross-linking experiments.
FliS, FliA, and FlgM alone and FliA-FlgM, FliS-FlgM, and FliA-FliS-FlgM mixtures at equimolar ratios (10 μM each protein in 10 mM sodium phosphate buffer [pH 7.0] containing 100 mM NaCl) were incubated for 5 min at room temperature, and then glutaraldehyde was added to a final concentration of 0.01%. After 30 min of incubation at room temperature, cross-linking was stopped by addition of Tris-HCl (pH 8.0) (final concentration, 100 mM), and samples were analyzed by SDS-PAGE (15% polyacrylamide).
RESULTS AND DISCUSSION
FliS binds to FlgM at a 1:1 ratio.
FliS and FlgM from S. Typhimurium were purified. To find out if there is interaction between FliS and FlgM, native gel electrophoresis, or gel shift analysis, was performed. Mobility of proteins in a native gel depends upon protein charge, mass, and shape. FliS is negatively charged; its predicted isoelectric point (pI) is 4.62. FlgM is highly basic (pI 9.82), so it migrates backward toward the cathode and cannot be seen. Formation of an FliS/FlgM complex should result in the appearance of a new band. Indeed, when FliS and FlgM were mixed, an additional band appeared on the gel indicating the complex formation (Fig. 1A, lanes 2 to 11).
FIG 1.

Titration of FliS with FlgM. The decrease of free FliS and the increase of the FliS/FlgM complex were monitored by scanning and quantifying the corresponding bands in native polyacrylamide gels. (A) Nine percent native gel. (B) Dependence of the amount of free FliS (○) and density of the complex (●) on the FlgM/FliS molar ratio. AU, arbitrary units. Gel lanes correspond to points on the graph. Lanes 1 to 11 contain FlgM and FliS in molar ratios of 0, 0.125, 0.25, 0.5, 0.75, 1.0, 1.25, 1.5, 1.75, 2.0, and 2.5, respectively. The arrow indicates free FliS; the arrowhead indicates the FliS/FlgM complex. Error bars show standard deviations (n = 4). When titrated with FlgM, free FliS disappeared proportionally to the appearance of FliS/FlgM complex.
To determine the stoichiometry of the complex, FliS was titrated with FlgM (Fig. 1A). The FliS band almost disappeared at a 1:1 molar ratio, indicating that at this ratio, all FliS molecules were complexed with FlgM molecules. The intensity of the FliS/FlgM band also reached a maximum at a 1:1 ratio. The decreased intensity of the FliS band and the increased intensity of the complex band were monitored by scanning the gels (Fig. 1B). The amount of free FliS decreased from 350 pmol to 40 to 50 pmol when the complex was formed (Fig. 1A, lanes 6 to 11, and B). Both curves demonstrate saturation at a 1:1 ratio; therefore, one molecule of FliS binds one molecule of FlgM.
To determine where the binding site of the FliS molecule is located, we carried out fluorescence experiments. FliS possesses a single tryptophan in its C-terminal helix, while FlgM has none (Fig. 2). The fluorescence spectrum from FliS had an emission maximum at 334 nm (Fig. 3). After mixing FliS with FlgM in a 1:1 molar ratio, the maximum shifted to 326 nm, indicating that it had moved to a more hydrophobic environment. This implies that the tryptophan may be located in or close to the binding site. Based on this result and data on FliC disrupting the FliS-FlgM interaction obtained by Xu et al. using bacterial three-hybrid analysis (22), we conclude that FliS most likely binds FlgM via its C-terminal region, where the binding site for FliC is located (26).
FIG 2.
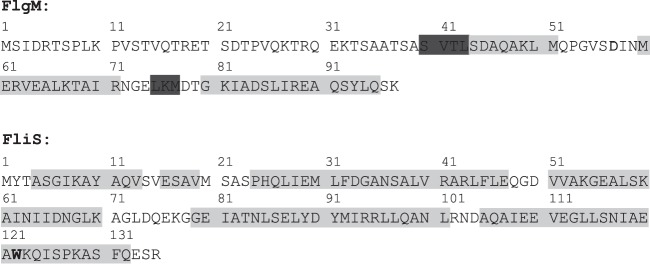
Amino acid sequences of FlgM and FliS from S. Typhimurium. Predicted α-helix and β-sheet regions are highlighted in light gray and dark gray, respectively. The only tryptophan residue in FliS is shown in boldface.
FIG 3.
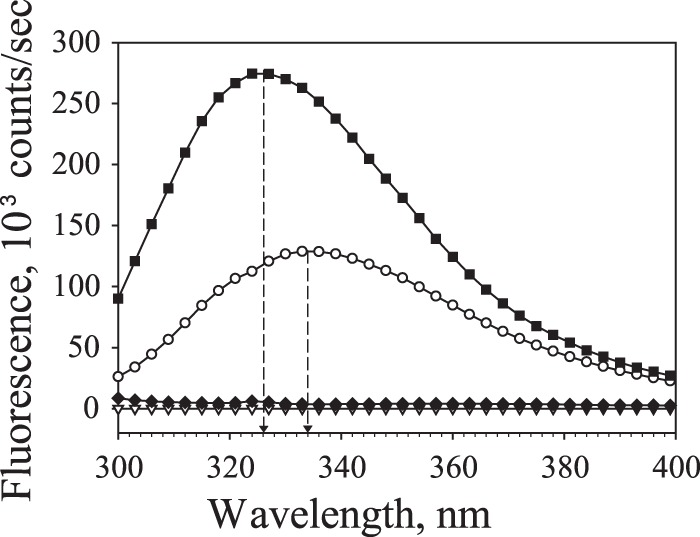
Fluorescence emission spectra of tryptophan corrected for 100 mM NaCl. ▽, 100 mM NaCl; ◆, 10 μM FlgM in 10 mM HEPES (pH 7.5) plus 100 mM NaCl; ○, 10 μM FliS in 50 mM Tris-HCl (pH 7.5); ■, the mixture of 10 μM FliS and 10 μM FlgM. Dashed arrows indicate fluorescence maxima for FliS before and after FlgM was added (from 334 nm to 326 nm). The increase in fluorescence intensity confirms that the lone FliS Trp residue was in a more hydrophobic location after FlgM addition. This provides evidence of complex formation involving the C terminus of FliS.
FlgM becomes more structured upon binding FliS.
According to secondary structure prediction, FliS from S. Typhimurium is a well-structured protein (81% α-helix, 19% random coil), while only the C-terminal half of FlgM from S. Typhimurium appears to be structured (37% α-helix, 7% β-structure, 56% random coil) (Fig. 2). To estimate secondary structure content for FliS and FlgM, we measured their CD spectra individually and when complexed (Fig. 4). The spectrum of FliS is typical for α-helical proteins, while the spectrum of FlgM is the spectrum of a mostly disordered protein with low α-helical content. The secondary structure content calculated from the spectra was 86% α-helix and 14% random coil for FliS, and that for FlgM was 20% α-helix, 10% β-structure, and 70% random coil. A nearly 2-fold difference between the FlgM predicted (37%) and calculated (20%) α-helical contents may reflect its ability to acquire structure upon interaction with its binding partners.
FIG 4.
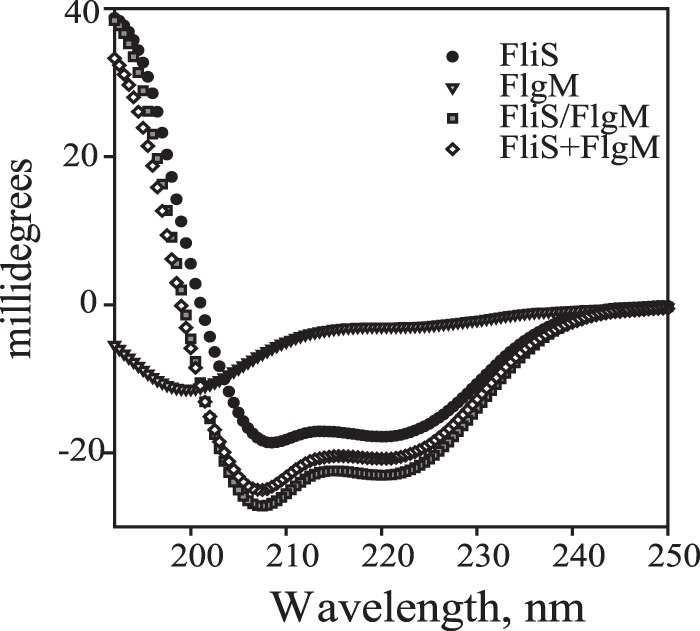
CD spectra of 5 μM FlgM and 5 μM FliS separately and in complex in 50 mM Tris-HCl (pH 7.5) containing 100 mM NaCl. The difference in the spectra of the complex of FlgM and FliS (FliS/FlgM) and the sum of individual curves (FliS+FlgM) indicates the change in the secondary structure.
To ascertain whether FlgM becomes more structured when bound to FliS, the CD spectrum of the complex of these proteins in a 1:1 molar ratio was measured and compared with the sum of the CD curves of individual proteins (Fig. 4). Compared to the summed curves of the noncomplexed proteins, the curve of the complexed proteins demonstrated a decreased signal at 222 nm and a shifted intersection with the x axis to higher wavelengths. Both changes indicate increased α-helical content as a result of complex formation. However, based on the shape of the spectrum of the complex, FlgM still has a high random coil content. The fact that most of the FlgM molecule is still disordered after binding FliS indicates that FlgM probably binds via its more ordered C-terminal region, leaving the disordered N-terminal region intact.
Competition of FliS and FliA for FlgM binding.
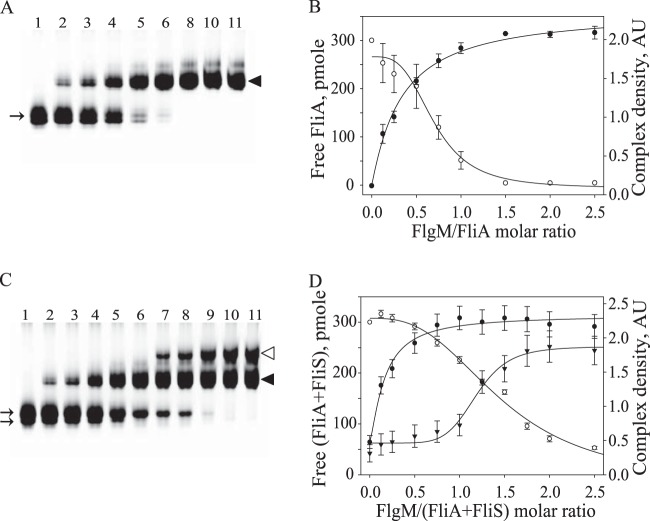
According to data obtained for crystal structures of FliS (in a complex with an FliC fragment) (26) and FlgM (in a complex with FliA) from Aquifex aeolicus (27), the C-terminal regions of FlgM and FliS participate in these interactions. Our data agree with the structural data, even though the amino acid sequences of FlgM and FliS from Salmonella and Aquifex have very low homology. We assumed that FliA and FliS must compete for FlgM binding if FliS also binds to the C-terminal region of FlgM. To test this hypothesis and to compare the affinities of the FliS/FlgM and FliA/FlgM complexes, we used FlgM to titrate FliA and the mixture of FliA and FliS (Fig. 5).
FIG 5.
Titration of FliA (A and B) and the FliA-FliS mixture (C and D) with FlgM. The decrease of free protein and increased complex formation were monitored by scanning and quantifying band density in native polyacrylamide gels. (A and C) Nine percent native gel; (B and D) dependence of the amount of free FliA and FliS (○) and density of FliA/FlgM (●) and FliS/FlgM complex bands (▼) on FlgM concentration. Lanes on the gels correspond to points on the graph. Lanes 1 to 11 contain FliA/FlgM complex (A) or FliA plus FliS/FlgM complex (C) in molar ratios of 0, 0.125, 0.25, 0.5, 0.75, 1.0, 1.25, 1.5, 1.75, 2.0, and 2.5, respectively (the ratios 1.25 and 1.75 are absent for the FliA-FlgM mixture). Arrows on the gels indicate individual (noncomplexed) FliA and FliS. Solid arrowheads indicate the FliA/FlgM complex, and the open arrowhead indicates the FliS/FlgM complex. Error bars show standard deviations (n = 4).
When FliA and FlgM were mixed and analyzed on native gels, as with FliS and FlgM, a new band again appeared (Fig. 5). This band exhibited greater mobility than the complex band in the FliS/FlgM titration experiment. Both the disappearance of the FliA band and the increasing density of the FliA/FlgM complex band were quantified by scanning the gel (Fig. 5A). The resulting curves (Fig. 5B) confirmed previous reports that FliA binds FlgM in a 1:1 molar ratio (15, 27).
Furthermore, FlgM was used to titrate an equimolar mixture of FliS and FliA (Fig. 5). There was no interaction between FliS and FliA, as no additional band appeared on a native gel (Fig. 5C, lane 1). However, the positions of the FliS and FliA bands in the gel were very close, and the scanner could not quantify them separately. Therefore, they were quantified together, while bands for complexes involving FlgM were quantified separately (Fig. 5D). At first, the band corresponding to the FliA/FlgM complex appeared (Fig. 5C). Only after all FliA had interacted with FlgM did the band for the FliS/FlgM complex appear. These data demonstrate that FliA binds more tightly to FlgM than does FliS, which is not surprising given that the dissociation constant for the FliA/FlgM complex is around 200 pM (28). When FliS was first mixed with FlgM, a band corresponding to the FliS/FlgM complex was seen, but when FliA was added, it displaced FliS (Fig. 6A). However, FliS was unable to displace FliA when the latter was mixed with FlgM first.
FIG 6.
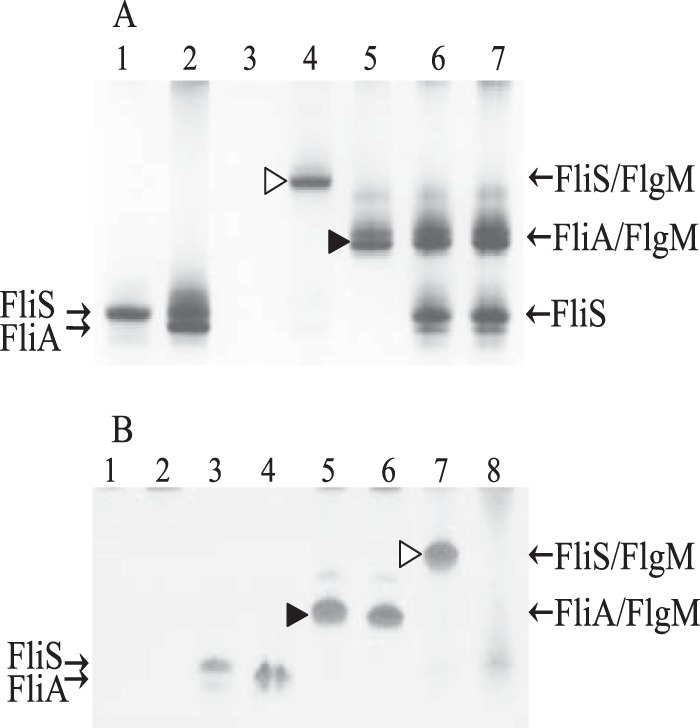
Formation of the complexes detected by native gel electrophoresis. Solid arrowheads indicate the FliA/FlgM complex, and open arrowheads indicate the FliS/FlgM complex. (A) FliA removes FliS from the complex with FlgM. Lanes: 1, FliS; 2, FliA; 3, FlgM; 4 and 5, FliS mixed with FlgM (lane 4) and FliA mixed with FlgM (lane 5) in 1:1 molar ratio; 6 and 7, FliA added to the FliS/FlgM complex (lane 6) and FliS added to the FliA/FlgM complex (lane 7) in a 1:1:1 molar ratio. (B) Truncated FlgM(1–89) does not form a complex with FliS. Lanes: 1, FlgM alone; 5 and 7, FlgM in a complex with FliA (lane 5) or FliS (lane 7); 2, FlgM(1–89) alone; 6 and 8, FlgM(1–89) in a complex with FliA (lane 6) or FliS (lane 8); 3, FliS; 4, FliA.
To confirm that the FliS/FlgM complex cannot be formed in the presence of FliA when all three proteins are mixed in a 1:1:1 ratio, we cross-linked protein mixtures with glutaraldehyde and analyzed the mixtures using SDS-PAGE (Fig. 7). Comparison of FlgM-FliA mixtures with and without glutaraldehyde demonstrated formation of the complex (Fig. 7, lane 7). The complex band also appeared when the mixture of FliS and FlgM was treated with glutaraldehyde (Fig. 7, lane 9). Surprisingly, bands corresponding to both complexes appeared when a mixture of all three proteins was treated with glutaraldehyde (Fig. 7, lane 10). These results indicate that when all three proteins are in a steady state, there probably is an exchange of proteins in the complexes such that FlgM can transiently complex with FliS, even though the gel shift data suggest that the affinity of FliS for FlgM should be lower than that of FliA.
FIG 7.

Cross-linking of FliA, FliS, and FlgM with glutaraldehyde at a 1:1:1 molar ratio. Complex formation was monitored by SDS-PAGE (15% polyacrylamide). Lane 1 contained a mixture of FliA, FliS, and FlgM. Note that in the presence of SDS, FlgM does enter the gel, which it does not do on native gels. Lanes 2 to 11: 2 and 11, protein mass standards (kDa); 3 to 5, FliA, FliS, and FlgM, respectively, after glutaraldehyde (GA) treatment; 6 and 7, mixtures of FliA and FlgM without and with glutaraldehyde treatment, respectively; 8 and 9, mixtures of FliS and FlgM without and with glutaraldehyde treatment, respectively; 10, mixtures of FliA, FliS, and FlgM after glutaraldehyde treatment. Arrows indicate individual proteins. Solid arrowheads indicate the FliA/FlgM complex, and open arrowheads indicate the FliS/FlgM complex.
The cross-linking results were different when the concentration of FlgM was decreased such that FliS/FliA/FlgM molar ratios became 1:1:0.5 and 1:1:0.25 (Fig. 8). Although in the absence of FliA, the band corresponding to the cross-linked FliS/FlgM complex was detected in both cases, no complex can be seen when FliA was present in the 1:1:0.25 mixture. The fainter complex band was seen when the ratio was 1:1:0.5. The band corresponding to the FliA/FlgM complex can be seen at all ratios. We concluded that decreasing concentration of FlgM (and therefore increasing competition between FliS and FliA for FlgM binding) resulted in removal of FliS from the complex.
FIG 8.
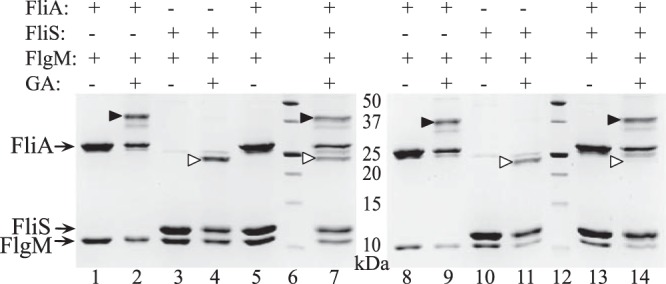
Cross-linking of FliA, FliS, and FlgM with glutaraldehyde at 1:1:0.5 (left gel) and 1:1:0.25 (right gel) molar ratios. Lanes: 1 and 2 and 8 and 9, mixtures of FliA and FlgM without and with glutaraldehyde (GA) treatment, respectively; 3 and 4 and 10 and 11, mixtures of FliS and FlgM without and with glutaraldehyde treatment, respectively; 5 and 7 and 13 and 14, mixtures of FliA, FliS, and FlgM without and with glutaraldehyde treatment; 6 and 12, protein mass standards (kDa). Arrows indicate individual proteins. Solid arrowheads indicate the FliA/FlgM complex, and open arrowheads indicate the position of the FliS/FlgM complex.
Interaction with FliS made FlgM more stable.
FlgM is a mostly disordered protein; therefore, it is very susceptible to proteases. To find out if binding to FliS can stabilize and protect FlgM, we used limited proteolysis. Trypsin was added to solutions of FliS, FlgM, and the FliS/FlgM complex in a 1:200 (wt/wt) ratio. After 30 min, proteolysis was stopped by adding the inhibitor, and samples were analyzed by mass spectrometry (MS). The molecular masses determined by MS for full-length proteins were 14, 684 Da for FliS and 10,435 Da for FlgM. We compared the appearances of proteolytic fragments with molecular masses higher than half of the mass of the corresponding protein (Fig. 9). For FliS both alone and in a complex with FlgM, one fragment with a mass of 8,344 Da was determined; the intensity of the peak determined in the complex treated by trypsin was ∼4-fold higher. This fragment corresponded to residues 61 to 135. The difference in the peak intensities may indicate that this fragment became more protected in the complex; this supports our assumption that FliS binds via its C-terminal region. The only fragment determined in the sample with FlgM treated by trypsin has a molecular mass of 4,059 Da and corresponded to residues 33 to 71. On the contrary, a set of FlgM fragments with masses of 8,568, 6,938, 5,349, and 4,314 Da, which corresponded to residues 19 to 97, 33 to 97, 50 to 97, and 50 to 88, respectively, were determined in the sample with the FliS/FlgM complex treated with trypsin. Based on these data, we concluded that interaction with FliS stabilized FlgM. The C-terminal residues 71 to 97 became more protected; therefore, the interaction should include this region of FlgM.
FIG 9.
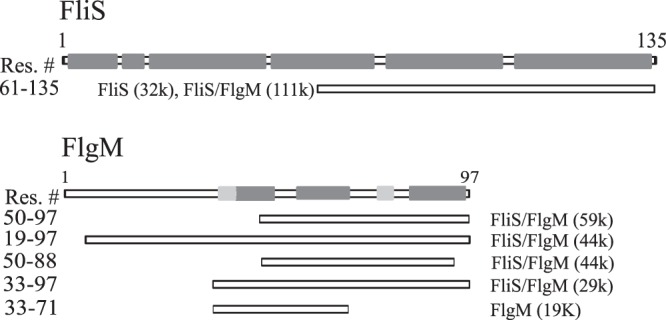
Schematic view of proteolytic fragments determined by mass spectrometry after treatment of FliS, FlgM, and the FliS/FlgM complex with trypsin and arranged according to the peak intensities (shown in parentheses). Dark gray boxes show the positions of α-helices, and light gray boxes show the positions of β-structures.
C-terminal residues of FlgM are crucial for binding FliS but not FliA.
MS data supported our assumption that the C-terminal region of FlgM is responsible for the interaction with FliS. Alignment of FlgM sequences from Aquifex and Salmonella demonstrated that FlgM from S. Typhimurium is seven residues longer at the C terminus. We removed eight C-terminal residues by introducing a stop codon instead of Ala 90, which corresponds to the C-terminal threonine in A. aeolicus. The truncated version of FlgM, FlgM(1–89), was purified, and its interaction with FliS and FliA was tested (Fig. 6B). No complex band was formed when FlgM(1–89) was mixed with FliS, indicating a drastic decrease in affinity. The truncation had no effect on formation of the complex with FliA. Thus, we confirmed that the binding site for FliS is located in the C-terminal region of FlgM. We conclude that while binding sites for FliS and FliA in FlgM may overlap, their exact localizations differ.
Conclusions.
In this study, we investigated interactions between S. Typhimurium FliS and FlgM, proteins that are crucial in regulation of flagellum assembly. Using several different approaches, we demonstrated that these proteins specifically interact to form a 1:1 complex, and this interaction protects FlgM from proteolysis. We showed that the binding site for FliS is located in the C-terminal portion of FlgM and that it is close to or even overlaps the binding site for FliA, a known binding partner of FlgM. We demonstrated that there is no formation of a triple complex, but FliA displaces FliS from the complex with FlgM. However, by cross-linking, we showed that formation of the FliS/FlgM complex can occur even in the presence of FliA. Most probably, FliS and FliA continuously displace one another from FlgM, even though FliA binds more tightly to FlgM than does FliS.
FliS is known to be a negative regulator of FlgM; in FliS null cells, export of FlgM increases. After induction of the flagellar regulon, the expression of the class 2 flgAMN operon occurs prior to induction of the flagellar class 2 fliAZ operon (29). Thus, we expect that initial expression of FlgM occurs before expression of FliA. However, FlgM is not a stable protein. The stabilities of FlgM and σ28 are interdependent (20). We suggest that binding of FlgM by FliS helps to stabilize and preserve FlgM in the cell until FliA is expressed. FliA then removes FliS from the complex. In addition, FliS is expressed from both class 2 and class 3 promoters, while the target of its chaperone activity, FliC, is expressed only from a class 3 promoter. It is possible that FliS and FliC are also interdependent for their stability. Thus, FliS might require FlgM for its stability prior to FliC (or FljB) production.
While we were preparing our manuscript for submission, a study by Xu et al. reporting interactions between FliS and FlgM from Yersinia pseudotuberculosis was published online ahead of print (22). The authors used bacterial two- and three-hybrid assays, glutathione S-transferase (GST) pulldown assays, and FlgM secretion assays to identify orthologous interactions that we present here. These findings are complementary to ours and match each other in that they were performed in an in vivo context, while we worked with purified proteins, albeit in a different organism. These independent findings confirm the biological relevance of this novel interaction.
ACKNOWLEDGMENTS
We thank Irina Mescheryakova for technical assistance, Mikhail Levin for writing a program that generates a list of all possible variants of tryptic fragments, and Steven D. Aird for English editing.
This research was supported by WSU Startup for A.S.K., OIST special funding for F.A.S., RFBR grant 14-04-31502 mol_a for A.G., and PHS grant GM056141 for K.T.H. from the National Institutes of Health.
Footnotes
Published ahead of print 10 January 2014
REFERENCES
- 1.Macnab RM. 1992. Genetics and biogenesis of bacterial flagella. Annu. Rev. Genet. 26:131–158. 10.1146/annurev.ge.26.120192.001023 [DOI] [PubMed] [Google Scholar]
- 2.Berg HC, Anderson RA. 1973. Bacteria swim by rotating their flagellar filaments. Nature 245:380–382. 10.1038/245380a0 [DOI] [PubMed] [Google Scholar]
- 3.Macnab RM. 1999. The bacterial flagellum: reversible rotary propellor and type III export apparatus. J. Bacteriol. 181:7149–7153 [DOI] [PMC free article] [PubMed] [Google Scholar]
- 4.Chevance FF, Hughes KT. 2008. Coordinating assembly of a bacterial macromolecular machine. Nat. Rev. Microbiol. 6:455–465. 10.1038/nrmicro1887 [DOI] [PMC free article] [PubMed] [Google Scholar]
- 5.Kutsukake K, Ohya Y, Iino T. 1990. Transcriptional analysis of the flagellar regulon of Salmonella typhimurium. J. Bacteriol. 172:741–747 [DOI] [PMC free article] [PubMed] [Google Scholar]
- 6.Frye J, Karlinsey JE, Felise HR, Marzolf B, Dowidar N, McClelland M, Hughes KT. 2006. Identification of new flagellar genes of Salmonella enterica serovar Typhimurium. J. Bacteriol. 188:2233–2243. 10.1128/JB.188.6.2233-2243.2006 [DOI] [PMC free article] [PubMed] [Google Scholar]
- 7.Liu X, Matsumura P. 1994. The FlhD/FlhC complex, a transcriptional activator of the Escherichia coli flagellar class II operons. J. Bacteriol. 176:7345–7351 [DOI] [PMC free article] [PubMed] [Google Scholar]
- 8.Nguyen L, Paulsen IT, Tchieu J, Hueck CJ, Saier MH., Jr 2000. Phylogenetic analyses of the constituents of type III protein secretion systems. J. Mol. Microbiol. Biotechnol. 2:125–144 [PubMed] [Google Scholar]
- 9.Blocker A, Komoriya K, Aizawa S. 2003. Type III secretion systems and bacterial flagella: insights into their function from structural similarities. Proc. Natl. Acad. Sci. U. S. A. 100:3027–3030. 10.1073/pnas.0535335100 [DOI] [PMC free article] [PubMed] [Google Scholar]
- 10.Kostyukova AS, Pyatibratov MG, Filimonov VV, Fedorov OV. 1988. Flagellin parts acquiring a regular structure during polymerization are disposed on the molecule ends. FEBS Lett. 241:141–144. 10.1016/0014-5793(88)81047-0 [DOI] [PubMed] [Google Scholar]
- 11.Fedorov OV, Kostyukova AS, Pyatibratov MG. 1988. Architectonics of a bacterial flagellin filament subunit. FEBS Lett. 241:145–148. 10.1016/0014-5793(88)81048-2 [DOI] [PubMed] [Google Scholar]
- 12.Auvray F, Thomas J, Fraser GM, Hughes C. 2001. Flagellin polymerisation control by a cytosolic export chaperone. J. Mol. Biol. 308:221–229. 10.1006/jmbi.2001.4597 [DOI] [PMC free article] [PubMed] [Google Scholar]
- 13.Ozin AJ, Claret L, Auvray F, Hughes C. 2003. The FliS chaperone selectively binds the disordered flagellin C-terminal D0 domain central to polymerisation. FEMS Microbiol. Lett. 219:219–224. 10.1016/S0378-1097(02)01208-9 [DOI] [PubMed] [Google Scholar]
- 14.Muskotal A, Kiraly R, Sebestyen A, Gugolya Z, Vegh BM, Vonderviszt F. 2006. Interaction of FliS flagellar chaperone with flagellin. FEBS Lett. 580:3916–3920. 10.1016/j.febslet.2006.06.024 [DOI] [PubMed] [Google Scholar]
- 15.Ohnishi K, Kutsukake K, Suzuki H, Lino T. 1992. A novel transcriptional regulation mechanism in the flagellar regulon of Salmonella typhimurium: an antisigma factor inhibits the activity of the flagellum-specific sigma factor, sigma F. Mol. Microbiol. 6:3149–3157. 10.1111/j.1365-2958.1992.tb01771.x [DOI] [PubMed] [Google Scholar]
- 16.Ohnishi K, Kutsukake K, Suzuki H, Iino T. 1990. Gene fliA encodes an alternative sigma factor specific for flagellar operons in Salmonella typhimurium. Mol. Gen. Genet. 221:139–147 [DOI] [PubMed] [Google Scholar]
- 17.Gillen KL, Hughes KT. 1991. Molecular characterization of flgM, a gene encoding a negative regulator of flagellin synthesis in Salmonella typhimurium. J. Bacteriol. 173:6453–6459 [DOI] [PMC free article] [PubMed] [Google Scholar]
- 18.Karlinsey JE, Tanaka S, Bettenworth V, Yamaguchi S, Boos W, Aizawa SI, Hughes KT. 2000. Completion of the hook-basal body complex of the Salmonella typhimurium flagellum is coupled to FlgM secretion and fliC transcription. Mol. Microbiol. 37:1220–1231. 10.1046/j.1365-2958.2000.02081.x [DOI] [PubMed] [Google Scholar]
- 19.Yokoseki T, Iino T, Kutsukake K. 1996. Negative regulation by fliD, fliS, and fliT of the export of the flagellum-specific anti-sigma factor, FlgM, in Salmonella typhimurium. J. Bacteriol. 178:899–901 [DOI] [PMC free article] [PubMed] [Google Scholar]
- 20.Aldridge PD, Karlinsey JE, Aldridge C, Birchall C, Thompson D, Yagasaki J, Hughes KT. 2006. The flagellar-specific transcription factor, sigma28, is the type III secretion chaperone for the flagellar-specific anti-sigma28 factor FlgM. Genes Dev. 20:2315–2326. 10.1101/gad.380406 [DOI] [PMC free article] [PubMed] [Google Scholar]
- 21.Daughdrill GW, Chadsey MS, Karlinsey JE, Hughes KT, Dahlquist FW. 1997. The C-terminal half of the anti-sigma factor, FlgM, becomes structured when bound to its target, sigma 28. Nat. Struct. Biol. 4:285–291. 10.1038/nsb0497-285 [DOI] [PubMed] [Google Scholar]
- 22.Xu S, Peng Z, Cui B, Wang T, Song Y, Zhang L, Wei G, Wang Y, Shen X. 25 July 2013. FliS modulates FlgM activity by acting as a non-canonical chaperone to control late flagellar gene expression, motility and biofilm formation in Yersinia pseudotuberculosis. Environ. Microbiol. 10.1111/1462-2920.12222 [DOI] [PubMed] [Google Scholar]
- 23.Studier FW. 2005. Protein production by auto-induction in high density shaking cultures. Protein Expr. Purif. 41:207–234. 10.1016/j.pep.2005.01.016 [DOI] [PubMed] [Google Scholar]
- 24.Kostyukova AS, Hitchcock-Degregori SE, Greenfield NJ. 2007. Molecular basis of tropomyosin binding to tropomodulin, an actin-capping protein. J. Mol. Biol. 372:608–618. 10.1016/j.jmb.2007.05.084 [DOI] [PMC free article] [PubMed] [Google Scholar]
- 25.Moroz N, Guillaud L, Desai B, Kostyukova AS. 2013. Mutations changing tropomodulin affinity for tropomyosin alter neurite formation and extension. PeerJ 1:e7. 10.7717/peerj.7 [DOI] [PMC free article] [PubMed] [Google Scholar]
- 26.Evdokimov AG, Phan J, Tropea JE, Routzahn KM, Peters HK, Pokross M, Waugh DS. 2003. Similar modes of polypeptide recognition by export chaperones in flagellar biosynthesis and type III secretion. Nat. Struct. Biol. 10:789–793. 10.1038/nsb982 [DOI] [PubMed] [Google Scholar]
- 27.Sorenson MK, Ray SS, Darst SA. 2004. Crystal structure of the flagellar sigma/anti-sigma complex sigma(28)/FlgM reveals an intact sigma factor in an inactive conformation. Mol. Cell 14:127–138. 10.1016/S1097-2765(04)00150-9 [DOI] [PubMed] [Google Scholar]
- 28.Chadsey MS, Karlinsey JE, Hughes KT. 1998. The flagellar anti-sigma factor FlgM actively dissociates Salmonella typhimurium sigma28 RNA polymerase holoenzyme. Genes Dev. 12:3123–3136. 10.1101/gad.12.19.3123 [DOI] [PMC free article] [PubMed] [Google Scholar]
- 29.Kalir S, McClure J, Pabbaraju K, Southward C, Ronen M, Leibler S, Surette MG, Alon U. 2001. Ordering genes in a flagella pathway by analysis of expression kinetics from living bacteria. Science 292:2080–2083. 10.1126/science.1058758 [DOI] [PubMed] [Google Scholar]


