

Abstract
Echinocandins are the recommended treatment for invasive candidiasis due to Candida glabrata. Resistance to echinocandins is known to be caused by nonsynonymous mutations in the hot spot-1 (HS1) regions of the FKS1 and FKS2 genes, which encode a subunit of the β-1,3-glucan synthase, the target of echinocandins. Here, we describe the development of a microsphere-based assay using Luminex MagPix technology to identify mutations in the FKS1 HS1 and FKS2 HS1 domains, which confer in vitro echinocandin resistance in C. glabrata isolates. The assay is rapid and can be performed with high throughput. The assay was validated using 102 isolates that had FKS1 HS1 and FKS2 HS1 domains previously characterized by DNA sequencing. The assay was 100% concordant with DNA sequencing results. The assay was then used for high-throughput screening of 1,032 C. glabrata surveillance isolates. Sixteen new isolates with mutations, including a mutation that was new to our collection (del659F), were identified. This assay provides a rapid and cost-effective way to screen C. glabrata isolates for echinocandin resistance.
INTRODUCTION
Candida glabrata is the second most frequent cause of invasive candidiasis in the United States (1, 2). With a large proportion of isolates resistant to fluconazole, echinocandins are the treatment of choice recommended by the Infectious Disease Society of America for candidemia caused by C. glabrata (3). However, as has happened with fluconazole, increased usage of echinocandins has demonstrated the ability of C. glabrata to occasionally develop resistance (4–10). With echinocandins recommended for use as empirical therapy for C. glabrata infections in U.S. hospitals, rapid identification of isolates which may be echinocandin resistant has increasing clinical relevancy.
Echinocandins alter the integrity of the fungal cell wall by inhibiting the activity of β-1,3-glucan synthase (11, 12). Resistance to echinocandins in C. glabrata is caused by amino acid mutations in the hot spot 1 (HS1) regions of the Fks1 and Fks2 proteins, which encode β-1,3-glucan synthase subunits. A number of mutations in Fks1 HS1 and Fks2 HS1 domains that attenuate the susceptibility to echinocandins have been identified in recent years. Isolates with the amino acid substitutions S629P, R631G, and D632V/G/E/Y in Fks1-HS1 and F659Y/S, S663P/F, R665G, D666V/G/E, and P667H/T in Fks2 HS1 display elevated in vitro MIC values for the echinocandins (8, 13). Moreover, patients who harbor isolates with one or more of these mutations generally fail echinocandin therapy (7, 9, 14, 15).
DNA sequencing has been the only technique available for identification of mutations in FKS1 and FKS2. Although it is highly informative and accurate, DNA sequencing is also costly and time-consuming. In recent years, microsphere-based technology has become an attractive alternative to DNA sequencing. This technology had been applied for species identification in molds and yeasts (16–20) and for the identification of single nucleotide polymorphisms (SNPs) (21, 22). Here, we describe the adaptation of this technology to identify SNPs in the FKS1 HS1 and FKS2 HS1 domains of C. glabrata which confer in vitro resistance to echinocandins. Probes were developed to detect 11 known mutations in FKS1 HS1 and FKS2 HS1. We also developed probes to detect wild-type sequences at these domains; a lack of binding to the wild-type probes allows identification of new mutations. The probes were used to screen a library of 1,290 C. glabrata isolates.
MATERIALS AND METHODS
Candida glabrata culture and DNA extraction.
All C. glabrata isolates employed in this study were obtained from patients diagnosed with candidemia as part of a population-based active surveillance program (23). The species were determined molecularly as previously described (1).
Design of FKS primers and probes.
The hot spot 1 regions of both FKS1 and FKS2 genes were sequenced using the primer sets described by Zimbeck and colleagues (8). Primers for the MagPix assay were designed using OligoPerfect Designer, an online-based software provided by Life Technologies (https://tools.lifetechnologies.com/content.cfm?pageid=9716&icid=fr-oligo-6; New York, NY). The FKS1 hot spot 1 region was amplified using the MgPxCgF1H1-F (5′-TCA AAC CTT CAC TGC CTC CT-3′) and the BtMgPxCgF1H1-R (5′-TTT GAT TGA TGT CTA CAT AGC TTT-3′) primer pair, while the FKS2 hot spot 1 region was amplified using the MgPxCgF2H1-F (5′-TCT TTT GCC CCA TTA CAA GG-3′) and the BtMgPxCgF2H1-R (5′-AAC CCC ACC AAT ACT CAC CA-3′) primer pair. BtMgPxCgF1H1-R and BtMgPxCgF2H1-R were both biotinylated at the 5′ end. All probes used in this study for the detection of single nucleotide polymorphisms (SNPs) within the FKS1 HS1 and the FKS2 HS1 were designed based on the guidelines established by Luminex Corporation (Austin, TX), including coupling an amino group to the 5′ end of the oligonucleotide by a 12-carbon spacer. The probes were designed to complement the product of the biotinylated “reverse” primers. All primers and probes used in this study were synthesized in the Biotechnology Core Facility at the Centers for Disease Control and Prevention (CDC).
Cross-linking of FKS probes to the microspheres.
Carboxylated paramagnetic microspheres from Luminex Corporation were covalently linked to the specific probe as instructed by the manufacturer with minor modifications. The probe was titrated against a fixed number of microspheres in order to determine the appropriate amount of probe for the coupling process. The following conditions were used to cross-link the probes to the microspheres following determination of the optimal ratio of probe to microspheres. Approximately 5 × 10⁶ microspheres were transferred to a low-binding microcentrifuge tube. The microsphere storage buffer was removed after 3 min of centrifugation at 6,000 × g. After decanting of the microsphere storage buffer, 50 μl of 100 mM 2-(N-morpholino)ethanesulfonic acid (MES), 6 μl of 50 μM, or 300 pmol of amine-linked probe and 10 μl of the 1-ethyl-3-(3-dimethylaminothe propyl)carbodiimide hydrochloride (EDC) catalyst were successively added to the microsphere pellet. The reaction was briefly mixed, covered, and incubated at 25°C with constant shaking at 4,000 rpm for 30 min. Then, a second addition of 10 μl of EDC was followed by another round of 30 min of incubation at 25°C in the dark with constant agitation at 4,000 rpm. EDC was freshly prepared each time by dissolving EDC powder in sterile distilled water to obtain a 10 mg/ml concentration solution. The reaction was terminated by adding 1 ml of 0.02% Tween 20 followed by brief vortex mixing, 2 min of centrifugation at 6,000 × g, and removal of the supernatant. The microspheres were then washed once with 1 ml of 0.1% SDS. After brief vortex mixing and 2 min of centrifugation at 6,000 × g, the supernatant was aspirated and the coupled microspheres were resuspended in 100 μl of Tris-EDTA (TE) buffer.
FKS hot spot mutation detection and validation.
For the detection of SNPs within the FKS1 HS1 and FKS2 HS1 regions, we employed asymmetrical PCRs primed by the hemibiotinylated primer pairs to amplify the hot spot regions and probed with the microsphere-conjugated probes described above. Asymmetrical PCRs were conducted by combining 2 pmol of the forward and 16 pmol of the reverse PCR primers (1:8 ratio), 3 nmol of each dNTP (Roche, Basel, Switzerland), 0.9 μl of dimethyl sulfoxide, 3 μl of 10× PCR buffer with MgCl2 (Roche), 0.15 U of Taq polymerase (Roche), 2 μl of DNA template, and sterile double-distilled water in a 30-μl reaction. In order to increase the throughput of this assay, PCR was carried out in a 96-well plate format. DNA amplification of the target regions was conducted with the following cycling conditions: 94°C for 5 min; 40 cycles consisting of 94°C for 30 s, 52°C for 30 s, and 72°C for 30 s; and a final extension at 72°C for 2 min. PCR products were visualized by ethidium bromide gel electrophoresis prior to their hybridization with the microsphere-conjugated probes.
Hybridization of the probe to its target was accomplished as described previously by Etienne and coworkers (17) with minor modifications. For probe-binding optimization, 10 μl of the PCR product, 7 μl of TE buffer, and 33 μl of 1.5× tetramethylammonium chloride (TMAC) buffer that contained ∼3,960 microspheres on each microsphere-conjugated probe were mixed in a tube. For the high-throughput screening of the C. glabrata collection, 17 μl of the PCR product was mixed with 33 μl of microsphere-conjugated probes in TMAC buffer. Each DNA mixture was subjected to denaturation by heating the reaction at 95°C for 5 min and annealing for 30 min at 48°C for FKS1 or at 52°C for FKS2. Immediately after the annealing step, the reaction mixture was centrifuged for 2 min at 1000 × g, and the supernatant was carefully removed without disturbing the microspheres. The hybrid DNA product was resuspended in 75 μl of 1× TMAC buffer that contained 0.3 μg of streptavidin-R-phycoerythrin (Life Technologies). The reaction was transferred to the MagPix system for signal acquisition.
Assay signal acquisition and data analysis.
The signal generated by the interaction between the probe and its target was captured using the MagPix system and xPONENT 4.2 software (Luminex Corporation). Prior to signal acquisition, the reaction mixture was incubated for 10 min at either 48°C for FKS1 or 52°C for FKS2. The fluorescence intensity of 50 microspheres per probe was captured by MagPix to generate the median fluorescence intensity (MFI). All MagPix assays containing unknown isolates were run with reference isolates and a no-template control. The FKS1 HS1 and FKS2 HS1 profiles for a particular isolate were assigned according to the highest net MFI (probe signal minus background signal) of >250. Data were considered unreliable if the net MFI for reference isolates were <250.
RESULTS
FKS probes and amplicons.
For FKS1 HS1, four unique probes to detect the three nonsynonymous mutations at T1885C (CgMgPxF1H1-S629P), A1891G (CgMgPxF1H1-R631G), and A1895T (CgMgPxF1H1-D632V) and the synonymous mutation at C1875T (CgMgPxF1H1-SmT) were designed (Fig. 1). Two probes, CgMgPxF1H1-SmC and CgMgPxF1H1-WT1, were created to detect wild-type FKS1 HS1. All FKS1 HS1 probes contain only one SNP that corresponds to each mutation except for FKS1 D632V; there was a lower nonspecific signal when the last nucleotide was changed from an adenosine to a thymidine (data not shown). The G-C content for FKS1 HS1 probes is between 25 and 36.8% with a melting temperature (Tm) between 47.7 and 51.8°C and an average Tm of 50°C.
FIG 1.
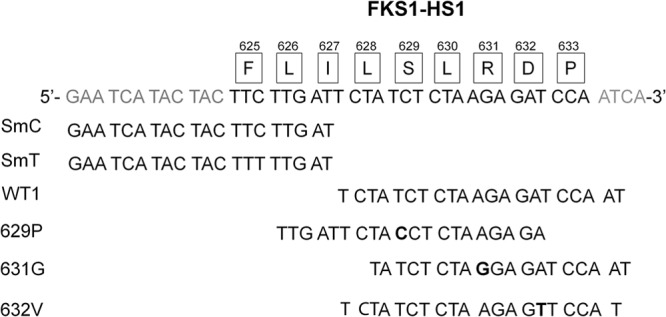
Schematic diagram of the FKS1 HS1 region and the corresponding probes designed to detect it. The amino acids comprising the hot spot region are shown boxed directly above the corresponding codon. The nucleotides encoding the mutations detected in this assay are shown in bold type.
Nine different probes to detect the wild-type copy and the mutant copies of FKS2 HS1 were constructed (Fig. 2). For FKS2 HS1, the domain was divided into two parts at the 12th nucleotide. The three probes that cover the first part of the FKS2 HS1 domain are CgMgPxF2H1-F659S and CgMgPxF2H1-F659Y and their wild-type counterpart, CgMgPxF2H1-WT1. These probes cover 9 nucleotides upstream and the first 11 nucleotides of the domain. The probes within the second part of the domain are CgMgPxF2H1-R665G, CgMgPxF2H1-D666V, and CgMgPxF2H1-P667H and their wild-type counterpart, CgMgPxF2H1-WT2. These probes encompass the last 15 nucleotides. The third set of probes, CgMgPxF2H1-S663P and CgMgPxF2H1-S663F, stretch from the 4th to the 23rd nucleotides. All FKS2 HS1 probes contain only one SNP and their G-C composition is between 25 and 47.4%. The Tm for FKS2 HS1 probes is between 51.2 and 57.2°C, with an average Tm of 53.4°C.
FIG 2.
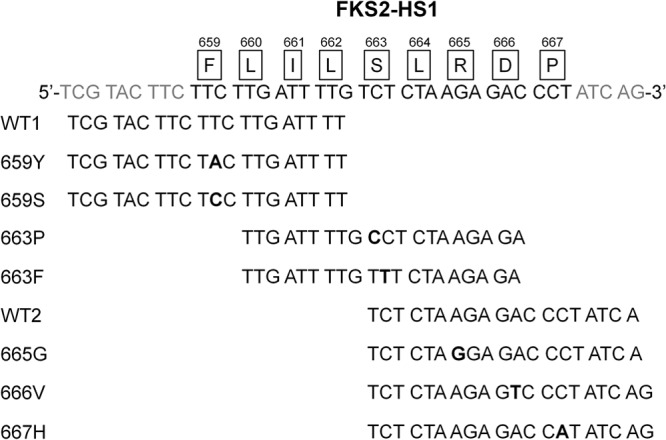
Schematic diagram of the FKS2 HS1 region and the corresponding probes designed to detect it. The amino acids comprising the hot spot region are shown boxed directly above the corresponding codon. The nucleotides encoding the mutations detected in this assay are shown in bold type.
The targets for the FKS probes were generated using asymmetrical PCRs. The selected FKS1 HS1 and FKS2 HS1 primer sets in our assay generate PCR product sizes of 213 and 172 nucleotides, respectively. Cross-amplification of the two FKS genes for these two primer sets was not observed. The interaction between the probe and the target is also dependent on the availability of the target. A number of forward/reverse primer ratios were tested, and the 1-to-8 primer ratio gave the best signal and was chosen for the assay (data not shown).
FKS probes demonstrated discriminatory affinity for their targets.
The goal of the project was to design the capture probes for a multiplex assay that would allow the rapid detection of SNPs that are known to confer resistance to one or more echinocandins. The probes' affinities for their targets were determined by using a panel of reference isolates with known FKS mutations. The FKS1 HS1 probes were tested against four isolates in which an FKS1 HS1 mutation had been identified by DNA sequencing. Each probe showed a specific affinity for its preferential target when hybridized at 48°C (Table 1). The CgMgPxF1H1-SmT probe displayed the highest average MFI at 5,342 ± 106 and the CgMgPxF1H1-R631G showed the lowest average MFI at 771 ± 83 for their respective targets (Table 2). All of the SNP probes displayed at least 100-fold higher specific signal than nonspecific signal. The two wild-type probes showed some affinities for the SNP targets, although significantly lower than those for the wild-type targets. We also tested the FKS1 HS1 probes against 28 different products of FKS2 HS1 with or without mutations. The average MFI for any probe against the FKS2 HS1 target was <200, which is in the negligible range (data not shown).
TABLE 1.
FKS1 HS1 and FKS2 HS1 capture probes designed for this studya
| Probe name | Probe sequence | ntb | G-C (%) | Tm (°C) |
|---|---|---|---|---|
| CgMgPxF1H1-WT1 | TCTATCTCTAAGAGATCCAAT | 21 | 33.3 | 51.8 |
| CgMgPxF1H1-SmC | GAATCATACTACTTCTTGAT | 20 | 30.0 | 47.7 |
| CgMgPxF1H1-SmT | GAATCATACTACTTTTTGAT | 20 | 25.0 | 48.0 |
| CgMgPxF1H1-S629P | TTGATTCTACCTCTAAGAGA | 20 | 35.0 | 51.2 |
| CgMgPxF1H1-R631G | TATCTCTAGGAGATCCAAT | 19 | 36.8 | 50.6 |
| CgMgPxF1H1-D632V | TCTATCTCTAAGAGTTCCAT | 20 | 35.0 | 50.1 |
| CgMgPxF2H1-WT1 | TCGTACTTCTTCTTGATTTT | 20 | 30.0 | 53.8 |
| CgMgPxF2H1-F659Y | TCGTACTTCTACTTGATTTT | 20 | 30.0 | 51.3 |
| CgMgPxF2H1-F659S | TCGTACTTCTCCTTGATTTT | 20 | 35.0 | 56.1 |
| CgMgPxF2H1-S663P | TTGATTTTGCCTCTAAGAGA | 20 | 35.0 | 57.2 |
| CgMgPxF2H1-S663F | TTGATTTTGTTTCTAAGAGA | 20 | 25.0 | 52.2 |
| CgMgPxF2H1-R665G | TCTCTAGGAGACCCTATCA | 19 | 47.4 | 54.3 |
| CgMgPxF2H1-D666V | TCTCTAAGAGTCCCTATCAG | 20 | 45.0 | 53.2 |
| CgMgPxF2H1-P667H | TCTCTAAGAGACCATATCAG | 20 | 40.0 | 51.4 |
| CgMgPxF2H1-WT2 | TCTCTAAGAGACCCTATCA | 19 | 42.1 | 51.7 |
Probe properties were assessed using Multiple primer analyzer from Thermo Scientific (see http://www.thermoscientificbio.com/webtools/multipleprimer/).
nt, nucleotides.
TABLE 2.
MFI values for each of the probes used for FKS1 HS1a
| C. glabrata isolate | MFI (average ± SE) with probe: |
|||||
|---|---|---|---|---|---|---|
| CgMgPxF1H1-SmC | CgMgPxF1H1-SmT | CgMgPxF1H1-WT1 | CgMgPxF1H1-S629P | CgMgPxF1H1-R631G2 | CgMgPxF1H1-D632V | |
| Reference-WT | 2,487 ± 367 | 379 ± 75 | 1,081 ± 207 | (−)22 ± 2 | (−)8 ± 11 | 49 ± 12 |
| Reference-S629P | 1,245 ± 72 | 5,342 ± 106 | 1,538 ± 15 | 3,095 ± 133 | (−)7 ± 11 | (−)30 ± 15 |
| Reference-R631G | 2,669 ± 91 | 360 ± 42 | 64 ± 24 | (−)25 ± 24 | 771 ± 83 | (−)27 ± 23 |
| Reference-D632V | 1,077 ± 406 | 4,545 ± 1,123 | 845 ± 342 | 22 ± 19 | (−)5 ± 6 | 3,736 ± 691 |
Values represent three replicates with the value against the correctly corresponding sequence in bold type.
The FKS2 HS1 probes were tested against eight isolates in which an FKS2 HS1 mutation had been identified by DNA sequencing (Table 3). Each of the probes showed a preferential and robust affinity for its target when hybridized at 52°C. The CgMgPxF2H1-WT1 probe displayed the highest average MFI at 5,437 ± 511, while the CgMgPxF2H1-R665G probe showed the lowest average MFI for its respective target at 778 ± 374. The CgMgPxF2H1-S663P/F, -R665G, and -D666V probes displayed at least 100-fold higher specific signals than nonspecific signals, while the other probes showed at least 2.5-fold higher signals. We also tested the FKS2 HS1 probes against 28 different targets of FKS1 HS1 with or without mutations. They showed no affinity for the FKS1 HS1 domain products (data not shown).
TABLE 3.
MFI values for each of the probes used for FKS2 HS1a
| Isolate mutation | Average MFI (average ± SE) with probe: |
||||||||
|---|---|---|---|---|---|---|---|---|---|
| CgMgPxF2H1-WT1 | CgMgPxF2H1-F659Y | CgMgPxF2H1-F659S | CgMgPxF2H1-S663P | CgMgPxF2H1-S663F | CgMgPxF2H1-R665G | CgMgPxF2H1-D666V | CgMgPxF2H1-P667H | CgMgPxF2H1-WT2 | |
| RefFKS2-WT | 4,899 ± 1,354 | 1,385 ± 721 | 841 ± 497 | (−)20 ± 12 | (−)78 ± 20 | (−)97 ± 41 | 46 ± 101 | 108 ± 120 | 1,209 ± 603 |
| RefFKS2-F659Y | 1,054 ± 308 | 3,673 ± 494 | 259 ± 88 | 17 ± 25 | (−)60 ± 20 | (−)99 ± 36 | 61 ± 41 | 107 ± 45 | 1,069 ± 374 |
| RefFKS2-F659S | 1,120 ± 470 | 1,750 ± 534 | 4,151 ± 654 | (−)32 ± 9 | (−)82 ± 6 | (−)95 ± 36 | 34 ± 91 | 94 ± 108 | 1,091 ± 470 |
| RefFKS2-S663P | 5,189 ± 987 | 1,098 ± 418 | 689 ± 310 | 3,391 ± 741 | (−)94 ± 9 | (−)47 ± 27 | 232 ± 108 | 378 ± 182 | 2,365 ± 694 |
| RefFKS2-S663F | 5,437 ± 511 | 1,045 ± 275 | 695 ± 241 | (−)51 ± 14 | 3,071 ± 287 | (−)86 ± 79 | 92 ± 97 | 164 ± 97 | 1,782 ± 402 |
| RefFKS2-R665G | 5,024 ± 1221 | 1,211 ± 506 | 693 ± 320 | (−)67 ± 9 | (−)124 ± 10 | 778 ± 374 | (−)132 ± 4 | (−)121 ± 19 | 170 ± 117 |
| RefFKS2 D665V | 3,950 ± 66 | 635 ± 82 | 256 ± 36 | 111 ± 29 | 89 ± 38 | (−)158 ± 37 | 3,938 ± 157 | (−)86 ± 10 | 50 ± 25 |
| RefFKS2-P665H | 2,630 ± 453 | 261 ± 122 | 33 ± 29 | (−)30 ± 7 | (−)105 ± 9 | (−)201 ± 58 | (−)144 ± 45 | 1,359 ± 366 | (−)158 ± 37 |
Values represent three replicates with the value against the correctly corresponding sequence in bold type.
FKS SNP detection validation and high-throughput screening.
After the binding affinity for the probes and the parameters for the MagPix assay were established, we used the assay to screen a collection of C. glabrata isolates for mutations in the hot spot 1 regions of FKS1 and FKS2. We first validated the assay by testing all of the isolates for which both FKS1 HS1 and FKS2 HS1 had been previously sequenced (102 isolates; 70 wild-type, 5 S629P, 3 R631G, 1 R631G and D666V double mutant, 1 D632V, 2 F659Y, 1 F659S, 15 S663P, 2 S663F, 1 R665G, and 1 P667H). The MagPix assay results were 100% concordant with the DNA sequencing profile of these 102 isolates. All of the mutations were correctly identified, and all of the wild-type isolates were identified as wild type.
Following validation, we initiated high-throughput screening of an additional collection of 1,032 C. glabrata isolates from the surveillance study. The screen identified 11 additional isolates with nonsynonymous mutations (2 S629P/D666V double mutants, 3 F659Y, and 6 S663P) in either FKS1 HS1 or FKS2 HS1. In addition, five isolates displayed an irregular FKS2 HS1 probe signal pattern. Because wild-type probes were included with each screen, our assay was able to facilitate the discovery of three isolates with the del659F mutation, a deletion of the phenylalanine adjacent to the phenylalanine at the beginning of FKS2 HS1. This mutation was not included in our original assay but does confer echinocandin resistance (10, 13). The other two isolates had the S663P mutation in addition to a silent mutation at G1986A. All of the mutations identified by the MagPix assay were confirmed to be present by DNA sequencing of the corresponding region.
DISCUSSION
Single nucleotide polymorphisms that alter the amino acid sequence in the HS1 domain of FKS1 or FKS2 of C. glabrata isolates render the isolates resistant to echinocandins. To facilitate detection of these mutations we developed a Luminex probe-based assay for the rapid and high-throughput identification of such SNPs. The probes were validated with a set of isolates which had previously been sequenced at both the FKS1 HS1 and FKS2 HS1 loci. In addition, the new assay was used for high-throughput screening of a collection of C. glabrata isolates.
Two sets of probes were constructed for the detection of SNPs in FKS1 HS1 and FKS2 HS1. All probes showed adequate discriminatory binding for their respective target, but probes with the SNPs located at or near the ends of the probe showed some cross-binding. An example is CgMgPxF1H1-WT1, which showed strong binding to both the S629P and D632V targets because both SNPs are located five to six nucleotides from the end of that probe. Likewise, CgMgPxF2H1-WT2 showed affinity for the S663P/S663F targets because these SNPs are located within the last two nucleotides of that probe. However, the predictive power for these probes improved considerably when they were pooled because the difference in binding was significant. For the FKS1 HS1 probe set, the specific MFI signal was at least twice the highest nonspecific signal for any target. This is also true for the FKS2 HS1 probe set and their targets, with the exception of the probe for the most common mutation, S663P. The specific MFI signal is at least 0.5-fold higher than the highest nonspecific signal (CgMgPxF2H1-WT2) and in every case was higher than the wild-type signal. Additionally, neither probe set showed any cross-affinity for heterologous targets. This is interesting since the two HS domains share very high sequence identity at both the nucleotide and amino acid levels.
The most important parameter of the assay is the MFI. The MFI is dependent upon the interaction between the probe and the target. Several factors affect this interaction. First, the abundance with availability of the target is essential for achieving a high MFI. This was optimized by asymmetrical PCRs. The probes complement the biotinylated PCR product so 8-fold more biotinylated primer than the nonbiotinylated primer was used. This generated more single-stranded target for the probe to bind. The second factor that affects the MFI is probe accessibility. Therefore, it was essential that we determined the optimal probe/microsphere ratio when we conjugated the probes to the microspheres. The ratio of ∼3 pmol of probe per 50,000 microspheres gave the best signal. In addition to target and probe quantities, the length of the target and the nucleotide composition of the probe also affect MFI. For FKS1 HS1, three different amplicons were tested before one was found that would give an adequate MFI signal for all FKS1 HS1 probes. In addition, the G-C content of the probe greatly affects the MFI. This observation becomes more apparent in a comparison of the MFI of CgMgPxF1H1-SmC and CgMgPxF1H1-SmT or those of CgMgPxF2H1-R665G and CgMgPxF2H1-WT2. The MFI for CgMgPxF1H1-SmC and CgMgPxF2H1-R665G are lower than those for their counterpart probes because they both have a higher G-C content. This would explain why CgMgPxF2H1-R631G and CgMgPxF2H1-R665G displayed the lowest MFI. Lastly, it is critical to optimize the probe-target hybridization temperature. A high hybridization temperature tends to decrease the MFI, while a low hybridization temperature decreases the signal/noise ratio. The optimal hybridization temperatures for FKS1 HS1 and FKS2 HS1 probes were 48°C and 52°C, respectively, about 1 to 2°C below their average Tm values.
The multiplex FKS MagPix assay developed here was highly accurate. The assay correctly identified all 102 isolates in which the profiles for both HS1 domains were known, and the results were 100% concordant with those for DNA sequencing. This assay might be an alternative to sequencing for those labs which already have the Luminex technology. Using this assay, we derived the mutational profiles to both FKS1 HS1 and FKS2 HS1 for 1,032 isolates in only a matter of days. From our C. glabrata collection, we identified five mutant isolates that were subsequently shown to have elevated echinocandin MIC values.
One minor weakness of this assay is that it can only identify known mutations in FKS1 HS1 and FKS2 HS1. For example, the assay poorly identified two isolates in which the FKS2 HS1 contained a previously unknown silent mutation juxtaposed to the S663P mutation. To alleviate this problem, two sets of wild-type probes, separated along the target region, were included in each assay. If there was an unknown mutation, the signal for one of the wild-type probes would remain high, while the other would drop. An unknown mutation was identified based on the signal pattern generated by the inclusion of multiple wild-type probes. Although the probes were not optimized to detect the del659F mutation (10, 13), it was identified by analyzing the CgMgPxF2H1-WT1 and CgMgPxF2H1-WT2 signal ratios. The CgMgPxF2H1-WT1 signal was typically at least 2-fold higher than that of CgMgPxF2H1-WT2. However, for the del659F mutant, the signals for these two probes were reversed. In subsequent sequencing of the FKS genes of C. glabrata isolates with elevated echinocandin MICs, no mutations were detected in HS2; therefore, it was not included in this assay. Although these new mutations were not identified by the assay, the isolates were identified as non-wild type.
The multiplex FKS MagPix assay is rapid and highly versatile. The FKS1 HS1 and FKS2 HS1 profiles of up to 95 isolates can be determined in as few as 5 h. Unlike DNA sequencing, MagPix data were easy to analyze, and allele profiles could easily be assigned. The assay is highly adaptable to low- or high-throughput formats. New mutations can easily be incorporated into the existing assay although some optimization would be necessary. This assay was designed for and can be used to detect echinocandin resistance in C. glabrata isolates very rapidly and could be helpful in early therapy decisions.
ACKNOWLEDGMENTS
We thank Stacey Ahn and Jason Arne for their assistance with the development of this assay. We also acknowledge the candidemia surveillance group, Joyce Peterson, Shirley McClinton, Angela Cleveland, Ben Park, Mary Brandt, and Tom Chiller at the Centers for Disease Control and Prevention; Monica Farley, Betsy Stein, and the hospitals in Georgia Health District 3; Lee Harrison, Rosemary Hollick, and the Baltimore surveillance hospitals; William Shaffner, Caroline Graber, and the Knoxville surveillance hospitals; and Zintars Beldavs, Magdalena Kendall, and the Portland surveillance hospitals for submission of isolates.
Merck provided funding to the CDC Foundation to support this work.
The findings and conclusions of this article are those of the authors and do not necessarily represent the views of the Centers for Disease Control and Prevention.
Footnotes
Published ahead of print 18 December 2013
REFERENCES
- 1.Lockhart SR, Iqbal N, Cleveland AA, Farley MM, Harrison LH, Bolden C, Baughman W, Stein B, Hollick R, Park B, Chiller T. 2012. Species identification and antifungal susceptibility testing of Candida bloodstream isolates from population-based surveillance in two US cities: 2008-2011. J. Clin. Microbiol. 50:3435–3442. 10.1128/JCM.01283-12 [DOI] [PMC free article] [PubMed] [Google Scholar]
- 2.Pfaller MA, Moet GJ, Messer SA, Jones RN, Castanheira M. 2011. Geographic variations in species distribution and echinocandin and azole antifungal resistance rates among Candida bloodstream infection isolates: report from the SENTRY Antimicrobial Surveillance Program (2008 to 2009). J. Clin. Microbiol. 49:396–399. 10.1128/AAC.00570-11 [DOI] [PMC free article] [PubMed] [Google Scholar]
- 3.Pappas PG, Kauffman CA, Andes D, Benjamin DK, Jr, Calandra TF, Edwards JE, Jr, Filler SG, Fisher JF, Kullberg BJ, Ostrosky-Zeichner L, Reboli AC, Rex JH, Walsh TJ, Sobel JD, Infectious Diseases Society of America 2009. Clinical practice guidelines for the management of candidiasis: 2009 update by the Infectious Diseases Society of America. Clin. Infect. Dis. 48:503–535. 10.1086/596757 [DOI] [PMC free article] [PubMed] [Google Scholar]
- 4.Pfaller MA, Messer SA, Hollis RJ, Boyken L, Tendolkar S, Kroeger J, Diekema DJ. 2009. Variation in susceptibility of bloodstream isolates of Candida glabrata to fluconazole according to patient age and geographic location in the United States in 2001 to 2007. J. Clin. Microbiol. 47:3185–3190. 10.1128/JCM.02437-10 [DOI] [PMC free article] [PubMed] [Google Scholar]
- 5.Lee I, Fishman NO, Zaoutis TE, Morales KH, Weiner MG, Synnestvedt M, Nachamkin I, Lautenbach E. 2009. Risk factors for fluconazole-resistant Candida glabrata bloodstream infections. Arch. Intern. Med. 169:379–383. 10.1001/archinte.169.4.379 [DOI] [PMC free article] [PubMed] [Google Scholar]
- 6.Pfaller MA, Castanheira M, Lockhart SR, Ahlquist AM, Messer SA, Jones RN. 2012. Frequency of decreased susceptibility and resistance to echinocandins among fluconazole-resistant bloodstream isolates of Candida glabrata. J. Clin. Microbiol. 50:1199–1203. 10.1128/JCM.06112-11 [DOI] [PMC free article] [PubMed] [Google Scholar]
- 7.Cleary JD, Garcia-Effron G, Chapman SW, Perlin DS. 2008. Reduced Candida glabrata susceptibility secondary to an FKS1 mutation developed during candidemia treatment. Antimicrob. Agents Chemother. 52:2263–2265. 10.1128/AAC.01568-07 [DOI] [PMC free article] [PubMed] [Google Scholar]
- 8.Zimbeck AJ, Iqbal N, Ahlquist AM, Farley MM, Harrison LH, Chiller T, Lockhart SR. 2010. FKS mutations and elevated echinocandin MIC values among Candida glabrata isolates from U.S. population-based surveillance. Antimicrob. Agents Chemother. 54:5042–5047. 10.1128/AAC.00836-10 [DOI] [PMC free article] [PubMed] [Google Scholar]
- 9.Shields RK, Nguyen MH, Press EG, Kwa AL, Cheng S, Du C, Clancy CJ. 2012. The presence of an FKS mutation rather than MIC is an independent risk factor for failure of echinocandin therapy among patients with invasive candidiasis due to Candida glabrata. Antimicrob. Agents Chemother. 56:4862–4869. 10.1128/AAC.00027-12 [DOI] [PMC free article] [PubMed] [Google Scholar]
- 10.Alexander BD, Johnson MD, Pfeiffer CD, Jiménez-Ortigosa C, Catania J, Booker R, Castanheira M, Messer SA, Perlin DS, Pfaller MA. 2013. Increasing echinocandin resistance in Candida glabrata: clinical failure correlates with presence of FKS mutations and elevated minimum inhibitory concentrations. Clin. Infect. Dis. 56:1724–1732. 10.1093/cid/cit136 [DOI] [PMC free article] [PubMed] [Google Scholar]
- 11.Park S, Kelly R, Kahn JN, Robles J, Hsu MJ, Register E, Li W, Vyas V, Fan H, Abruzzo G, Flattery A, Gill C, Chrebet G, Parent SA, Kurtz M, Teppler H, Douglas CM, Perlin DS. 2005. Specific substitutions in the echinocandin target Fks1p account for reduced susceptibility of rare laboratory and clinical Candida sp. isolates. Antimicrob. Agents Chemother. 49:3264–3273. 10.1128/AAC.49.8.3264-3273.2005 [DOI] [PMC free article] [PubMed] [Google Scholar]
- 12.Katiyar SK, Alastruey-Izquierdo A, Healey KR, Johnson ME, Perlin DS, Edlind TD. 2012. Fks1 and Fks2 are functionally redundant but differentially regulated in Candida glabrata: implications for echinocandin resistance. Antimicrob. Agents Chemother. 56:6304–6309. 10.1128/AAC.00813-12 [DOI] [PMC free article] [PubMed] [Google Scholar]
- 13.Garcia-Effron G, Lee S, Park S, Cleary JD, Perlin DS. 2009. Effect of Candida glabrata FKS1 and FKS2 mutations on echinocandin sensitivity and kinetics of 1,3-beta-d-glucan synthase: implication for the existing susceptibility breakpoint. Antimicrob. Agents Chemother. 53:3690–3699. 10.1128/AAC.00443-09 [DOI] [PMC free article] [PubMed] [Google Scholar]
- 14.Garcia-Effron G, Chua DJ, Tomada JR, Dipersio J, Perlin DS, Ghannoum M, Bonilla H. 2010. Novel FKS mutations associated with echinocandin resistance in Candida species. Antimicrob. Agents Chemother. 54:2225–2227. 10.1128/AAC.00998-09 [DOI] [PMC free article] [PubMed] [Google Scholar]
- 15.Pfeiffer CD, Garcia-Effron G, Zaas AK, Perfect JR, Perlin DS, Alexander BD. 2010. Breakthrough invasive candidiasis in patients on micafungin. J. Clin. Microbiol. 48:2373–2380. 10.1128/JCM.02390-09 [DOI] [PMC free article] [PubMed] [Google Scholar]
- 16.Bovers M, Diaz MR, Hagen F, Spanjaard L, Duim B, Visser CE, Hoogveld HL, Scharringa J, Hoepelman IM, Fell JW, Boekhout T. 2007. Identification of genotypically diverse Cryptococcus neoformans and Cryptococcus gattii isolates by Luminex xMAP technology. J. Clin. Microbiol. 45:1874–1883. 10.1128/JCM.02390-09 [DOI] [PMC free article] [PubMed] [Google Scholar]
- 17.Etienne KA, Kano R, Balajee SA. 2009. Development and validation of a microsphere-based Luminex assay for rapid identification of clinically relevant aspergilli. J. Clin. Microbiol. 47:1096–1100. 10.1128/JCM.01899-08 [DOI] [PMC free article] [PubMed] [Google Scholar]
- 18.Deak E, Etienne KA, Lockhart SR, Gade L, Chiller T, Balajee SA. 2010. Utility of a Luminex-based assay for multiplexed, rapid species identification of Candida isolates from an ongoing candidemia surveillance. Can. J. Microbiol. 56:348–351. 10.1139/w10-003 [DOI] [PubMed] [Google Scholar]
- 19.Babady NE, Miranda E, Gilhuley KA. 2011. Evaluation of Luminex xTAG fungal analyte-specific reagents for rapid identification of clinically relevant fungi. J. Clin. Microbiol. 49:3777–3782. 10.1128/JCM.01135-11 [DOI] [PMC free article] [PubMed] [Google Scholar]
- 20.Balada-Llasat JM, LaRue H, Kamboj K, Rigali L, Smith D, Thomas K, Pancholi P. 2012. Detection of yeasts in blood cultures by the Luminex xTAG fungal assay. J. Clin. Microbiol. 50:492–494. 10.1128/JCM.06375-11 [DOI] [PMC free article] [PubMed] [Google Scholar]
- 21.Bando H, Yoshino T, Shinozaki E, Nishina T, Yamazaki K, Yamaguchi K, Yuki S, Kajiura S, Fujii S, Yamanaka T, Tsuchihara K, Ohtsu A. 2013. Simultaneous identification of 36 mutations in KRAS codons 61and 146, BRAF, NRAS, and PIK3CA in a single reaction by multiplex assay kit. BMC Cancer 13:405. 10.1186/1471-2407-13-405 [DOI] [PMC free article] [PubMed] [Google Scholar]
- 22.Thierry S, Hamidjaja RA, Girault G, Löfström C, Ruuls R, Sylviane D. 2013. A multiplex bead-based suspension array assay for interrogation of phylogenetically informative single nucleotide polymorphisms for Bacillus anthracis. J. Microbiol. Methods 95:357–365. 10.1016/j.mimet.2013.10.004 [DOI] [PubMed] [Google Scholar]
- 23.Cleveland AA, Farley MM, Harrison LH, Lockhart SR, Magill SS, Chiller TM, Park BJ. 2012. Changes in epidemiology of candidemia and antifungal drug resistance in two U.S. locations: results from a population-based active laboratory surveillance, 2008–2010. Clin. Infect. Dis. 55:1352–1361. 10.1093/cid/cis697 [DOI] [PMC free article] [PubMed] [Google Scholar]