

Abstract
The blood-testis barrier and blood-brain barrier are responsible for protecting the male genital tract and central nervous system from xenobiotic exposure. In HIV-infected patients, low concentrations of antiretroviral drugs in cerebrospinal fluid and seminal fluid have been reported. One mechanism that may contribute to reduced concentrations is the expression of ATP-binding cassette drug efflux transporters, such as P-glycoprotein (P-gp). The objective of this study was to investigate in vivo the tissue distribution of the HIV protease inhibitor atazanavir in wild-type (WT) mice, P-gp/breast cancer resistance protein (Bcrp)-knockout (Mdr1a−/−, Mdr1b−/−, and Abcg2−/− triple-knockout [TKO]) mice, and Cyp3a−/− (Cyp) mice. WT mice and Cyp mice were pretreated with a P-gp/Bcrp inhibitor, elacridar (5 mg/kg of body weight), and the HIV protease inhibitor and boosting agent ritonavir (2 mg/kg intravenously [i.v.]), respectively. Atazanavir (10 mg/kg) was administered i.v. Atazanavir concentrations in plasma (Cplasma), brain (Cbrain), and testes (Ctestes) were quantified at various times by liquid chromatography-tandem mass spectrometry. In TKO mice, we demonstrated a significant increase in atazanavir Cbrain/Cplasma (5.4-fold) and Ctestes/Cplasma (4.6-fold) ratios compared to those in WT mice (P < 0.05). Elacridar-treated WT mice showed a significant increase in atazanavir Cbrain/Cplasma (12.3-fold) and Ctestes/Cplasma (13.5-fold) ratios compared to those in vehicle-treated WT mice. In Cyp mice pretreated with ritonavir, significant (P < 0.05) increases in atazanavir Cbrain/Cplasma (1.8-fold) and Ctestes/Cplasma (9.5-fold) ratios compared to those in vehicle-treated WT mice were observed. These data suggest that drug efflux transporters, i.e., P-gp, are involved in limiting the ability of atazanavir to permeate the rodent brain and genital tract. Since these transporters are known to be expressed in humans, they could contribute to the low cerebrospinal and seminal fluid antiretroviral concentrations reported in the clinic.
INTRODUCTION
The use of human immunodeficiency virus (HIV) protease inhibitors for the treatment of HIV infection remains a primary and effective component of combination antiretroviral therapy (1, 2). Patients on antiretroviral therapy must maintain a high level of adherence in order to suppress viral replication and reduce the opportunity for HIV to develop drug resistance (3). Although the combination antiretroviral therapy currently used is capable of suppressing HIV replication in plasma, it is unable to completely eradicate the virus from the host (4). One of the challenges to achieve total HIV eradication is the existence of viral sanctuaries, such as the brain and the male genital tract, which are protected by the blood-brain barrier (BBB) (5) and blood-testis barrier (BTB), respectively (6). These sanctuary sites allow HIV to evade eradication even if effective antiretroviral drug concentrations are achieved in plasma (7), could contribute to the development of HIV-associated neurocognitive disorders (8) and an increased risk of viral shedding into the seminal fluid of HIV-infected men (9), and, ultimately, could serve as a potential source for systemic viral repopulation if a patient interrupts drug therapy (7).
The BBB constitutes a physical and biochemical barrier between the brain parenchyma and systemic circulation and is primarily composed of brain microvessel endothelial cells that form tight cell-cell junctions which significantly restrict paracellular permeation of xenobiotics into and out of the brain (10). The BTB is primarily composed of Sertoli cells, which are epithelial cells that form tight junctions near the basement membrane. These cells establish a specialized immune-privileged environment by physically and immunologically separating the blood from the seminiferous tubule compartment (11).
Atazanavir, an HIV protease inhibitor that is currently part of first-line combination antiretroviral therapy, is currently recommended to be administered with other classes of antiretroviral drugs, such as the reverse transcriptase inhibitors, to treat HIV infection in therapy-naive patients (1). Since many HIV protease inhibitors are known to be extensively metabolized by the cytochrome P450 3A (CYP3A) enzyme family, they are generally coadministered with the HIV protease inhibitor ritonavir, which is also a potent inhibitor of CYP3A and serves as a pharmacoenhancer (12). Interestingly, studies conducted by Lorello et al. (13) and Harrington et al. (14) have demonstrated the presence of HIV RNA in semen and cerebrospinal fluid samples, respectively, from HIV-infected patients on long-term (>3 years) combination antiretroviral therapy, despite undetectable viral loads in plasma. Clinical studies examining atazanavir pharmacokinetics in HIV-infected patients have reported a very poor permeation of atazanavir into the brain and testes compartments, as reflected by low median cerebrospinal fluid (CSF)/plasma ratios in the range of 0.008 to 0.02 (15) and semen/plasma ratios of 0.1 (16).
One mechanism that may contribute to the poor tissue permeation of HIV protease inhibitors observed clinically is the functional expression of ATP-binding cassette (ABC) membrane-associated drug efflux transporters, i.e., P-glycoprotein (P-gp), multidrug resistance-associated protein 1 (MRP1/Mrp1), and breast cancer resistance protein (BCRP/Bcrp) (17, 18). These transporters have been recognized to play an important role in protecting the brain and the testes from xenobiotic exposure (19–21). Our group and others have previously demonstrated, using several cell culture systems of the BBB, the BTB, and the gastrointestinal tract, as well as ABC transporter-overexpressing cell culture models, that atazanavir is a substrate of P-gp, a much weaker substrate of MRP1, and an inhibitor of BCRP (21–23).
A limited number of in vivo studies have investigated the role of P-gp in reducing the oral absorption and tissue distribution of antiretroviral drugs, such as saquinavir, indinavir, and nelfinavir (24); however, little is known on the role of P-gp and BCRP/Bcrp in the tissue distribution of atazanavir. The objective of this study was to investigate, in vivo, the role of P-gp and Bcrp in the atazanavir tissue distribution in the brain and testes of wild-type (WT) mice and P-gp/Bcrp-knockout (Mdr1a−/−, Mdr1b−/−, and Abcg2−/− triple-knockout [TKO]) mice. We also examined the effect of elacridar, a selective inhibitor of P-gp and Bcrp, on the accumulation of atazanavir in the brain and testis compartments of WT mice. Finally, a model with Cyp3a-knockout (Cyp) mice, with eight Cyp3a genes deleted (Cyp3a11, Cyp3a13, Cyp3a16, Cyp3a25, Cyp3a41, Cyp3a44, Cyp3a57, and Cyp3a59), was used to further clarify if ritonavir (an HIV protease inhibitor and CYP3A inhibitor) could inhibit P-gp and/or Bcrp and lead to an increase in atazanavir tissue accumulation.
MATERIALS AND METHODS
Chemicals and reagents.
Atazanavir and ritonavir were gifts from the National Institutes of Health AIDS Research and Reference Reagent Program (Bethesda, MD). N-(4-[2-(1,2,3,4-Tetrahydro-6,7-dimethyl-2-isoquinolinyl)ethyl]-phenyl)-9,10-dihydro-5-methoxy-9-oxo-4-acridine carboxamide (elacridar) was purchased from Santa Cruz Biotechnology, Inc. (Santa Cruz, CA). 6,7-Dimethyl-2,3-di(2-pyridyl)-quinoxaline (DMDPQ), quantitative PCR primers, protease inhibitor cocktail, and all liquid chromatography-tandem mass spectrometry (LC-MS/MS) and standard laboratory chemicals were purchased from Sigma-Aldrich (St. Louis, MO) and were of the highest purity. All cell culture reagents and media were purchased from Life Technologies (Grand Island, NY). An ABI high-capacity reverse transcriptase cDNA kit was purchased from Applied Biosystems (Foster City, CA). PerfeCTa SYBR green FastMix was obtained from Quanta Biosciences Inc. (Gaithersburg, MD). The anti-P-gp antibody C219 was purchased from ID Labs Inc. (London, ON, Canada). Anti-Mrp1 (Mrpr1) antibody was purchased from Kamiya Biomedical Company (Seattle, WA). The rat anti-Bcrp antibody (BXP-53) and mouse antiactin antibodies were obtained from Abcam Inc. (Boston, MA). The goat antimouse and mouse antirat horseradish peroxidase-conjugated secondary antibodies were purchased through Jackson ImmunoResearch Laboratories Inc. (West Grove, PA). A SuperSignal West Pico chemiluminescence system was obtained from Thermo Fisher Scientific (Waltham, MA).
Animal models.
The WT mice (FVB/NTac strain), TKO mice (FVB/N7 strain), and Cyp mice (FVB/192P2 strain) used in each experiment were adult male mice between 9 and 12 weeks of age purchased from Taconic Inc. (Hudson, NY). The TKO mouse model was selected to investigate the potential role of P-gp and Bcrp in the tissue distribution of atazanavir. The Cyp mouse model was chosen to examine the role of ritonavir as a P-gp/Bcrp inhibitor in the absence of Cyp3a metabolism. All experiments, procedures, and animal care were conducted in accordance with the Canadian Council on Animal Care guidelines and approved by the University of Toronto Animal Care Committee. Animals were housed under a 12-h light/12-h dark cycle at room temperature with free access to food and water.
Mouse seminiferous tubule isolation.
Seminiferous tubules were isolated from WT mice or TKO mice as previously described (25), with minor modifications. In brief, adult mouse testes were decapsulated and incubated in collagenase (0.5 mg/ml in Dulbecco's modified Eagle medium–Ham's F-12 medium nutrient mixture [1:1]) at 35°C for 30 min. Seminiferous tubules were then washed five times by sedimentation under gravity to remove Leydig cells. All samples were frozen at −80°C for future analysis.
Total RNA extraction, cDNA synthesis, and qPCR.
Total RNA was isolated from brain tissue, liver tissue, and seminiferous tubules isolated from WT and TKO mice using the TRIzol reagent (Invitrogen) according to the manufacturer's instructions. The concentration (absorbance at 260 nm) and purity (absorbance at 260 nm/absorbance at 280 nm ratio) of RNA samples were assessed using a DU series 700 UV/visible scanning spectrophotometer (Beckman Coulter, Mississauga, ON, Canada). Isolated total RNA was subjected to DNase I digestion (0.1 U/ml) to remove genomic DNA. Reverse transcription was then performed with DNase-treated total RNA (2 μg) in a final reaction volume of 40 μl using an ABI high-capacity reverse transcription cDNA kit according to the manufacturer's instructions (Applied Biosystems). All sample reactions were initiated at 25°C for 10 min, followed by 37°C for 120 min and then 85°C for 5 min, using a Mastercycler ep Realplex 2S thermal cycler (Eppendorf Canada, Mississauga, ON, Canada).
The expression of genes encoding metabolic enzymes (Cyp3a11, Cyp2d22, Cyp2e1, and Ugt1a1) and the housekeeping gene peptidyl isomerase B (cyclophilin B) were analyzed by quantitative real-time PCR (qPCR) on a Mastercycler ep Realplex 2S thermal cycler using SYBR green fluorescence detection as previously described by our group (54). The 10-μl final reaction volume contained 1.25 μl of diluted cDNA, 5 μl of PerfeCTa SYBR green Fastmix (Quanta Biosciences), 0.6 μl of 1.25 μM concentrations of each primer (final concentration of each primer, 150 nM), and 2.55 μl of nuclease-free water. The primers for each of the genes of interest and the housekeeping gene are listed in Table 1, and primer specificity was determined using BLAST and dissociation curve analysis. For these experiments, threshold cycle (CT) values for the mRNA of the gene of interest are normalized to the value for the mRNA of the cyclophilin B housekeeping gene. Results of qPCR analysis of metabolic enzymes are presented as the RNA level (arbitrary units) of each gene of interest normalized to that of the housekeeping gene cyclophilin B, calculated using the efficiency-corrected ΔCT method, where ΔCT is equal to the CT value of the sample minus the CT value of cyclophilin B, where the normalized RNA level is equal to 2−ΔCT. The fold change in mRNA levels ± standard deviation (SD) in TKO mouse and WT mouse tissues was calculated using the comparative CT (ΔΔCT) method (26, 27).
TABLE 1.
Mouse gene primers used for quantitative real-time PCR
| Gene | GenBank accession no. | Orientationa | Primer sequence (5′–3′) | Reference |
|---|---|---|---|---|
| Cyp3a11 | NM_007818 | F | GACAAACAAGCAGGGATGGAC | 52 |
| R | CCAAGCTGATTGCTAGGAGCA | |||
| Cyp2d22 | NM_001163472.1 | F | CAGTGGTTGTACTAAATGGGCT | 52 |
| R | GCTAGGACTATACCTTGAGAGCG | |||
| Cyp2e1 | NM_021282 | F | TCCCTAAGTATCCTCCGTGA | 52 |
| R | GTAATCGAAGCGTTTGTTGA | |||
| Ugt1a1 | NM_201645 | F | CCAGCAGAAGGGGCACGAAGTTG | 53 |
| R | ACCACGCGCAGCAGAAAAGAAT | |||
| Cyclophilin B | NM_011149 | F | GGAGATGGCACAGGAGGAA | 21 |
| R | GCCCGTAGTGCTTCAGCTT |
F, forward; R, reverse.
Immunoblot analysis.
Immunoblotting was performed as described previously (21, 28), with minor modifications. In brief, whole tissue or isolated seminiferous tubule lysates were prepared by homogenization in modified radioimmunoprecipitation lysis buffer containing 50 mM Tris-HCl, pH 7.4, 150 mM NaCl, 1 mM EGTA, 1 mM sodium ortho-vanadate, 0.5 mM phenylmethylsulfonyl fluoride, 1% (vol/vol) Nonidet-P40, and 0.1% (vol/vol) protease inhibitor cocktail. Homogenates were subjected to brief sonication, followed by centrifugation for 10 min at 20,000 × g and 4°C, and the supernatants were isolated as tissue lysates. The protein content of each lysate was determined using a Bio-Rad protein assay kit. Lysates were incubated with Laemmli buffer (20 mM Tris-HCl, 2 mM EDTA, 2% SDS, 20% glycerol, 0.2% bromophenol blue) and 10% β-mercaptoethanol for 10 min at room temperature. Proteins were separated on a 10% SDS-polyacrylamide gel and transferred onto a polyvinylidene fluoride membrane. The membranes were blocked overnight in 5% skim milk–Tris-buffered saline containing 0.1% Tween 20 and incubated overnight with a primary antibody: mouse anti-P-gp (C219, 1:500 dilution), which recognizes an internal epitope of human and rodent P-gp; rat anti-Bcrp (BXP-53, 1:250 dilution), which recognizes an epitope corresponding to amino acids 221 to 394 of human and mouse Bcrp; or mouse anti-actin (1:2,000 dilution), which recognizes an epitope on the carboxyl-terminal end of human and rodent actin. The blots were then incubated with corresponding horseradish peroxidase-conjugated secondary antimouse (1:10,000 dilution) or antirat (1:10,000 dilution) antibodies. Signals were enhanced using a SuperSignal West Pico chemiluminescence system (Thermo-Fisher Scientific, Waltham, MA) and detected by exposure to X-ray film.
Intravenous drug and standard LC-MS/MS solutions.
For intravenous administration, atazanavir was dissolved in a mixture of ethanol, polyethylene glycol 200, and 5% glucose (2:6:2) to obtain a concentration of 2.5 mg/ml. Ritonavir and elacridar were first dissolved in dimethyl sulfoxide to obtain 100-mg/ml stocks and were subsequently dissolved in a mixture of ethanol, polyethylene glycol 200, and 5% glucose (2:6:2) to produce a 2.5-mg/ml solution for injection.
A standard stock solution of atazanavir (0.5 mg/liter) was prepared using high-pressure liquid chromatography-grade methanol and further diluted 1:10 in a methanol-water (1:1) mix to produce an atazanavir working solution (50 μg/ml). Similarly, the internal standard DMDPQ (0.2 μg/ml) stock solution was made and further diluted 1:10 in a methanol-water (1:1) mix to create the internal standard working solution (2 μg/ml). All stock and working solutions were stored at 4°C. The standard working solutions were diluted with drug-free mouse blood plasma, brain homogenate, and testis homogenate to generate concentrations of 5, 25, 50, 125, 500, 1,250, 2,500, and 5,000 ng/ml in plasma, 1, 5, 25, 75, 100, 250, 500, and 1,000 ng/ml in brain, and 2.4, 6, 24, 60, 120, 240, 900, 1,800, and 3,000 ng/ml in testes. For the preparation of internal quality controls (QC) used for the validation of the assay, independent atazanavir stock and working solutions were prepared and further diluted in drug-free plasma, brain homogenate, and testis homogenate to achieve concentrations of 125, 1,250, and 5,000 ng/ml in plasma, 5, 75, and 500 ng/ml in brain, and 24, 240, and 1,800 ng/ml in testes. The calibration standard, quality control samples, and analysis samples were stored at −20°C for further analysis by LC-MS/MS.
Distribution of atazanavir in mouse brain, testes and plasma.
The tissue and plasma distributions of atazanavir were determined following an intravenous injection (10 mg/kg of body weight) via the tail vein. For studies examining the inhibition of P-gp by a selective P-gp and Bcrp inhibitor, i.e., elacridar (5 mg/kg) or ritonavir (2 mg/kg), WT mice were preadministered elacridar or ritonavir intravenously via tail vein injection 15 min before receiving the tail vein injection of atazanavir (10 mg/kg). At specific time points following atazanavir administration, mice were anesthetized with isoflurane (IsoFlo; Abbott Laboratories, Abbott Park, IL) and whole blood was collected by cardiac puncture. Blood was mixed with 5 μl EDTA (5 mM) as an anticoagulant, and plasma was isolated following centrifugation at 7,500 × g for 10 min at 4°C. Following exsanguination, brain, liver, and testis tissues were collected, washed, and weighed before being flash frozen in liquid nitrogen. All samples were stored at −80°C until further analysis by LC-MS/MS.
Tissue preparation and sample extraction for LC-MS/MS.
Isolated mouse brain and testes were homogenized in distilled RNase/DNase-free water (6 ml/g of tissue). Two hundred microliters of each standard, quality control, and analysis sample was pipetted into separated snap-cap microcentrifuge vials containing 100 μl of a working internal standard solution. The contents of each tube were mixed with 800 μl methanol to precipitate proteins at room temperature for 15 min, and the tube was then centrifuged at 5,000 rpm for 5 min at 4°C. After centrifugation, 300 μl of each supernatant was transferred to 2-ml autosampler vials containing 100 μl 0.1% acetic acid. The injection vials were vortex mixed, and 10 μl mixture was injected for analysis.
Quantification of tissue and plasma atazanavir concentrations by LC-MS/MS.
Chromatographic separation was carried out at 40°C with a gradient mobile-phase run. The mobile phase consisted of mobile phase A (0.1% acetic acid in water) and mobile phase B (100% methanol). The gradient profile was as follows (all solvent percentages are volume fractions): 0 to 1 min, 35:65 A and B; 1 to 5 min, linear gradient from 35:65 A and B to 10:90 A and B; 5 to 7 min, back to 35:65 A and B; and 7 to 8 min, hold at 35:65 A and B (for column equilibration). The flow rate used was 1 ml/min, and the injection volumes were 10 μl for all the analyses. The total run time was 8 min, and a 1:10 splitter was used to introduce effluent to the MS/MS.
Mass spectral analyses were performed on an API 2000 triple-quadrupole mass spectrometer fitted with an API turbo ion spray source and operated in the positive ionization mode. Lower and upper limits of quantification were arbitrarily set as the bottom and top points of the standard curve, respectively. Both interday and intrasample precision varied less than 15% (coefficient of variation).
Pharmacokinetic analysis.
Using the results from the LC-MS/MS analysis, the atazanavir concentrations (ng/ml) in brain and testis tissues were normalized to the tissue mass (g) and presented as atazanavir tissue concentrations (ng/g of tissue). Atazanavir tissue concentration/plasma concentration ratios were calculated at each time point as the ratio of the atazanavir concentration in brain (Cbrain) or testes (Ctestes) to the atazanavir concentration in plasma (Cplasma). The areas under the concentration-time curves (AUCs) for plasma, brain, and testes (AUCplasma, AUCbrain, and AUCtestes, respectively) extrapolated to infinity (AUV0–∞) were estimated using the linear trapezoidal method. Cumulative AUC brain/AUCplasma and AUCtestes/AUCplasma ratios were calculated by summing the AUC in each tissue at each time period (0 to 1 h, 1 to 2 h, 2 to 3 h, and 3 to 4 h) and dividing by the respective plasma AUCplasma for a given time period. The plasma terminal elimination half-lives were determined by linear regression of the respective natural log-transformed concentration-time plots. Clearance (CL) and volume of distribution (V) were calculated from the equations dose/AUC0–∞ and total amount of drug in body dose (mg)/Cplasma, respectively.
The compartmental analyses of plasma atazanavir concentration-time profiles from WT and TKO mice were performed using Micromath Scientist (version 2.0) software (St. Louis, MO). Compartmental parameter estimates for atazanavir were determined for WT and TKO mice after fitting concentration data to one- and two-compartment models. Final model selection was based on goodness-of-fit comparisons among the models using visual inspection of the data, the coefficient of variation of parameter estimates, and the weighted sum of standard differences (WSSD). Various weighting schemes (actual, estimated, 1/concentration, and 1/concentration2) were used, and 1/concentration2 weighting yielded the highest model selection criterion and the lowest coefficient of variation (SD/parameter).
Statistical analyses.
All results are shown as the mean ± SD or as the mean ± standard error of the mean (SEM), as appropriate. Comparisons between animal groups were performed using the unpaired two-tailed Student's t test. Data were analyzed using Instat (version 3.0) software (GraphPad Software Inc., San Diego, CA), and a P value of <0.05 was considered statistically significant.
RESULTS
ABC transporter protein expression in brain and testes of WT and TKO mice.
Since atazanavir is a known substrate of P-gp, a weak substrate of Mrp1, and an inhibitor of BCRP (23, 29–31), we performed immunoblot analysis to examine the protein expression of these transporters in whole-brain tissue lysates and isolated seminiferous tubules from both WT and TKO (Mdr1a−/−, Mdr1b−/−, and Abcg2−/−) mice. We detected robust bands for P-gp (∼170 kDa), Bcrp (∼72 kDa), and Mrp1 (∼190 kDa) in lysates of seminiferous tubules and whole-brain tissue isolated from WT mice. As expected, no bands were identified for P-gp or Bcrp in either whole-brain or seminiferous tubule tissues isolated from TKO mice (data not shown). We also did not observe any significant differences in Mrp1 expression in either whole-brain tissue lysates or isolated seminiferous tubules between TKO mice and WT mice (data not shown).
Expression of mRNA for metabolic enzymes in WT and TKO mouse brains, seminiferous tubules, and liver.
In order to address any potential changes in drug-metabolizing enzyme expression in TKO mice, we examined mRNA expression for several enzymes in mouse liver, testes (seminiferous tubules), and brain. In seminiferous tubules and brain, we detected very low levels of expression of mRNA for all metabolic enzymes relative to their expression in liver tissue in both WT and TKO mice. Interestingly, we observed a significant (P < 0.05) 12-fold increase in Cyp3a11 mRNA expression (Cyp3a11 is the mouse equivalent of CYP3A4 in humans [32]) in TKO mouse brain samples compared to that in WT mouse brain samples. No significant changes in the expression of mRNA for other metabolic enzymes were detected in brain, seminiferous tubules, or liver tissues of TKO mice compared to WT mice (Table 2).
TABLE 2.
qPCR analysis of metabolic enzymes in WT and TKO mouse brains, seminiferous tubules, and liver
| Tissue | Gene | Relative expressiona |
Fold change (WT vs TKO mice) | |
|---|---|---|---|---|
| WT | TKO | |||
| Brain | Cyp3a11 | 0.0005 ± 0.0001 | 0.007 ± 0.001b | 12.64 ± 2.96 |
| Ugt1a1 | 0.006 ± 0.001 | 0.008 ± 0.002 | 1.27 ± 0.42 | |
| Cyp2d22 | 0.13 ± 0.03 | 0.12 ± 0.02 | 0.95 ± 0.24 | |
| Cyp2e1 | 0.0014 ± 0.0003 | 0.0005 ± 0.0001b | 0.37 ± 0.11 | |
| Seminiferous tubules | Cyp3a11 | 0.02 ± 0.01 | 0.008 ± 0.003 | 0.44 ± 0.32 |
| Ugt1a1 | 0.08 ± 0.02 | 0.09 ± 0.03 | 1.12 ± 0.49 | |
| Cyp2d22 | 0.009 ± 0.005 | 0.02 ± 0.01 | 2.73 ± 1.95 | |
| Cyp2e1 | 0.003 ± 0.003 | 0.002 ± 0.001 | 0.50 ± 0.44 | |
| Liver | Cyp3a11 | 5.45 ± 0.67 | 6.59 ± 2.67 | 1.21 ± 0.51 |
| Ugt1a1 | 1.11 ± 0.28 | 1.34 ± 0.56 | 1.21 ± 0.59 | |
| Cyp2d22 | 0.35 ± 0.05 | 0.50 ± 0.11 | 1.40 ± 0.37 | |
| Cyp2e1 | 6.45 ± 0.86 | 11.63 ± 3.65 | 1.80 ± 0.61 | |
Expression was normalized to that of the cyclophilin B gene.
P < 0.05 for TKO (Mdr1a−/−, Mdr1b−/−, Abcg2−/−) mice compared to WT mice (n = 4 mice per group).
Pharmacokinetic parameters of atazanavir in WT and TKO mouse plasma.
We determined the atazanavir concentration in plasma (Cplasma) of WT and TKO mice (Fig. 1). Noncompartmental analysis yielded terminal half-lives of 1.19 h and 1.29 h in WT mice and TKO mice, respectively. The total body clearance in the plasma of WT mice was 53 ml/h/kg, and that in TKO mice was 56 ml/h/kg. The volumes of distribution based on the plasma atazanavir concentration-time profiles were 0.68 ± 0.06 ml and 0.75 ± 0.26 ml in the WT mice and TKO mice, respectively (Table 3).
FIG 1.

Atazanavir plasma concentrations over time in WT and TKO mice. Atazanavir plasma concentrations (ng/ml) were measured over time following an i.v. bolus administration of 10 mg/kg atazanavir to WT mice and TKO (Mdr1a−/−, Mdr1b−/−, and Abcg2−/−) mice. The inset shows atazanavir plasma concentrations over time (0 to 24 h) in WT and TKO mice. Results are shown as the mean ± SEM for each time point (n = 4 animals per time point per group). Solid black line and dashed black line, atazanavir Cplasma data fitted to a two-compartment i.v. bolus pharmacokinetic model for WT mice and TKO mice, respectively.
TABLE 3.
Atazanavir pharmacokinetic parameters in WT and TKO mice estimated from plasma concentration data fitted to a two-compartment single i.v. bolus model
| Mouse genotype | Pharmacokinetic analysis |
Analysis of model fit |
|||||||
|---|---|---|---|---|---|---|---|---|---|
| k12 (h−1) | k21 (h−1) | k10 (h−1) | V (ml) | CL (ml/h/kg) | t1/2βa(h) | AUC0–∞ (ng · h/ml) | WSSD | R2 | |
| WT | 0.21 ± 0.06 | 0.63 ± 0.18 | 2.65 ± 0.19 | 0.68 ± 0.06 | 53 | 1.19 | 1,955 | 0.12 | 0.98 |
| TKO | 2.92 ± 1.60b | 1.59 ± 0.63 | 3.99 ± 1.26 | 0.75 ± 0.26 | 56 | 1.29 | 1,722 | 0.76 | 0.97 |
t1/2β, half-life at β phase.
P < 0.05 for TKO mice compared to WT mice (n = 4 mice per time per group).
Plasma atazanavir concentration data were then fitted to a two-compartment i.v. bolus model, which provided distribution micro-rate constants. We observed a significant increase (P < 0.05) in k12, which represents the rate at which atazanavir distributes into the tissue compartments from plasma, in TKO mice (2.92 ± 1.60 h−1) compared to WT mice (0.21 ± 0.06 h−1). We did not observe any significant changes in the rate constant k21, which represents the rate at which atazanavir leaves the tissue compartment into plasma, or k10, which represents the rate of elimination of atazanavir from the plasma compartment (Table 3).
Atazanavir brain and testis concentrations in WT mice and TKO mice.
We examined the concentration of atazanavir in brain (Cbrain) (Fig. 2A) and testes (Ctestes) (Fig. 2B) in WT mice and TKO mice and compared the tissue-to-plasma concentration ratios of atazanavir (Cbrain/Cplasma and Ctestes/Cplasma) in both groups. We observed significant increases (P < 0.05) in the Cbrain/Cplasma (Fig. 3A) and Ctestes/Cplasma (Fig. 3B) ratios in TKO mice compared to those in WT mice as early as 0.5 h postinjection. At 0.5 h after atazanavir injection, we detected a 5.4-fold increase in the TKO mouse Cbrain/Cplasma ratio (0.43 ± 0.07; Fig. 3A) and a 4.6-fold increase in the TKO mouse Ctestes/Cplasma ratio (0.73 ± 0.26, Fig. 3B) compared to the WT mouse Cbrain/Cplasma (0.08 ± 0.07) and Ctestes/Cplasma (0.16 ± 0.1) ratios (Fig. 3A and B, respectively).
FIG 2.

Atazanavir tissue concentrations over time in WT and TKO mice. Atazanavir Cbrain (A) and Ctestes (B) (ng/g of tissue) were measured over time following i.v. bolus administration of 10 mg/kg atazanavir to WT mice and TKO mice. Results are shown as the mean ± SEM for each time point (n = 4 animals per time point per group).
FIG 3.

Atazanavir tissue-to-plasma concentration ratios in WT mice (squares and solid line) and TKO mice (triangles and dashed line). (A) Cbrain/Cplasma; (B) Ctestes/Cplasma. Results are shown as the mean ± SEM (n = 4 animals per time point per group). Statistically significant differences are indicated (*, P < 0.05).
Inhibition of P-gp-mediated efflux of atazanavir by elacridar in the brain and testes of WT mice.
To determine if P-gp could be pharmacologically inhibited in WT mice, leading to an increase in atazanavir concentrations in brain and testes, we administered via tail vein injection the selective P-gp/Bcrp inhibitor elacridar (5 mg/kg) or vehicle to WT mice 15 min prior to a tail vein injection of atazanavir (10 mg/kg). In the elacridar-treated WT mice, we observed a significant increase (P < 0.05) in the atazanavir Cbrain/Cplasma ratio at 15 min (12.3-fold, 0.37 ± 0.1) and a more modest, although significant, increase at 60 min (3.5-fold, 0.07 ± 0.01) compared to the ratios at the two times in vehicle-treated WT mice (0.03 ± 0.01 and 0.02 ± 0.01, respectively) (Fig. 4A). We observed a modest increase in the atazanavir Ctestes/Cplasma ratio at 15 min in elacridar-treated WT mice (1.7-fold, 0.16 ± 0.02) compared to that in vehicle-treated WT mice (0.09 ± 0.02), although the increase did not reach statistical significance (Fig. 4B). Interestingly, at 60 min we observed a significant and substantial increase (P < 0.05) in the Ctestes/Cplasma ratio in elacridar-treated WT mice (13.5-fold, 1.08 ± 0.21) compared to that in vehicle-treated WT mice (0.08 ± 0.01) (Fig. 4B).
FIG 4.

Effect of elacridar on atazanavir tissue-to-plasma concentration ratios in WT and TKO mice. Atazanavir Cbrain/Cplasma (A) and Ctestes/Cplasma (B) ratios at 15- and 60-min time points in WT mice in the absence (vehicle) or in the presence of elacridar (5 mg/kg i.v.) are shown. Results are expressed as the mean tissue concentration/plasma concentration ratio ± SEM (n = 4 mice per time point per group). Statistically significant differences are indicated (*, P < 0.05).
Inhibition of P-gp/Bcrp-mediated efflux of atazanavir by ritonavir in the brains and testes of Cyp mice.
To determine if the HIV protease inhibitor ritonavir could inhibit the P-gp- and Bcrp-mediated efflux of atazanavir, we used a Cyp mouse model that lacks expression of eight major Cyp3a enzymes. We administered ritonavir (2 mg/kg i.v.) or vehicle to Cyp mice 15 min prior to a tail vein injection of atazanavir (10 mg/kg). At 15 min, we observed a significant (P < 0.05) but modest increase (1.8-fold) in the atazanavir Cbrain/Cplasma ratio in ritonavir-treated Cyp mice (0.024 ± 0.003) compared to that in vehicle-treated Cyp mice (0.013 ± 0.002) (Fig. 5A). At 60 min, ritonavir did not increase the Cbrain/Cplasma ratio in ritonavir-treated Cyp mice compared to that in vehicle-treated Cyp mice (0.015 ± 0.006 versus 0.015 ± 0.001, respectively) (Fig. 5A). In testes, pretreatment with ritonavir significantly increased the Ctestes/Cplasma ratio in ritonavir-treated Cyp mice at both 15 min (9.5-fold, 0.181 ± 0.03) and 1 h (2.7-fold, 0.132 ± 0.02) compared to that in vehicle-treated Cyp mice (0.019 ± 0.01 and 0.049 ± 0.01, respectively) (Fig. 5B).
FIG 5.
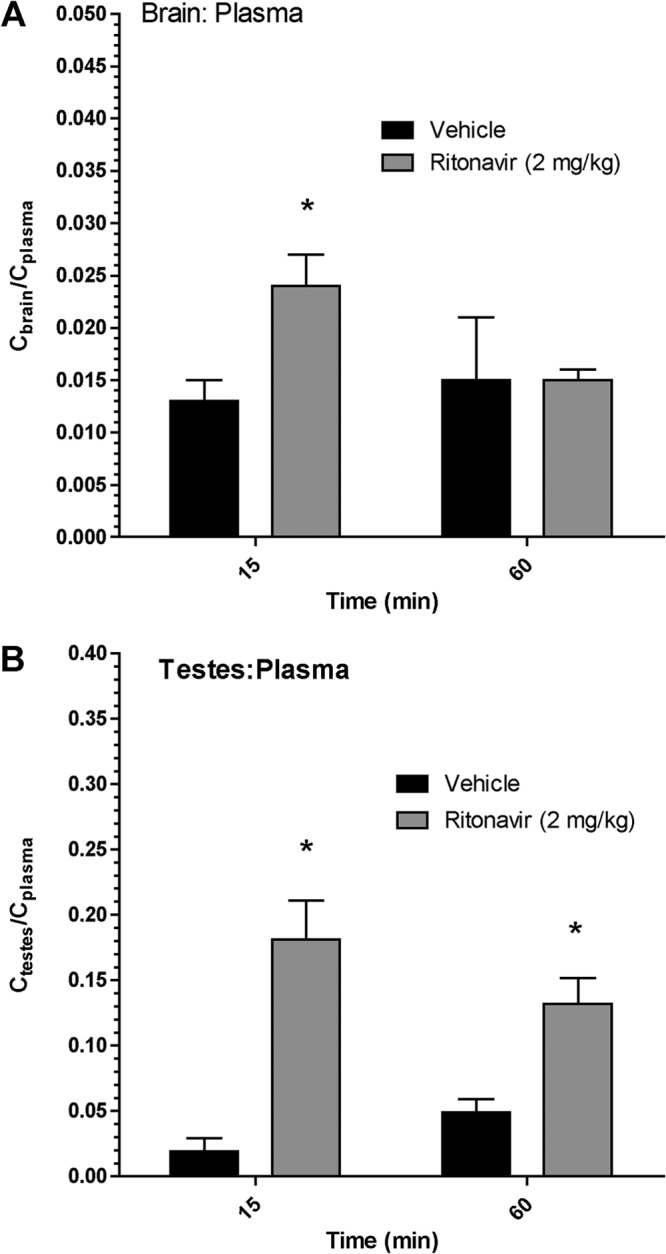
Effect of ritonavir on atazanavir tissue-to-plasma concentration ratios in WT and TKO mice. Atazanavir Cbrain/Cplasma (A) and Ctestes/Cplasma (B) ratios at 60 min in Cyp mice in the absence (vehicle) or the presence of ritonavir (2 mg/kg i.v.) are shown. Results are expressed as the mean tissue concentration/plasma concentration ratio ± SEM (n = 4 mice per time point per group). Statistically significant differences are indicated by an asterisk (*, P < 0.05).
DISCUSSION
Since the introduction of combination antiretroviral therapy, several clinical studies examining antiretroviral drug concentrations in HIV-infected men have reported low concentrations of HIV protease inhibitors in both the cerebrospinal fluid and seminal fluid of the male genital tract (33, 34). In addition to the low concentrations of antiretroviral drugs, both tissues have been shown to be sanctuary sites for HIV, allowing the virus to persist, despite adherence to pharmacotherapy and a significant reduction in the plasma viral load (5, 9). These sanctuary sites of replication-competent virus are thought to contribute to the rapid viral repopulation observed in patients during interruption of therapy (7, 35, 36). One potential mechanism that could contribute to the low concentrations of HIV protease inhibitors at these sites is the functional expression of active drug efflux transporters, such as P-gp. In this study, we have used drug transporters and metabolic enzyme-knockout mouse models to examine the role of efflux transporters in the distribution of the HIV protease inhibitor atazanavir in the brain and testes.
Since atazanavir is known to be highly metabolized in humans, we investigated the expression of the mRNA for several drug-metabolizing enzymes to ensure that the relative expression was similar between TKO and WT mice. We confirmed similar levels of expression of mRNA for several metabolic enzymes in TKO mice and WT mice and found that the expression of mRNA for Cyp3a11, the mouse functional ortholog of human CYP3A4 (32), was significantly higher in the TKO mouse brain. Although Cyp3a11 mRNA expression in the TKO mouse brain was significantly increased, the relative Cyp3a11 mRNA expression detected in TKO mouse liver tissue was 65-fold greater than the one measured in TKO mouse brain tissue, suggesting that it may play a minor role in atazanavir metabolism at the level of the brain. A previous study examining drug-metabolizing enzyme expression in human BBB and brain cortex reported detectable levels of CYP2D6 and CYP2E1, a finding which is in agreement with our findings demonstrating the expression of Cyp2d22, the functional ortholog of Cyp2d6 and Cyp2e1; however, they were unable to detect CYP3A4 within the BBB or the brain cortex (37). Interestingly, studies by Hagemeyer et al. (38) and Rosenbrock et al. (39) have reported Cyp3a11 and Cyp3a13 mRNA expression in mouse brain, suggesting that there may be species differences between humans and mice. In addition, we provide the first evidence of Cyp3a11, Cyp2d22, Cyp2e1, and Ugt1a1 mRNA expression in isolated seminiferous tubules of TKO mice and WT mice; however, since the relative expression of these enzymes in the tubules was very low, they most likely play a limited role in atazanavir metabolism at the BTB. Taken together, these findings suggest that extrahepatic drug metabolism is minor and would most likely not play a role in the tissue distribution of atazanavir. The relative expression of CYP3A4 and UGT1A1 in human seminiferous tubules is currently unknown, further studies examining the role of CYP-mediated metabolism at the human BTB are needed.
Since little is known about the role of drug efflux transporters in the atazanavir distribution in vivo, we used TKO mice rather than Mdr1a−/− Mdr1b−/− mice to avoid any potential compensatory upregulation of other transporters, such as Bcrp, which has been previously reported in P-gp-knockout (Mdr1a−/−) mice (40). In the TKO mice, we did not observe any significant differences in the half-life, volume of distribution, AUC0–∞, or clearance of atazanavir in plasma compared to WT mice, suggesting that the two animal models exhibit similar plasma atazanavir pharmacokinetic properties. These findings are in agreement with those from a study conducted by Giri et al., where the absence of Bcrp in Bcrp−/− mice did not have a significant effect on the plasma concentrations of the Bcrp substrate, zidovudine, or the Bcrp/P-gp substrate, abacavir (41). Applying a two-compartment i.v. bolus model and using curve-fitting software, we observed a significant increase in the k12 rate constant, suggesting that the rate of distribution of atazanavir into tissues is enhanced in the absence of drug transporters. Since atazanavir is not known to be a substrate for Bcrp, we propose that any changes in the pharmacokinetics of atazanavir are most likely due to the absence P-gp in TKO mice (29, 31).
Within the TKO mouse brains and testes, we observed a significant increase the Cbrain/Cplasma and Ctestes/Cplasma ratios over time compared to those in WT mice. These data provide the first evidence that P-gp plays an important role in limiting the distribution of atazanavir into brain and testes. Previous studies by our group have demonstrated in vitro that atazanavir is a substrate for P-gp at the BBB (22) and BTB (21) and that the accumulation of atazanavir can be significantly enhanced using selective inhibitors of P-gp (21–23). Furthermore, in vivo studies examining the tissue distribution of the first developed HIV protease inhibitors, i.e., indinavir and saquinavir, have reported that both the oral bioavailability and the tissue distribution of these agents are altered in a similar manner through the inhibition of P-gp using a selective inhibitor and/or through the use of a P-gp-knockout (Mdr1a−/− Mdr1b−/−) mouse model (24, 42–44). These findings provide a potential mechanism for the low atazanavir concentrations observed in the CSF and seminal fluid of HIV-infected patients (15, 16).
In addition to examining the atazanavir distribution in the TKO mice model, we also used elacridar, a selective P-gp/Bcrp inhibitor, to inhibit pharmacologically the efflux of atazanavir from WT mouse brain and testes compartments. Following the administration of elacridar, we observed significant increases in the atazanavir Cbrain/Cplasma ratio (12.3-fold, at 15 min) and the atazanavir Ctestes/Cplasma ratio (13.5-fold, at 60 min) after atazanavir injection, suggesting that elacridar can inhibit the P-gp-mediated efflux of atazanavir from the brain and testes. Previous positron emission tomography studies investigating the function of P-gp at the level of the BBB in vivo have demonstrated that coinfusion of cyclosporine, an immunomodulator and known P-gp inhibitor, significantly increased the brain permeation of [11C]verapamil in both mice (45, 46) and humans (47, 48). Taken together, these findings, in combination with the data that we obtained, suggest that selective inhibition of an ABC membrane-associated drug efflux transporter, i.e., P-gp, may increase HIV protease inhibitor concentrations at target organs of the infection, such as brain and testes.
The HIV protease inhibitor ritonavir is a potent inhibitor of the Cyp3A-mediated metabolism of other HIV protease inhibitors. In the clinic, ritonavir is used as a boosting agent, known as a pharmacoenhancer, to increase the plasma concentrations and half-life of coadministered HIV protease inhibitors, such as darunavir and atazanavir (1). It is noteworthy that previous in vitro studies have shown that ritonavir can act as both a substrate and an inhibitor of P-gp and an inhibitor of Bcrp (29–31). In order to investigate if the HIV protease inhibitor ritonavir inhibits atazanavir-mediated transport by P-gp, we used a Cyp mouse model, which lacks eight members of the Cyp3a enzyme subfamily. We observed that ritonavir could modestly, but significantly, enhance the accumulation of atazanavir in the brain and testes. A previous in situ perfusion intestinal study by Holmstock et al. demonstrated in mice that coperfusion of the HIV protease inhibitor darunavir with ritonavir increased the intestinal absorption of darunavir through an inhibitory effect of P-gp (49). In contrast, several in vivo studies have reported that ritonavir is a poor inhibitor of P-gp and have suggested that the effects of ritonavir in vivo are primarily due to inhibition of CYP3A-mediated metabolism of HIV protease inhibitors (43, 44, 50). Taken together, our data suggest that ritonavir can modestly inhibit the P-gp-mediated efflux of atazanavir in vivo. However, it is clear that in the clinic, the interaction of ritonavir with atazanavir is primarily mediated through the inhibition of a CYP3A metabolism pathway (51).
In summary, using a TKO mouse model, we have demonstrated for the first time the in vivo role of P-gp in limiting the tissue distribution of atazanavir in the brain and testes. Our data also suggest that atazanavir efflux from the brain and testes can be inhibited by elacridar, a selective P-gp/Bcrp inhibitor, and that the HIV protease inhibitor ritonavir, which is commonly used as an inhibitor of CYP3A4, may also play a minor role in inhibiting P-gp in vivo. These findings highlight the importance of understanding the role of drug efflux transporters in limiting the tissue distribution of HIV protease inhibitors into sanctuary sites of HIV infection and could guide clinicians toward selecting antiretroviral drugs with better tissue distribution properties. Further studies are needed to elucidate fully the clinical role of drug efflux transporters and their ability to limit the concentration of antiretroviral drugs in the brain and testes of HIV-infected patients.
ACKNOWLEDGMENTS
We thank Tozammel Hoque and Wenlei Jiang for their assistance with the animal studies.
This research was funded by a grant from the Ontario HIV Treatment Network (OHTN), Ministry of Health, awarded to Reina Bendayan. Reina Bendayan is the recipient of a career scientist award from OHTN, Ministry of Health. Kevin Robillard is the recipient of an OHTN studentship award and Gary Chan is the recipient of a Ph.D. studentship award from the Natural Sciences and Research Council of Canada (NSERC).
Footnotes
Published ahead of print 30 December 2013
REFERENCES
- 1.Panel on Antiretroviral Guidelines for Adults and Adolescents 2013. Guidelines for the use of antiretroviral agents in HIV-1-infected adults and adolescents. February 2012. U.S. Department of Health and Human Services, Washington, DC: http://aidsinfo.nih.gov/contentfiles/lvguidelines/adultandadolescentgl.pdf [Google Scholar]
- 2.Stebbing J, Bower M, Mandalia S, Nelson M, Gazzard B. 2006. Highly active anti-retroviral therapy (HAART)-induced maintenance of adaptive but not innate immune parameters is associated with protection from HIV-induced mortality. Clin. Exp. Immunol. 145:271–276. 10.1111/j.1365-2249.2006.03147.x [DOI] [PMC free article] [PubMed] [Google Scholar]
- 3.Honda M, Oka S. 2006. Current therapy for human immunodeficiency virus infection and acquired immunodeficiency syndrome. Int. J. Hematol. 84:18–22. 10.1532/IJH97.06102 [DOI] [PubMed] [Google Scholar]
- 4.Massanella M, Martinez-Picado J, Blanco J. 2013. Attacking the HIV reservoir from the immune and viral perspective. Curr. HIV/AIDS Rep. 10:33–41. 10.1007/s11904-012-0150-8 [DOI] [PubMed] [Google Scholar]
- 5.Persidsky Y, Poluektova L. 2006. Immune privilege and HIV-1 persistence in the CNS. Immunol. Rev. 213:180–194. 10.1111/j.1600-065X.2006.00440.x [DOI] [PubMed] [Google Scholar]
- 6.Le Tortorec A, Dejucq-Rainsford N. 2007. The male genital tract: a host for HIV. Gynecol. Obstet. Fertil. 35:1245–1250 (In French.) 10.1016/j.gyobfe.2007.09.017 [DOI] [PubMed] [Google Scholar]
- 7.Dahl V, Josefsson L, Palmer S. 2010. HIV reservoirs, latency, and reactivation: prospects for eradication. Antiviral Res. 85:286–294. 10.1016/j.antiviral.2009.09.016 [DOI] [PubMed] [Google Scholar]
- 8.Winston A, Arenas-Pinto A, Stohr W, Fisher M, Orkin CM, Aderogba K, De Burgh-Thomas A, O'Farrell N, Lacey CJ, Leen C, Dunn D, Paton NI. 2013. Neurocognitive function in HIV infected patients on antiretroviral therapy. PLoS One 8:e61949. 10.1371/journal.pone.0061949 [DOI] [PMC free article] [PubMed] [Google Scholar]
- 9.Le Tortorec A, Dejucq-Rainsford N. 2010. HIV infection of the male genital tract—consequences for sexual transmission and reproduction. Int. J. Androl. 33:e98–e108. 10.1111/j.1365-2605.2009.00973.x [DOI] [PMC free article] [PubMed] [Google Scholar]
- 10.Persidsky Y, Ramirez SH, Haorah J, Kanmogne GD. 2006. Blood-brain barrier: structural components and function under physiologic and pathologic conditions. J. Neuroimmune Pharmacol. 1:223–236. 10.1007/s11481-006-9025-3 [DOI] [PubMed] [Google Scholar]
- 11.Su L, Mruk DD, Lee WM, Cheng CY. 2011. Drug transporters and blood-testis barrier function. J. Endocrinol. 209:337–351. 10.1530/JOE-10-0474 [DOI] [PMC free article] [PubMed] [Google Scholar]
- 12.Hsu A, Granneman GR, Bertz RJ. 1998. Ritonavir: clinical pharmacokinetics and interactions with other anti-HIV agents. Clin. Pharmacokinet. 35:275–291. 10.2165/00003088-199835040-00002 [DOI] [PubMed] [Google Scholar]
- 13.Lorello G, La Porte C, Pilon R, Zhang G, Karnauchow T, MacPherson P. 2009. Discordance in HIV-1 viral loads and antiretroviral drug concentrations comparing semen and blood plasma. HIV Med. 10:548–554. 10.1111/j.1468-1293.2009.00725.x [DOI] [PubMed] [Google Scholar]
- 14.Harrington PR, Schnell G, Letendre SL, Ritola K, Robertson K, Hall C, Burch CL, Jabara CB, Moore DT, Ellis RJ, Price RW, Swanstrom R. 2009. Cross-sectional characterization of HIV-1 env compartmentalization in cerebrospinal fluid over the full disease course. AIDS 23:907–915. 10.1097/QAD.0b013e3283299129 [DOI] [PMC free article] [PubMed] [Google Scholar]
- 15.Best BM, Letendre SL, Brigid E, Clifford DB, Collier AC, Gelman BB, McArthur JC, McCutchan JA, Simpson DM, Ellis R, Capparelli EV, Grant I. 2009. Low atazanavir concentrations in cerebrospinal fluid. AIDS 23:83–87. 10.1097/QAD.0b013e328317a702 [DOI] [PMC free article] [PubMed] [Google Scholar]
- 16.van Leeuwen E, Ter Heine R, van der Veen F, Repping S, Beijnen JH, Prins JM. 2007. Penetration of atazanavir in seminal plasma of men infected with human immunodeficiency virus type 1. Antimicrob. Agents Chemother. 51:335–337. 10.1128/AAC.00774-06 [DOI] [PMC free article] [PubMed] [Google Scholar]
- 17.Marquez B, Van Bambeke F. 2011. ABC multidrug transporters: target for modulation of drug pharmacokinetics and drug-drug interactions. Curr. Drug Targets 12:600–620. 10.2174/138945011795378504 [DOI] [PubMed] [Google Scholar]
- 18.Huls M, Russel FGM, Masereeuw R. 2009. The role of ATP binding cassette transporters in tissue defense and organ regeneration. J. Pharmacol. Exp. Ther. 328:3–9. 10.1124/jpet.107.132225 [DOI] [PubMed] [Google Scholar]
- 19.Kodaira H, Kusuhara H, Ushiki J, Fuse E, Sugiyama Y. 2010. Kinetic analysis of the cooperation of P-glycoprotein (P-gp/Abcb1) and breast cancer resistance protein (Bcrp/Abcg2) in limiting the brain and testis penetration of erlotinib, flavopiridol, and mitoxantrone. J. Pharmacol. Exp. Ther. 333:788–796. 10.1124/jpet.109.162321 [DOI] [PubMed] [Google Scholar]
- 20.Mruk DD, Su L, Cheng CY. 2011. Emerging role for drug transporters at the blood-testis barrier. Trends Pharmacol. Sci. 32:99–106. 10.1016/j.tips.2010.11.007 [DOI] [PMC free article] [PubMed] [Google Scholar]
- 21.Robillard KR, Hoque T, Bendayan R. 2012. Expression of ATP-binding cassette membrane transporters in rodent and human Sertoli cells: relevance to the permeability of antiretroviral therapy at the blood-testis barrier. J. Pharmacol. Exp. Ther. 340:96–108. 10.1124/jpet.111.186916 [DOI] [PubMed] [Google Scholar]
- 22.Zastre JA, Chan GNY, Ronaldson PT, Ramaswamy M, Couraud PO, Romero IA, Weksler BB, Bendayan M, Bendayan R. 2009. Up-regulation of P-glycoprotein by HIV protease inhibitors in human brain microvessel endothelial cells. J. Neurosci. Res. 87:1023–1036. 10.1002/jnr.21898 [DOI] [PubMed] [Google Scholar]
- 23.Kis O, Zastre JA, Hoque MT, Walmsley SL, Bendayan R. 2013. Role of drug efflux and uptake transporters in atazanavir intestinal permeability and drug-drug interactions. Pharm. Res. 30:1050–1064. 10.1007/s11095-012-0942-y [DOI] [PubMed] [Google Scholar]
- 24.Kim RB, Fromm MF, Wandel C, Leake B, Wood AJ, Roden DM, Wilkinson GR. 1998. The drug transporter P-glycoprotein limits oral absorption and brain entry of HIV-1 protease inhibitors. J. Clin. Invest. 101:289–294. 10.1172/JCI1269 [DOI] [PMC free article] [PubMed] [Google Scholar]
- 25.Lie PP, Cheng CY, Mruk DD. 2010. Crosstalk between desmoglein-2/desmocollin-2/Src kinase and coxsackie and adenovirus receptor/ZO-1 protein complexes, regulates blood-testis barrier dynamics. Int. J. Biochem. Cell Biol. 42:975–986. 10.1016/j.biocel.2010.02.010 [DOI] [PMC free article] [PubMed] [Google Scholar]
- 26.Bookout AL, Cummins CL, Mangelsdorf DJ, Pesola JM, Kramer MF. 2006. High-throughput real-time quantitative reverse transcription PCR. Curr. Protoc. Mol. Biol. Chapter 15:Unit 15.8. 10.1002/0471142727.mb1508s73 [DOI] [PubMed] [Google Scholar]
- 27.Livak KJ, Schmittgen TD. 2001. Analysis of relative gene expression data using real-time quantitative PCR and the 2(−delta delta C(T)) method. Methods 25:402–408. 10.1006/meth.2001.1262 [DOI] [PubMed] [Google Scholar]
- 28.Hoque MT, Robillard KR, Bendayan R. 2012. Regulation of breast cancer resistant protein (BCRP) by peroxisome proliferator-activated receptor alpha (PPARalpha) in human brain microvessel endothelial cells. Mol. Pharmacol. 81:598–609. 10.1124/mol.111.076745 [DOI] [PubMed] [Google Scholar]
- 29.Gupta A, Zhang Y, Unadkat JD, Mao Q. 2004. HIV protease inhibitors are inhibitors but not substrates of the human breast cancer resistance protein (BCRP/ABCG2). J. Pharmacol. Exp. Ther. 310:334–341. 10.1124/jpet.104.065342 [DOI] [PubMed] [Google Scholar]
- 30.Storch CH, Theile D, Lindenmaier H, Haefeli WE, Weiss J. 2007. Comparison of the inhibitory activity of anti-HIV drugs on P-glycoprotein. Biochem. Pharmacol. 73:1573–1581. 10.1016/j.bcp.2007.01.027 [DOI] [PubMed] [Google Scholar]
- 31.Weiss J, Rose J, Storch CH, Ketabi-Kiyanvash N, Sauer A, Haefeli WE, Efferth T. 2007. Modulation of human BCRP (ABCG2) activity by anti-HIV drugs. J. Antimicrob. Chemother. 59:238–245. 10.1093/jac/dkl474 [DOI] [PubMed] [Google Scholar]
- 32.Hrycay EG, Bandiera SM. 2009. Expression, function and regulation of mouse cytochrome P450 enzymes: comparison with human P450 enzymes. Curr. Drug Metab. 10:1151–1183. 10.2174/138920009790820138 [DOI] [PubMed] [Google Scholar]
- 33.Ghosn J, Chaix ML, Peytavin G, Rey E, Bresson JL, Goujard C, Katlama C, Viard JP, Treluyer JM, Rouzioux C. 2004. Penetration of enfuvirtide, tenofovir, efavirenz, and protease inhibitors in the genital tract of HIV-1-infected men. AIDS 18:1958–1961. 10.1097/00002030-200409240-00014 [DOI] [PubMed] [Google Scholar]
- 34.Yilmaz A, Price RW, Gisslen M. 2012. Antiretroviral drug treatment of CNS HIV-1 infection. J. Antimicrob. Chemother. 67:299–311. 10.1093/jac/dkr492 [DOI] [PubMed] [Google Scholar]
- 35.Harrigan PR, Whaley M, Montaner JS. 1999. Rate of HIV-1 RNA rebound upon stopping antiretroviral therapy. AIDS 13:F59–F62. 10.1097/00002030-199905280-00001 [DOI] [PubMed] [Google Scholar]
- 36.Holkmann Olsen C, Mocroft A, Kirk O, Vella S, Blaxhult A, Clumeck N, Fisher M, Katlama C, Phillips AN, Lundgren JD. 2007. Interruption of combination antiretroviral therapy and risk of clinical disease progression to AIDS or death. HIV Med. 8:96–104. 10.1111/j.1468-1293.2007.00436.x [DOI] [PubMed] [Google Scholar]
- 37.Dauchy S, Dutheil F, Weaver RJ, Chassoux F, Daumas-Duport C, Couraud PO, Scherrmann JM, De Waziers I, Decleves X. 2008. ABC transporters, cytochromes P450 and their main transcription factors: expression at the human blood-brain barrier. J. Neurochem. 107:1518–1528. 10.1111/j.1471-4159.2008.05720.x [DOI] [PubMed] [Google Scholar]
- 38.Hagemeyer CE, Rosenbrock H, Ditter M, Knoth R, Volk B. 2003. Predominantly neuronal expression of cytochrome P450 isoforms CYP3A11 and CYP3A13 in mouse brain. Neuroscience 117:521–529. 10.1016/S0306-4522(02)00955-7 [DOI] [PubMed] [Google Scholar]
- 39.Rosenbrock H, Hagemeyer CE, Ditter M, Knoth R, Volk B. 2001. Identification, induction and localization of cytochrome P450s of the 3A-subfamily in mouse brain. Neurotox. Res. 3:339–349. 10.1007/BF03033195 [DOI] [PubMed] [Google Scholar]
- 40.Cisternino S, Mercier C, Bourasset F, Roux F, Scherrmann JM. 2004. Expression, up-regulation, and transport activity of the multidrug-resistance protein Abcg2 at the mouse blood-brain barrier. Cancer Res. 64:3296–3301. 10.1158/0008-5472.CAN-03-2033 [DOI] [PubMed] [Google Scholar]
- 41.Giri N, Shaik N, Pan G, Terasaki T, Mukai C, Kitagaki S, Miyakoshi N, Elmquist WF. 2008. Investigation of the role of breast cancer resistance protein (Bcrp/Abcg2) on pharmacokinetics and central nervous system penetration of abacavir and zidovudine in the mouse. Drug Metab. Dispos. 36:1476–1484. 10.1124/dmd.108.020974 [DOI] [PMC free article] [PubMed] [Google Scholar]
- 42.Choo EF, Leake B, Wandel C, Imamura H, Wood AJJ, Wilkinson GR, Kim RB. 2000. Pharmacological inhibition of P-glycoprotein transport enhances the distribution of HIV-1 protease inhibitors into brain and testes. Drug Metab. Dispos. 28:655–660 [PubMed] [Google Scholar]
- 43.Huisman MT, Smit JW, Wiltshire HR, Hoetelmans RM, Beijnen JH, Schinkel AH. 2001. P-glycoprotein limits oral availability, brain, and fetal penetration of saquinavir even with high doses of ritonavir. Mol. Pharmacol. 59:806–813. 10.1124/mol.59.4.806 [DOI] [PubMed] [Google Scholar]
- 44.Huisman MT, Smit JW, Wiltshire HR, Beijnen JH, Schinkel AH. 2003. Assessing safety and efficacy of directed P-glycoprotein inhibition to improve the pharmacokinetic properties of saquinavir coadministered with ritonavir. J. Pharmacol. Exp. Ther. 304:596–602. 10.1124/jpet.102.044388 [DOI] [PubMed] [Google Scholar]
- 45.Hendrikse NH, Schinkel AH, de Vries EG, Fluks E, Van der Graaf WT, Willemsen AT, Vaalburg W, Franssen EJ. 1998. Complete in vivo reversal of P-glycoprotein pump function in the blood-brain barrier visualized with positron emission tomography. Br. J. Pharmacol. 124:1413–1418. 10.1038/sj.bjp.0701979 [DOI] [PMC free article] [PubMed] [Google Scholar]
- 46.Sasongko L, Link JM, Muzi M, Mankoff DA, Yang X, Collier AC, Shoner SC, Unadkat JD. 2005. Imaging P-glycoprotein transport activity at the human blood-brain barrier with positron emission tomography. Clin. Pharmacol. Ther. 77:503–514. 10.1016/j.clpt.2005.01.022 [DOI] [PubMed] [Google Scholar]
- 47.Bauer M, Karch R, Zeitlinger M, Stanek J, Philippe C, Wadsak W, Mitterhauser M, Jager W, Haslacher H, Muller M, Langer O. 2013. Interaction of 11C-tariquidar and 11C-elacridar with P-glycoprotein and breast cancer resistance protein at the human blood-brain barrier. J. Nucl. Med. 54:1181–1187. 10.2967/jnumed.112.118232 [DOI] [PMC free article] [PubMed] [Google Scholar]
- 48.Muzi M, Mankoff DA, Link JM, Shoner SC, Collier AC, Sasongko L, Unadkat JD. 2009. Imaging of cyclosporine inhibition of P-glycoprotein activity using 11C-verapamil in the brain: studies of healthy humans. J. Nucl. Med. 50:1267–1275. 10.2967/jnumed.108.059162 [DOI] [PMC free article] [PubMed] [Google Scholar]
- 49.Holmstock N, Mols R, Annaert P, Augustijns P. 2010. In situ intestinal perfusion in knockout mice demonstrates inhibition of intestinal p-glycoprotein by ritonavir causing increased darunavir absorption. Drug Metab. Dispos. 38:1407–1410. 10.1124/dmd.110.032771 [DOI] [PubMed] [Google Scholar]
- 50.Van Waterschoot RA, Ter Heine R, Wagenaar E, van der Kruijssen CM, Rooswinkel RW, Huitema AD, Beijnen JH, Schinkel AH. 2010. Effects of cytochrome P450 3A (CYP3A) and the drug transporters P-glycoprotein (MDR1/ABCB1) and MRP2 (ABCC2) on the pharmacokinetics of lopinavir. Br. J. Pharmacol. 160:1224–1233. 10.1111/j.1476-5381.2010.00759.x [DOI] [PMC free article] [PubMed] [Google Scholar]
- 51.Josephson F. 2010. Drug-drug interactions in the treatment of HIV infection: focus on pharmacokinetic enhancement through CYP3A inhibition. J. Intern. Med. 268:530–539. 10.1111/j.1365-2796.2010.02301.x [DOI] [PubMed] [Google Scholar]
- 52.Guo Y, Pope C, Cheng X, Zhou H, Klaassen CD. 2011. Dose-response of berberine on hepatic cytochromes P450 mRNA expression and activities in mice. J. Ethnopharmacol. 138:111–118. 10.1016/j.jep.2011.08.058 [DOI] [PMC free article] [PubMed] [Google Scholar]
- 53.Richardson TA, Sherman M, Kalman D, Morgan ET. 2006. Expression of UDP-glucuronosyltransferase isoform mRNAs during inflammation and infection in mouse liver and kidney. Drug Metab. Dispos. 34:351–353. 10.1124/dmd.105.007435 [DOI] [PMC free article] [PubMed] [Google Scholar]
- 54.Chan GN, Hoque MT, Cummins CL, Bendayan R. 2011. Regulation of P-glycoprotein by orphan nuclear receptors in human brain microvessel endothelial cells. J. Neurochem. 118:163–175. 10.1111/j.1471-4159.2011.07288.x [DOI] [PubMed] [Google Scholar]