

ABSTRACT
The latent HIV reservoir is a major impediment to curing HIV infection. The contribution of CD4+ T cell activation status to the establishment and maintenance of the latent reservoir was investigated by enumerating viral DNA components in a cohort of 12 individuals commencing antiretroviral therapy (ART) containing raltegravir, an integrase inhibitor. Prior to ART, the levels of total HIV DNA were similar across HLA-DR+ and HLA-DR− (HLA-DR±) CD38± memory CD4+ T cell phenotypes; episomal two-long terminal repeat (2-LTR) HIV DNA levels were higher in resting (HLA-DR− CD38−) cells, and this phenotype exhibited a significantly higher ratio of 2-LTR to integrated HIV DNA (P = 0.002). After 1 year of ART, there were no significant differences across each of the memory phenotypes of any HIV DNA component. The decay dynamics of integrated HIV DNA were slow within each subset, and integrated HIV DNA in the resting HLA-DR− CD38− subset per mm3 of peripheral blood exhibited no significant decay (half-life of 25 years). Episomal 2-LTR HIV DNA decayed relative to integrated HIV DNA in resting cells with a half-life of 134 days. Surprisingly, from week 12 on, the decay rates of both total and episomal HIV DNA were lower in activated CD38+ cells. By weeks 24 and 52, HIV RNA levels in plasma were most significantly correlated with the numbers of resting cells containing integrated HIV DNA. On the other hand, total HIV DNA levels in all subsets were significantly correlated with the numbers of HLA-DR+ CD38− cells containing integrated HIV DNA. These results provide insights into the interrelatedness of cell activation and reservoir maintenance, with implications for the design of therapeutic strategies targeting HIV persistence.
IMPORTANCE It is generally believed that HIV is not cleared by extensive antiretroviral therapy (ART) due to the difficulty in eradicating the latent reservoir in resting CD4+ T cells. New therapies that attempt to activate this reservoir so that immune or viral cytopathic mechanisms can remove those infected cells are currently being investigated. However, results obtained in this research indicate that activation, at least on some level, already occurs within this reservoir. Furthermore, we are the first to describe the dynamics of different HIV DNA species in resting and activated memory CD4+ T cell subsets that point to the role different levels of activation play in maintaining the HIV reservoir.
INTRODUCTION
HIV antiretroviral therapy (ART) quickly reduces the pool of infected, activated CD4+ T cells responsible for the vast majority of virions observed in peripheral blood, reduces inflammation, and increases CD4+ T cell counts to levels closer to normalcy, but there the progress toward elimination of this chronic infection generally ends. This lack of progress is reflected in vivo by rapid recrudescence if ART is interrupted and also recorded by two ex vivo measures of infection: (i) plasma viral levels (pVL) that are continually present at low levels and observable with ultrasensitive assays in many patients and (ii) measures of HIV DNA within CD4+ T cells. Although current therapies result in the latter measures decreasing in size and form, the latent reservoir of replication-competent integrated HIV DNA in long-lived resting CD4+ T cells decays at rates that make it virtually refractory to treatment (1). It is this hurdle that is engendering other therapeutic approaches that hope to sufficiently activate latently infected cells, allowing accelerated depletion and removal of the reservoir well within an infected person's lifetime.
However, the process by which the latent reservoir is established and maintained is not clearly understood. Although quiescent cells can be infected with HIV, in vitro experiments have established that complete reverse transcription to HIV DNA is more likely in proliferating cells (2, 3). Latent infection, where replication-competent HIV DNA is integrated into the host cell genome but is not transcribed, can occur directly in resting cells (4), but it is believed that this mostly occurs when activated cells with integrated HIV DNA convert to a resting state as part of the process of memory cell generation (5). There is an ongoing debate regarding the extent to which direct infection of resting cells plays in sustaining this reservoir in vivo. The degree to which cellular activation acts to decrease and/or regenerate this reservoir is also unclear.
Although HIV DNA components have been studied longitudinally in peripheral blood mononuclear cells (PBMC) or CD4+ T cells and by viral outgrowth studies in resting CD4+ T cells (1, 6–8), a comparison of their dynamics between resting and activated phenotypes has not previously been performed. A better characterization of the relative contributions of these linked compartments is critical to a complete understanding of the dynamics of the reservoir and the rational design of therapeutic interventions.
Here we analyze data from a well-defined cohort of therapy-naive HIV-infected individuals who were treated with ART including the integrase inhibitor raltegravir (RAL) during either primary HIV infection (PHI) or chronic HIV infection (CHI) (the PINT Study [9, 10]). In order to establish a more complete picture of the mechanisms contributing to the latent reservoir, we compared the dynamics of three components of HIV DNA, total, episomal (two-long terminal repeat [2-LTR]), and integrated HIV DNA longitudinally over 1 year. Each of these HIV DNA components was determined within stringently defined resting and activated memory CD4+ T cell subsets, since the majority of HIV DNA is contained within memory (CD45RO+) CD4+ T cells (11, 12). These resting and activated T cell subsets were defined by the differential expression of the activation markers CD38 and HLA-DR. We found persistence of all forms of HIV DNA in activated memory CD4+ T cells, long after the decrease in cellular activation that accompanies suppression of viral replication with ART, suggesting that there is continual de novo replenishment of this component of the reservoir either by reactivation of infected resting cells or by new infection.
MATERIALS AND METHODS
At weeks 0, 12, 24, and 52, 200 ml of whole blood was obtained by venesection from 6 PHI and 6 CHI patients enrolled in the PINT Study (9, 10), where each of these antiretroviral-naive patients received ART commencing at week 0 consisting of RAL plus the reverse transcriptase inhibitors tenofovir and emtricitabine. The study protocol was approved by the Human Research Ethics Committee at St. Vincent's Hospital (07/SVH/89). Written informed consent was obtained from each participant. Subsets of CD4+ CD45RO+ T cells, based on coexpression of the CD38 and HLA-DR activation markers, were purified from cryopreserved patient PBMC by cell sorting using a FACSAria as previously described (13). At baseline, cells were sorted into the HLA-DR− CD38− (resting), HLA-DR− CD38+, HLA-DR+ CD38+ (activated), and HLA-DR+ CD38− phenotypes. After week 12, due to the very low proportion of HLA-DR+ CD38+ activated CD4+ CD45RO+ cells, the sorting strategy was modified to sort cells into the HLA-DR− CD38− (resting), HLA-DR+ CD38−, and CD38+ phenotypes (Fig. 1). Results of preliminary experiments clearly demonstrated that the summing of the DNA levels in the two sorted activated subsets gave equivalent results to the estimations of DNA viral load in the sorted CD38+ population (data not shown). To ensure the estimations of DNA content of each subset were strictly restricted to the individual subsets, we included in the analysis only the cells that satisfied stringent flow cytometry gating for HLA-DR and CD38 expression (Fig. 1A). Hence, we excluded a proportion of memory cells that had intermediate expression levels of these molecules from the sorting gates, resulting in purity of sorted populations exceeding 95% in every case. This meant that summing HIV DNA levels over these memory subsets will differ from estimates over the total CD4+ T cell population (10). The definition of HLA-DR− CD38− memory CD4+ T cells as resting cells was supported by the low background levels of Ki-67 expression (<1%) in this subset compared to much higher levels in the 3 other memory subsets (ranging from 6% to 29% Ki-67+ at week 0).
FIG 1.

Sorting strategy for resting and activated memory CD4+ T cells for a typical PHI patient at two different times. (A) Sorting strategy for resting and activated memory CD4+ T cells for a typical PHI patient at week 0 into the 4 memory CD4+ T cell subsets, HLA-DR− CD38−, HLA-DR+ CD38−, HLA-DR− CD38+, and HLA-DR+ CD38+ cells. (B) Sorting strategy for resting and activated memory CD4+ T cells for a typical PHI patient at week 52 into the 3 memory subsets, HLA-DR− CD38−, HLA-DR+ CD38−, and CD38+ cells. Abbreviations: 50K, 50,000; FSC, forward scatter; SSC, side scatter; PerCP, peridinin chlorophyll protein; PE, phycoerythrin.
Total, integrated, and episomal HIV DNA (2-LTR) copies per 106 cells within each subset were determined as previously described (9), with limits of quantification (LOQ) of 125 copies per 106 cells. HIV RNA copies/ml of plasma were determined by an assay with a LOQ of 0.3 copies per ml (14). Total cellular DNA was extracted from the purified memory CD4+ T cell subsets, and total HIV DNA was quantified by a real-time PCR assay specific for each HIV DNA subspecies. Primers and probes were selected based on sequencing data for individual patients. All assay outputs providing results below the assay LOQ were set at the LOQ.
Copies of each HIV DNA component per 106 cells of a CD4+ T cell subset x were converted to a value for copies per mm3 of peripheral blood y within that subset, through the formula y = (x/106)(q/100)(a), where q is the percentage of the subset per memory CD4+ T cells, and a is the number of memory (CD45RO+) CD4+ T cells/mm3. Correlations between plasma viral levels (pVL) and HIV DNA components in different subsets were determined as Spearman rank correlations. Comparisons between groups were performed with a Wilcoxon rank sum test, and a significance value of P < 0.05 was chosen. Comparison across more than 2 groups was performed by the Kruskal-Wallis test. Single-phase and biphasic decay curves for the HIV DNA species in each subset were determined with mixed-effects models.
Some of the correlations between HIV DNA components/mm3 in different cell subsets will be significant, say between a component i and a component j, because each is correlated with another component, k. We eliminated these inherited correlations by determining the shortest paths between each of the HIV DNA components that were linked through significant correlations, with weights on each connection given by −log(1 − pij) where pij is the significance of the correlation joining i and j. Shortest paths (that extracted these reduced significant correlations) between all nodes (total, 2-LTR, episomal HIV DNA/mm3 per memory CD4+ T cell subset) were then determined using Dijkstra's method (graphshortestpath, Matlab 2012a). The reduced significant correlations consisted of all correlations contained in at least one of the shortest paths.
RESULTS
HIV DNA prior to ART.
Although resting CD4+ T cells can be infected with HIV, in vitro experiments have established that complete reverse transcription of HIV DNA is much more efficient in proliferating cells (2, 3). However, this restriction prior to completion of reverse transcription in resting cells was not evident in our ex vivo analysis, since total HIV DNA was equally likely to be found in each of the subsets of memory CD4+ T cells regardless of activation status prior to the commencement of ART at week 0 (P = 0.43 for difference between subsets) (Fig. 2). Between 5% and 11% (these and subsequent percentages are upper bounds assuming a single HIV DNA copy per infected cell [15]) of these memory CD4+ T cells contained total HIV DNA. It was less likely, though it did not reach statistical significance (P = 0.09), that this total, and mostly linear, HIV DNA, successfully proceeded to integration in resting (HLA-DR− CD38−) cells. Only 0.08% of HLA-DR− CD38− cells contained integrated HIV DNA compared to the other phenotypes (0.25% of HLA-DR− CD38+, 0.29% of HLA-DR+ CD38−, 0.38% of HLA-DR+ CD38+). This poorer completion rate from linear to integrated HIV DNA in resting cells was also reflected in these cells containing significantly higher levels of abrogated infection represented by the presence of episomal (2-LTR) HIV DNA compared to activated cells (HLA-DR+ CD38+, P = 0.02). The lower success rate of incorporation of HIV DNA within the genome of resting memory cells was further supported by higher ratios of total to integrated HIV DNA copies (median value of 62 for HLA-DR− CD38− cells versus 15 for HLA-DR+ CD38+ cells; P = 0.047; Table 1) and higher ratios of 2-LTR to integrated HIV DNA copies (P = 0.002). Activated memory cells were also less likely to contain 2-LTR in PHI than in CHI (0.01% versus 0.39%; P = 0.03; Fig. 2).
FIG 2.

Week 0 and week 52 levels of total, 2-LTR, and integrated HIV DNA copies per 106 cells for each cell subset, separated into PHI and CHI. Each symbol represents the value for an individual. The short horizontal lines show the median values for groups. The only statistically significant difference for all patients (combined PHI and CHI) across all cell subsets and at either time point was for 2-LTR HIV DNA at week 0 (P = 0.02), where levels were higher in the resting HLA-DR− CD38− subset than in the activated HLA-DR+ CD38+ subset (median value of 8,906 versus 1,963 copies per 106 cells). Within each subset, levels differed significantly for PHI versus CHI only for 2-LTR HIV DNA levels in the activated HLA-DR+ CD38+ subset at week 0 (125 copies per 106 cells for PHI versus 3,875 copies per 106 cells for CHI; P = 0.03) and for integrated HIV DNA levels in the CD38+ subset at week 52 (263 copies per 106 cells for PHI versus 700 copies per 106 cells for CHI; P = 0.048).
TABLE 1.
Median ratios of HIV DNA subspecies in resting/activated memory CD4+ T cells prior to ART
| Ratio of HIV DNA subspeciesa | Group or parameterb | Median HIV DNA ratioc in the following cells: |
P value (across subsets)d | |||
|---|---|---|---|---|---|---|
| HLA-DR− CD38− | HLA-DR− CD38+ | HLA-DR+ CD38+ | HLA-DR+ CD38− | |||
| Total/2-LTR | All | 12 | 18 | 64 | 23 | 0.1 |
| PHI | 10 | 18 | 90 | 20 | ||
| CHI | 17 | 17 | 18 | 26 | ||
| P value | 0.3 | 1 | 0.1 | 1 | ||
| Total/INT | All | 62+ | 57 | 15− | 46 | 0.047 |
| PHI | 103 | 40 | 12 | 33 | ||
| CHI | 55 | 57 | 15 | 53 | ||
| P value | 0.9 | 0.8 | 0.5 | 0.5 | ||
| 2-LTR/INT | All | 14+ | 2.3 | 0.8− | 1.1− | 0.002 |
| PHI | 14 | 1.3 | 0.2 | 1.0 | ||
| CHI | 10 | 2.7 | 1.3 | 2.5 | ||
| P value | 0.6 | 0.4 | 0.3 | 0.3 | ||
The ratios of total, 2-LTR, and integrated (INT) HIV DNA subspecies are shown.
All individuals (All) and individuals with primary HIV infection (PHI) or chronic HIV infection (CHI) are shown. The significance of differences within each subset between PHI and CHI is displayed in the P value row for each HIV DNA ratio.
Subsets that are significantly different are shown in boldface type with + or − superscript for higher and lower, respectively.
Significance of differences across the four subsets over all individuals.
A much lower proportion of resting cells carried the cellular proliferation marker Ki-67 compared to activated cells (0.86% of HLA-DR− CD38− cells versus 28.69% of HLA-DR+ CD38+ cells at week 0; Fig. 3), with high but intermediate values found in the other phenotypes (6.19% for HLA-DR+ CD38− cells and 11.29% for HLA-DR− CD38+ cells). The only statistically significant difference of Ki-67 levels between PHI and CHI was higher proliferation for PHI within resting cells (1.1% versus 0.4%; P = 0.03). There was a 7-fold-higher proliferation rate in the HLA-DR+ CD38− cells than in the HLA-DR− CD38− cells, which should lead to a continual dilution of episomal HIV DNA, but surprisingly, the median 2-LTR levels were virtually the same.
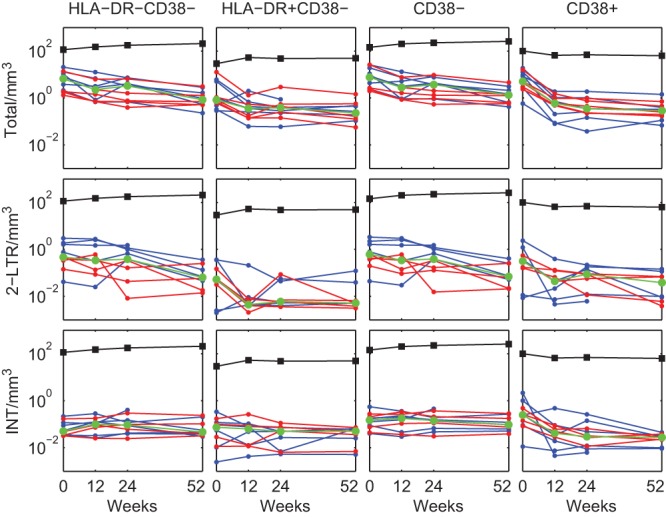
FIG 3.

HIV DNA dynamics in resting/activated memory CD4+ T cell subsets. HIV DNA components (total, 2-LTR, and integrated [INT] HIV DNA) are shown as the number of copies per 106 cells of memory CD4+ T cell subsets: HLA-DR− CD38−, HLA-DR+ CD38−, CD38−, and CD38+ (PHI are shown in blue and CHI in red). The limits of quantification (LOQ) were 125 copies/106 cells. Values below the LOQ were set to the LOQ. The median values are shown in green. The last two rows display medians and interquartile ranges of the number of cells/mm3 and proliferating (Ki-67+) percentages of each subset.
Effect of ART including raltegravir on HIV DNA.
Previous investigations by our group and others have uncovered a generally biphasic decay of HIV DNA and its subspecies with the commencement of ART (6, 10, 16–18), including ART commenced during PHI (19). The exception is an initial increase in 2-LTR HIV DNA if an integrase inhibitor is part of the regimen (10). These observations have been made in either bulk PBMC or in purified bulk CD4+ T cells which are heterogeneous in their makeup. Studies of viral dynamics suggest that the initial decline in pVL occurs in parallel with the decline in productively infected CD4+ T cells (20, 21), while analyses over longer time scales have determined a slow decay of replication-competent latent infection in resting CD4+ T cells (1). Therefore, we expected total and integrated HIV DNA levels to decay quickly with ART to minimal levels in subsets of activated cells, with a smaller decline in HIV DNA species in resting cells. Due to constraints in quantifying HIV DNA within smaller subsets and the rapid decrease of numbers of activated cells following initiation of ART, from week 12 on, the memory CD4+ T cells were sorted into a combined CD38+ (activated) phenotype and the two separate CD38− phenotypes (HLA-DR− CD38− and HLA-DR+ CD38−). However, the expected differential decrease of HIV DNA between activated and resting cells was not observed. After 1 year of ART, there were no differences between CD38+ and CD38− memory CD4+ T cells of numbers of total, episomal, or integrated HIV DNA per 106 cells (Fig. 2). This was despite a 21-fold-higher rate of proliferation, as measured by Ki-67 expression, in the CD38+ subset at week 52 (19.5% of CD38+ memory CD4+ T cells were Ki-67+ compared to only 0.8% of the CD38− subset; P = 0.0002). As we had stringently sorted each memory subset to 96% to 99% purity, this result cannot be explained by contamination from the CD38− subset. However, the relative contribution of activated memory CD4+ T cells to the cellular HIV reservoir is small, given the much lower number of activated CD4+ T cells compared to their resting counterparts, as we previously found in untreated chronically infected subjects (13).
On the other hand, the dynamic changes over the course of the year in these subsets were dependent on the activation status of the cells and the particular HIV DNA component (Fig. 3). Total HIV DNA copies/106 cells decayed in a biphasic manner within each subset (P < 10−6, likelihood ratio test comparison with single-phase decay). The half-life of the slower second phase (week 12 onwards) was 178 days for the resting phenotype (HLA-DR− CD38−), but surprisingly, it was even longer for the more activated subsets (Table 2), suggesting either ongoing infection or cellular reactivation of resting cells containing HIV DNA. The half-life calculations for each subset will be affected by degradation of unintegrated HIV DNA molecules within a cell, loss or conversion to another phenotype, and conversion from another phenotype. The half-lives calculated here are therefore summary measures of all of these dynamic influences. A comparison of individual regression curves of log total HIV DNA from week 12 onwards confirmed the significantly faster second phase decay within resting HLA-DR− CD38− cells compared to HLA-DR+ CD38− and CD38+ cells (P = 0.0004).
TABLE 2.
Half-lives of the 3 HIV DNA components per 106 cells of the T cell subsetsa
| HIV DNA | Half-life (days) of the indicated HIV DNA component in the following T cell subset: |
|||
|---|---|---|---|---|
| HLA-DR− CD38− | HLA-DR+ CD38− | CD38− | CD38+ | |
| Total DNA | 47, 178 | 32, 6,932b | 43, 198 | 27, 462 |
| 2-LTR DNA | 98 | 24, −630c | 99 | 173 |
| Integrated DNA | 433 | 64, 3,466b | 116, 533 | 41, 433 |
The half-lives of the three HIV DNA components per 106 cells are shown. Both a monophasic curve and a biphasic curve (first phase from week 0 to week 12, with the second phase from week 12 to week 52) were fitted to each data set using a nonlinear mixed-effects method, where the initial value of the fitted curve included a random effect, but each slope parameter was treated as a fixed effect. The best fitted curve was determined using the likelihood ratio test. Entries with two half-lives recorded had the biphasic curve as the best fit (half-lives of first and second phase, respectively); otherwise, the single curve was the best fit and that half-life (t1/2 = ln 2/k, for the slope parameter k) is recorded (a negative half-life denotes a doubling time). When the biphasic model was the best fit, the initial decay was limited by having data only for weeks 0 and 12, so that the half-life reported there provides an upper bound. The second phase half-life estimate of 2-LTR HIV DNA in the HLA-DR+ CD38− subset was affected by the majority of individuals having levels below detection after week 12 (and that were recorded as equal to the LOQ).
The final phase decay rate was not significantly different from zero.
From week 12 on, most 2-LTR HIV DNA levels per 106 HLA-DR+ CD38− were below the assay LOQ.
In this analysis, the decay of episomal HIV DNA was mostly monophasic, although any peaks in this HIV DNA component that were previously observed in bulk CD4+ T cells at week 2 or 3 (10) would not have registered here, since collection of large volumes of peripheral blood for cell sorting was necessarily limited. Episomal HIV DNA decay in the HLA-DR+ CD38− subset was markedly different from the dynamics in the other subsets, exhibiting rapid decay to below the assay LOQ. Decay rates of 2-LTR from week 12 onwards were significantly lower in the activated CD38+ subset versus the resting CD38− subset (P = 0.04), reflecting the situation for total HIV DNA (Fig. 3).
The early decay of total HIV DNA/106 cells (measured by change from week 0 to week 12) differed across phenotypes with a faster loss within CD38+ cells (27-day half-life; Table 2) than for resting HLA-DR− CD38− cells (47-day half-life, P = 0.01). As would be expected with the loss of the productively infected subset at the start of ART, integrated HIV DNA also decayed faster over the first 12 weeks in CD38+ cells than in resting HLA-DR− CD38− memory CD4+ T cells. In the latter subset, the decay of integrated HIV DNA was essentially monophasic over the entire year (433-day half-life; P = 0.01). However, decay rates for integrated HIV DNA from week 12 onwards did not differ across the subsets (P = 0.6), which again was surprising given the very different Ki-67 profiles for each of these subsets (Fig. 3).
Half-lives of unintegrated HIV DNA molecules.
Given the relatively stable levels of integrated HIV DNA within the resting memory phenotype and that these cells are likely long-lived (as reflected by their low proliferation rates), any loss of the other HIV DNA components in comparison to the integrated form should represent decay of the HIV DNA species rather than the cell itself. Hence, we estimated the decay rates of 2-LTR and total HIV DNA relative to integrated HIV DNA/106 HLA-DR− CD38− cells from week 12 on (Fig. 4). Linear regression performed on each patient for these ratios determined decay rates that were significantly different from zero with median half-lives of 134 days for 2-LTR (P = 0.006) and 181 days for total HIV DNA (P = 0.01).
FIG 4.
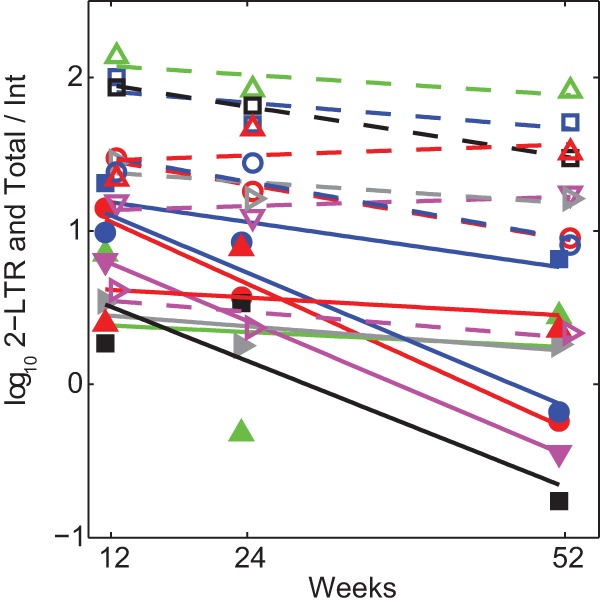
Decay of 2-LTR and total HIV DNA relative to integrated HIV DNA in resting memory CD4+ T cells. Decay of log10 of ratios of 2-LTR to integrated HIV DNA copies (solid lines and symbols), and total to integrated HIV DNA copies (dashed lines and open symbols) in the resting HLA-DR− CD38− memory CD4+ T cell phenotype from week 12. Individuals with integrated HIV DNA below the assay LOQ were omitted.
Resting cells with integrated HIV DNA are refractory to ART.
Although the number of HIV DNA copies per 106 CD4+ T cells of any subset will change according to loss or expansion of the DNA species and/or the cells containing them, their absolute numbers in peripheral blood will also change with any expansion or contraction of cell numbers due to immune reconstitution with ART. The absolute numbers of cells within each of the CD38− subsets increased over time when calculated per mm3 of peripheral blood. To compensate for this effect, we converted HIV DNA copies per 106 cells to HIV DNA copies per mm3 of peripheral blood for each subset by taking into account the percentage of total CD4+ T cells per mm3 represented by each subset (Materials and Methods). Integrated HIV DNA within each of the CD38− cell subsets (number of copies of HIV DNA per mm3) exhibited decay rates from week 12 on that did not differ statistically from zero (Fig. 5 and Table 3). The half-life of integrated HIV DNA within the resting HLA-DR− CD38− subset per mm3 was approximately 25 years.
FIG 5.
HIV DNA per mm3 dynamics in resting/activated memory CD4+ T cell subsets. HIV DNA components are shown as the number of copies per mm3 of memory CD4+ T cell subsets in peripheral blood: HLA-DR− CD38−, HLA-DR+ CD38−, CD38−, and CD38+ (PHI shown in blue and CHI in red). The median values are shown in green. The median values of the numbers of each cell subset per mm3 are shown as black markers and lines.
TABLE 3.
Half-lives of the three HIV DNA components per mm3 of whole blood for the T cell subsetsa
| HIV DNA | Half-life (days) of the indicated HIV DNA component in the following T cell subset: |
|||
|---|---|---|---|---|
| HLA-DR− CD38− | HLA-DR+ CD38− | CD38− | CD38+ | |
| Total DNA | 75, 224 | 49, 689 | 68, 257 | 24, 365 |
| 2-LTR DNA | 133 | 37c | 142 | 139 |
| Integrated DNA | −8,978b | 698c | 1,442b | 33, 385 |
The half-lives of the three HIV DNA components per mm3 of blood are shown. Model fitting was performed as described in Table 2, footnote a.
The final phase decay rate was not significantly different from zero.
From week 12 on, most 2-LTR HIV DNA levels per 106 HLA-DR+ CD38− cells were below the assay LOQ. The conversion to a corresponding amount per mm3 was therefore affected, and the second phase of this component per mm3 was omitted.
Correlates of pVL and HIV DNA.
We had previously determined that pVL in these patients declined quickly to a geometric mean of 9 HIV RNA copies/ml by week 16, after which time pVL was virtually constant (10). We assessed the connection between viremia, which was above the limit of quantification of the single-copy assay for all individuals at weeks 0 and 12 and for 10 of the 12 individuals at weeks 24 and 52, and each of the HIV DNA subspecies and cell subsets through a correlation analysis at each of the time points after first converting the data to comparable units (copies of HIV RNA per ml and HIV DNA per mm3 of peripheral blood). pVL at weeks 0, 12, and 52 were not correlated with any HIV DNA component in any of the activated/resting memory CD4+ T cell subsets at their respective time points. At week 24 in the constant third phase of decay (10), pVL was positively correlated with levels of both integrated (P = 0.003), and total (P = 0.01) HIV DNA in the resting HLA-DR− CD38− cells/mm3 subset.
Drivers of HIV replication within and between subsets.
Finally, we investigated how the different HIV components in the subsets were related. It is to be expected that some HIV DNA copies observed within a phenotype may occur from infection within that subset, while other copies will arise from infection in another phenotype that subsequently changes phenotype or changes from one HIV DNA subspecies (such as total) to another (such as episomal or integrated).
Before the start of therapy at week 0, many of the HIV DNA components in the different memory subsets were significantly correlated (Fig. 6). In contrast, as viremia and cellular activation decreased with ongoing treatment (Fig. 7), the number of these correlations reduced as shown in the later time points of Fig. 6. At week 0, total HIV DNA expressed as copies/mm3 in the activated HLA-DR+ CD38+ subset showed the most correlations, as denoted by the number of lines extending from that total HIV DNA node to other nodes within the other subsets. Total HIV DNA in this activated subset was significantly positively correlated with integrated HIV DNA within the same subset, with total HIV DNA in HLA-DR− CD38+ and HLA-DR+ CD38− cells, and additionally with 2-LTR levels in resting HLA-DR− CD38− cells. Furthermore, integrated HIV DNA numbers in the activated HLA-DR+ CD38+ subset correlated with integrated levels in both the HLA-DR− CD38+ and HLA-DR− CD38− subsets. This may be due to cells containing integrated HIV DNA changing phenotype either through reversion of activated cells to a resting phenotype or to cellular activation of resting cells.
FIG 6.

Size of each HIV DNA component in resting and activated memory CD4+ T cells during ART and significant correlations between them at each time point. The size of each sector represents median values of total HIV DNA copies/mm3 in each of the CD38± HLA-DR± subsets. The median 2-LTR HIV DNA copies/mm3 is represented by the area of the white circle within each sector. The median integrated HIV DNA copies/mm3 is represented by the area of the white square within each sector. Significant (reduced as described in Materials and Methods) rank correlations between HIV DNA components and subsets at each time are shown as black lines, where a correlation with total HIV DNA is represented by a connection to that sector's more centrally located yellow node. For example, at week 0, the number of total HIV DNA copies/mm3 in the activated CD38+ HLA-DR+ cells (represented by the green sector with correlations to total HIV DNA in this phenotype represented by lines connecting the inner node of this sector) shows the most correlations, significantly correlated with integrated HIV DNA within the same subset but also with total HIV DNA in CD38+ HLA-DR− and CD38− HLA-DR+ cells, plus with 2-LTR levels in resting CD38− HLA-DR− cells.
FIG 7.
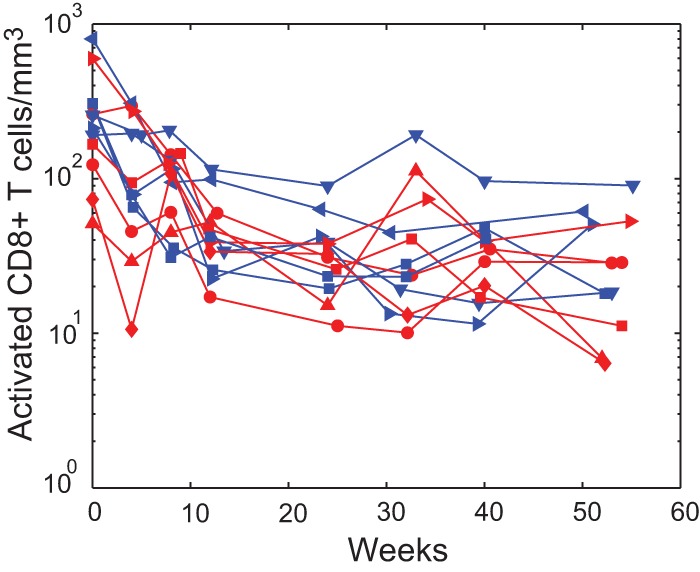
Decline in cellular activation with ART. Biphasic decrease in activated HLA-DR+ CD38+ CD8+ T cells/mm3 with ART (PHI shown in blue and CHI in red).
At week 12, a similar pattern was apparent. Total HIV DNA levels in activated (CD38+) cells continued to correlate with integrated HIV DNA within each of the other subsets (Fig. 6). By week 24, this pattern had changed. Activation had decreased as judged by the reduction in HLA-DR+ CD38+ CD8+ T cells (Fig. 7) to the point where the only correlations between HIV DNA subspecies occurred within rather than between phenotypes (the lines representing significant correlations are contained wholly within each sector of the week 24 graph). However, by week 52, when pVL had been stable at low levels for some time, this situation altered so that integrated HIV DNA in the HLA-DR+ CD38− subset was correlated with total HIV DNA in all phenotypes. At this time, the role of antigen-driven activation of CD4+ T cells has likely diminished, and homeostatic mechanisms may play a larger role in the maintenance of infection.
DISCUSSION
Somewhat contrary to expectations, but consistent with previous observations from our group and others (13, 22), we found total HIV DNA to be present in equivalent proportions across all resting/activated subsets before the commencement of ART (Fig. 2). These ex vivo results differ markedly from the results of in vitro experiments that generally delineate the inability of HIV RNA to complete reverse transcription in resting CD4+ T cells (3, 23, 24), although these studies did not differentiate memory from naive cell populations but considered bulk resting CD4+ T cell populations. On the other hand, downstream events such as the likelihood of HIV DNA proceeding to integration rather than spontaneously circularizing to an episomal form were certainly less likely in resting cells (Table 1). This arrest in conversion of viral DNA to integrated provirus may, for example, be related to a lack of host proteins in resting memory cells, such as BAF (barrier to autointegration factor) that promote integration (25), or suboptimal levels of cytokine signaling (26), but does not appear to be related to differential expression of host enzymes that drive LTR formation (unpublished observations). Despite this holdup, per cell levels of integrated DNA did not differ between the four subpopulations of CD4+ T cells prior to ART. Overall, this would suggest that formation of the latent pool partially occurs through direct infection of resting memory cells, as observed by others (27, 28), and does not entirely arise when activated CD4+ T cells at the point of integrating HIV DNA into their genome revert to a resting memory state (5).
Furthermore, we found that HIV DNA did not reduce to minimal levels in activated CD38+ memory CD4+ T cells after 1 year of ART, despite approximately 20% of these cells undergoing proliferation at this time. This is consistent with findings that despite patients receiving ART for an average of 9.1 years, total HIV DNA was still present in activated CD4+ T cells (defined as CD25+ CD69+ HLA-DR+), and higher than levels in resting cells (CD25− CD69− HLA-DR−) (29). If the very high rate of turnover, as measured by expression of Ki-67, is homogeneous across the activated CD38+ CD45RO+ phenotype, then HIV DNA before ART or in the early stages of ART could form only a very small component of levels in activated cells at 1 year. The vast majority will be from new infection or activation of latently infected resting cells. Homeostatic mechanisms which conceivably result in periodic activation followed by reversion to a resting state of memory CD4+ T cells could also contribute to the maintenance of the pool of activated cells containing HIV DNA, dependent on whether this mechanism of cellular activation maintains latency. For example, treatment with supraphysiological doses of interleukin 7 (IL-7) appears to increase CD4+ T cell counts effectively in patients on stable ART, but the level of HIV DNA remains stable on a per CD4+ cell basis. As the total number of CD4+ T cells increases, this suggests that the total reservoir of HIV DNA increases with this type of intervention (30).
Plasma viremia generally results from productive infection within activated CD4+ T cells prior to ART, whereas it has been expected that the viral reservoir during ART is generally restricted to resting latently infected cells (5). Our data demonstrating the same proportion of integrated HIV DNA in each of the memory CD4+ T cell subsets regardless of CD38 expression is at odds with the view that latent infection is maintained within an essentially quiescent pool of resting cells. While ART reduces the proportion of activated memory CD4+ T cells from 11% to 2.9%, these activated memory cells still contain a high proportion of proliferating cells after reductions in plasma viral load, and therefore likely contribute to maintenance of the reservoir. Integrated viral DNA in this subset is unlikely to all be incompetent virus. Recent elegant studies have demonstrated that although integrated HIV DNA overestimates the replication-competent latent reservoir as measured by viral outgrowth assays from resting CD4+ T cells (31), these two measures are less distant than previously thought (32). Therefore, even after sustained reductions in viral load, there are as many integrated viral genomes in the activated memory cell population as there are in resting memory cells on a per cell basis. Our findings are not inconsistent with those of Chomont et al. (6). Both data sets pose questions regarding the potential therapeutic efficacy of exogenous T cell activation in reducing the reservoir, if there is a similar process of cellular activation already proceeding as part of the pathophysiology of treated HIV infection or if it is a normal part of T cell homeostasis (6).
We observed some circumstantial evidence that cells containing HIV DNA can revert to a more resting status, a process that is thought to generate latent infection. The 100-fold decrease in 2-LTR HIV DNA in HLA-DR+ CD38− cells over the first 12 weeks was not duplicated in the other subsets, and it possibly resulted from these partially activated cells reverting to a HLA-DR− CD38− phenotype and carrying their episomal cargo with them (Fig. 3). However, this same phenotypic conversion and transport of HIV DNA were not observed for integrated HIV DNA. The intermediate activated HLA-DR+ CD38− phenotype, in which approximately 5% of cells consistently expressed Ki-67 (Fig. 3), may increase their numbers through homeostatic proliferation, thereby diluting episomal and other unintegrated HIV DNA while doubling the integrated HIV DNA content. As these cells become further activated, they can also reseed the CD38+ compartment, as we observed in the correlation of integrated HIV DNA in HLA-DR+ CD38− cells/mm3 with integrated and total HIV DNA in the CD38+ subset at week 52 (Fig. 6).
The rate at which the latent reservoir decays under ART has been determined by measuring HIV DNA copies in PBMC or CD4+ T cells and by examining viral outgrowth from resting CD4+ T cells (1, 7, 8, 17), with the subsequent analysis performed on the change in these measures per fixed number of cells. The decay of the percentage of resting cells containing latent infection has been estimated to have a half-life of 44 months (1). However, according to our estimates, this percentage of long-lived infected cells changes not because the number of infected cells decreases but because the number of uninfected resting cells increases with immune reconstitution (Fig. 3). In this study, the absolute number, rather than the percentage, of resting memory cells containing integrated HIV DNA did not change with time (Table 3), consistent with the results of Mexas et al. (33), suggesting that even the long periods previously calculated for the eradication of HIV infection on ART may underestimate its recalcitrance. However, our measurements were limited to a 1-year period, so they may underestimate loss with additional treatment time. Other investigators have observed pVL decline over a 3-year period after the commencement of ART (34). On the other hand, the faster dynamics of a raltegravir-containing regimen (35) feasibly results in pVL reaching the latent third phase earlier, as observed in these patients in a related study (10). The conversion from HIV DNA copies per 106 cells to per mm3 also requires accurate estimates of each cell subset per mm3, and although this is standard, it can introduce additional error. This measure will also be affected by perturbed trafficking, especially over the initial period of ART when cellular activation remains elevated (Fig. 7), but less so over the later period when our measure of latent decay was obtained.
Episomal HIV DNA numbers can decrease due to intracellular degradation of 2-LTR circles but can also be lost through cell death and diluted through cellular proliferation. To minimize the impact of cell death and proliferation on delineating the dynamics of this HIV DNA species, we compared changes in 2-LTR levels to integrated HIV DNA in the resting HLA-DR− CD38− subset. Even in this minimally changing niche, 2-LTR HIV DNA decreased with a half-life of 134 days relative to integrated HIV DNA. The loss of 2-LTR HIV DNA in CD4+ T cells as a whole will be affected by the underlying decay of this DNA species and the half-lives of the cells being considered, and taking these different mechanisms into consideration may partly explain the controversy surrounding in vitro and ex vivo 2-LTR decay estimates (18, 36–38). Approximately 0.36% of these resting memory cells expressed the proliferation marker Ki-67 after week 12. Since the percentage of CD4+ T cells expressing Ki-67 is approximately 5-fold higher than the percentage of dividing cells (39), then approximately 0.07% of these resting memory cells are dividing per day. Therefore, 2-LTR HIV DNA will decrease at this rate if episomal HIV DNA is lost to the cytoplasm of dividing cells and is degraded, but cells containing integrated HIV DNA will increase at this same rate as these cells divide. Hence, the ratio of 2-LTR to integrated HIV DNA copies will decrease at 0.14% per day, giving a half-life of 495 days for this ratio under cell division alone, much longer than the half-life of 134 days observed here. This implies either a faster 2-LTR decrease than due solely to cellular proliferation and/or additional integrated HIV DNA arising in these resting cells through ongoing infection. From week 12 on, 2-LTR HIV DNA decreased with equivalent half-lives in each CD4+ T memory cell subset regardless of their activation status and exhibited very different proliferation profiles. One explanation of this is that it reflects ongoing infection that evades the block provided by the two reverse transcriptase inhibitors in this antiretroviral regimen but that is subsequently inhibited by the integrase inhibitor generating new episomal HIV DNA (40).
It should be noted that relative levels of total and integrated HIV DNA differ from other studies where these ratios are usually lower both before and during ART (16). It may be that the PCR assays used here overestimate total levels and/or underestimate integrated HIV DNA levels depending on the distance at which the viral genome integrates relative to Alu repeat elements (27). Assay variation can explain some of this discrepancy; however, the antiretroviral regimen will also contribute to the much higher levels of total versus integrated HIV DNA observed after commencement of ART in this study, especially at later time points. Antiretroviral regimens that do not include an integrase inhibitor result in total HIV DNA levels approaching integrated HIV DNA levels, with much lower 2-LTR levels (6, 16, 33). On the other hand, raltegravir increases episomal HIV DNA both in vitro and in vivo while it inhibits further integration events (10, 40, 41). Hence, it is to be expected that 2-LTR levels will be elevated in our study and that 1-LTR levels that cannot be directly quantitated may also contribute to the total HIV DNA complement (40, 42), so that total HIV DNA stays in excess of integrated HIV DNA (Fig. 2).
Furthermore, the conservative gates used for sorting memory CD4+ T cells into purified subsets omitted those cells with intermediate values of CD38 and/or HLA-DR and their HIV DNA cargo (or lack of it). This may have altered the amount of each HIV DNA attributed to each subset of the memory CD4+ T cell population. Nevertheless, this is unlikely to affect comparisons between subsets of the same HIV DNA species or the estimates of the decay rate that only take into account changes between successive time points.
In the PINT Study, we found that 2-LTR HIV DNA per 106 CD4+ T cells peaked approximately 3 weeks after the commencement of this integrase inhibitor-containing ART regimen (9, 10). The larger blood volumes required for the current investigation precluded investigation of which resting/activated memory CD4+ T cell subset was responsible for the peak observed in bulk CD4+ T cells, but prior to commencement of ART, a mean of 0.6 HLA-DR− CD38− memory cells per mm3 contained 2-LTR HIV DNA compared to 0.02 HLA-DR+ CD38− cells and 0.12 CD38+ cells. At week 0, approximately half of the CD38+ cells have a HLA-DR− phenotype. Given the fold differences in 2-LTR levels between all subsets, it seems likely that the peak in 2-LTR HIV DNA originated in the HLA-DR− CD38− subset, with possibly some reversion from the more activated CD38+ subsets where the assembly line of linear unintegrated HIV DNA within these cells is diverted to the 2-LTR track due to the effect of the integrase inhibitor. Reversion of activated cells to a more resting state would be assisted by the decrease in activation induced by the effects of ART. However, at the commencement of an antiretroviral regimen that does not contain an integrase inhibitor, instead of increasing 2-LTR content within resting cells, many of these unintegrated HIV DNA would proceed to integration, resulting in a potential boost to the latent reservoir. For this reason, incorporation of an integrase inhibitor at least for the start of any antiretroviral regimen may be advantageous.
New therapies that attempt to flush out latent infection with agents such as histone deacetylase (HDAC) inhibitors and others such as disulfiram are under investigation (43, 44). Our results suggest eradication strategies such as these aimed mainly at the reactivation of latently infected resting CD4+ T memory cells may face a difficult task, since we observed high levels of proliferation in the more activated CD38+ and HLA-DR+ CD38− memory cells, and yet we saw no substantial decay in integrated HIV DNA in these subsets.
ACKNOWLEDGMENTS
This study is supported in part by a research grant from the Investigator-Initiated Studies Program of Merck and the Kirby Institute, National Health and Medical Research Council (NHMRC) program grant 510448, NHMRC project grant 510325 (J.J.Z., J.J.M., and K.S.), and a Practitioner Fellowship (A.D.K.). The Kirby Institute is funded by the Department of Health & Ageing of the Australian government and is affiliated with the Faculty of Medicine of the University of New South Wales.
We thank the patients who participated in the PINT Study and the clinicians D. Baker, R. Finlayson, and M. Bloch.
Footnotes
Published ahead of print 8 January 2014
J.M.M. and J.J.Z. are co-first authors. A.D.K. and K.K.K. are co-senior authors.
REFERENCES
- 1.Finzi D, Blankson J, Siliciano JD, Margolick JB, Chadwick K, Pierson T, Smith K, Lisziewicz J, Lori F, Flexner C, Quinn TC, Chaisson RE, Rosenberg E, Walker B, Gange S, Gallant J, Siliciano RF. 1999. Latent infection of CD4+ T cells provides a mechanism for lifelong persistence of HIV-1, even in patients on effective combination therapy. Nat. Med. 5:512–517. 10.1038/8394 [DOI] [PubMed] [Google Scholar]
- 2.Swiggard WJ, O'Doherty U, McGain D, Jeyakumar D, Malim MH. 2004. Long HIV type 1 reverse transcripts can accumulate stably within resting CD4+ T cells while short ones are degraded. AIDS Res. Hum. Retroviruses 20:285–295. 10.1089/088922204322996527 [DOI] [PubMed] [Google Scholar]
- 3.Zack JA, Arrigo SJ, Weitsman SR, Go AS, Haislip A, Chen IS. 1990. HIV-1 entry into quiescent primary lymphocytes: molecular analysis reveals a labile, latent viral structure. Cell 61:213–222. 10.1016/0092-8674(90)90802-L [DOI] [PubMed] [Google Scholar]
- 4.Swiggard WJ, Baytop C, Yu JJ, Dai J, Li C, Schretzenmair R, Theodosopoulos T, O'Doherty U. 2005. Human immunodeficiency virus type 1 can establish latent infection in resting CD4+ T cells in the absence of activating stimuli. J. Virol. 79:14179–14188. 10.1128/JVI.79.22.14179-14188.2005 [DOI] [PMC free article] [PubMed] [Google Scholar]
- 5.Siliciano RF, Greene WC. 2011. HIV latency. Cold Spring Harb. Perspect. Med. 1:a007096. 10.1101/cshperspect.a007096 [DOI] [PMC free article] [PubMed] [Google Scholar]
- 6.Chomont N, El-Far M, Ancuta P, Trautmann L, Procopio FA, Yassine-Diab B, Boucher G, Boulassel M-R, Ghattas G, Brenchley JM, Schacker TW, Hill BJ, Douek DC, Routy J-P, Haddad EK, Sekaly R-P 2009. HIV reservoir size and persistence are driven by T cell survival and homeostatic proliferation. Nat. Med. 15:893–900. 10.1038/nm.1972 [DOI] [PMC free article] [PubMed] [Google Scholar]
- 7.Chun TW, Justement JS, Moir S, Hallahan CW, Maenza J, Mullins JI, Collier AC, Corey L, Fauci AS. 2007. Decay of the HIV reservoir in patients receiving antiretroviral therapy for extended periods: implications for eradication of virus. J. Infect. Dis. 195:1762–1764. 10.1086/518250 [DOI] [PubMed] [Google Scholar]
- 8.Siliciano JD, Kajdas J, Finzi D, Quinn TC, Chadwick K, Margolick JB, Kovacs C, Gange SJ, Siliciano RF. 2003. Long-term follow-up studies confirm the stability of the latent reservoir for HIV-1 in resting CD4+ T cells. Nat. Med. 9:727–728. 10.1038/nm880 [DOI] [PubMed] [Google Scholar]
- 9.Koelsch KK, Boesecke C, McBride K, Gelgor L, Fahey P, Natarajan V, Baker D, Bloch M, Murray JM, Zaunders J, Emery S, Cooper DA, Kelleher AD, PINT Study Team 2011. Impact of treatment with raltegravir during primary or chronic HIV infection on RNA decay characteristics and the HIV viral reservoir. AIDS 25:2069–2078. 10.1097/QAD.0b013e32834b9658 [DOI] [PubMed] [Google Scholar]
- 10.Murray JM, McBride K, Boesecke C, Bailey M, Amin J, Suzuki K, Baker D, Zaunders JJ, Emery S, Cooper DA, Koelsch KK, Kelleher AD. 2012. Integrated HIV DNA accumulates prior to treatment while episomal HIV DNA records ongoing transmission afterwards. AIDS 26:543–550. 10.1097/QAD.0b013e328350fb3c [DOI] [PubMed] [Google Scholar]
- 11.Brenchley JM, Hill BJ, Ambrozak DR, Price DA, Guenaga FJ, Casazza JP, Kuruppu J, Yazdani J, Migueles SA, Connors M, Roederer M, Douek DC, Koup RA. 2004. T-cell subsets that harbor human immunodeficiency virus (HIV) in vivo: implications for HIV pathogenesis. J. Virol. 78:1160–1168. 10.1128/JVI.78.3.1160-1168.2004 [DOI] [PMC free article] [PubMed] [Google Scholar]
- 12.Zaunders JJ, Ip S, Munier ML, Kaufmann DE, Suzuki K, Brereton C, Sasson SC, Seddiki N, Koelsch K, Landay A, Grey P, Finlayson R, Kaldor J, Rosenberg ES, Walker BD, Fazekas de St. Groth B, Cooper DA, Kelleher AD. 2006. Infection of CD127+ (interleukin-7 receptor+) CD4+ cells and overexpression of CTLA-4 are linked to loss of antigen-specific CD4 T cells during primary human immunodeficiency virus type 1 infection. J. Virol. 80:10162–10172. 10.1128/JVI.00249-06 [DOI] [PMC free article] [PubMed] [Google Scholar]
- 13.McBride K, Xu Y, Bailey M, Seddiki N, Suzuki K, Murray JM, Gao Y, Yan C, Cooper DA, Kelleher AD, Koelsch KK, Zaunders J. 2013. The majority of HIV type 1 DNA in circulating CD4+ T lymphocytes is present in non-gut-homing resting memory CD4+ T cells. AIDS Res. Hum. Retroviruses 29:1330–1339. 10.1089/aid.2012.0351 [DOI] [PMC free article] [PubMed] [Google Scholar]
- 14.Palmer S, Wiegand AP, Maldarelli F, Bazmi H, Mican JM, Polis M, Dewar RL, Planta A, Liu S, Metcalf JA, Mellors JW, Coffin JM. 2003. New real-time reverse transcriptase-initiated PCR assay with single-copy sensitivity for human immunodeficiency virus type 1 RNA in plasma. J. Clin. Microbiol. 41:4531–4536. 10.1128/JCM.41.10.4531-4536.2003 [DOI] [PMC free article] [PubMed] [Google Scholar]
- 15.Josefsson L, King MS, Makitalo B, Brännström J, Shao W, Maldarelli F, Kearney MF, Hu W-S, Chen J, Gaines H, Mellors JW, Albert J, Coffin JM, Palmer SE. 2011. Majority of CD4+ T cells from peripheral blood of HIV-1-infected individuals contain only one HIV DNA molecule. Proc. Natl. Acad. Sci. U. S. A. 108:11199–11204. 10.1073/pnas.1107729108 [DOI] [PMC free article] [PubMed] [Google Scholar]
- 16.Koelsch KK, Liu L, Haubrich R, May S, Havlir D, Gunthard HF, Ignacio CC, Campos-Soto P, Little SJ, Shafer R, Robbins GK, D'Aquila RT, Kawano Y, Young K, Dao P, Spina CA, Richman DD, Wong JK. 2008. Dynamics of total, linear nonintegrated, and integrated HIV-1 DNA in vivo and in vitro. J. Infect. Dis. 197:411–419. 10.1086/525283 [DOI] [PubMed] [Google Scholar]
- 17.Perelson AS, Essunger P, Cao Y, Vesanen M, Hurley A, Saksela K, Markowitz M, Ho DD. 1997. Decay characteristics of HIV-1-infected compartments during combination therapy. Nature 387:188–191. 10.1038/387188a0 [DOI] [PubMed] [Google Scholar]
- 18.Sharkey ME, Teo I, Greenough T, Sharova N, Luzuriaga K, Sullivan JL, Bucy RP, Kostrikis LG, Haase A, Veryard C, Davaro RE, Cheeseman SH, Daly JS, Bova C, Ellison RT, III, Mady B, Lai KK, Moyle G, Nelson M, Gazzard B, Shaunak S, Stevenson M. 2000. Persistence of episomal HIV-1 infection intermediates in patients on highly active anti-retroviral therapy. Nat. Med. 6:76–81. 10.1038/71569 [DOI] [PMC free article] [PubMed] [Google Scholar]
- 19.Zaunders JJ, Cunningham PH, Kelleher AD, Kaufmann GR, Jaramillo AB, Wright R, Smith D, Grey P, Vizzard J, Carr A, Cooper DA. 1999. Potent antiretroviral therapy of primary human immunodeficiency virus type 1 (HIV-1) infection: partial normalization of T lymphocyte subsets and limited reduction of HIV-1 DNA despite clearance of plasma viremia. J. Infect. Dis. 180:320–329. 10.1086/314880 [DOI] [PubMed] [Google Scholar]
- 20.Ho DD, Neumann AU, Perelson AS, Chen W, Leonard JM, Markowitz M. 1995. Rapid turnover of plasma virions and CD4 lymphocytes in HIV-1 infection. Nature 373:123–126. 10.1038/373123a0 [DOI] [PubMed] [Google Scholar]
- 21.Wei X, Ghosh SK, Taylor ME, Johnson VA, Emini EA, Deutsch P, Lifson JD, Bonhoeffer S, Nowak MA, Hahn BH. 1995. Viral dynamics in human immunodeficiency virus type 1 infection. Nature 373:117–122. 10.1038/373117a0 [DOI] [PubMed] [Google Scholar]
- 22.Meditz AL, Haas MK, Folkvord JM, Melander K, Young R, McCarter M, MaWhinney S, Campbell TB, Lie Y, Coakley E, Levy DN, Connick E. 2011. HLA-DR+ CD38+ CD4+ T lymphocytes have elevated CCR5 expression and produce the majority of R5-tropic HIV-1 RNA in vivo. J. Virol. 85:10189–10200. 10.1128/JVI.02529-10 [DOI] [PMC free article] [PubMed] [Google Scholar]
- 23.Pierson TC, Zhou Y, Kieffer TL, Ruff CT, Buck C, Siliciano RF. 2002. Molecular characterization of preintegration latency in human immunodeficiency virus type 1 infection. J. Virol. 76:8518–8531. 10.1128/JVI.76.17.8518-8513.2002 [DOI] [PMC free article] [PubMed] [Google Scholar]
- 24.Zhou Y, Zhang H, Siliciano JD, Siliciano RF. 2005. Kinetics of human immunodeficiency virus type 1 decay following entry into resting CD4+ T cells. J. Virol. 79:2199–2210. 10.1128/JVI.79.4.2199-2210.2005 [DOI] [PMC free article] [PubMed] [Google Scholar]
- 25.Mansharamani M, Graham DRM, Monie D, Lee KK, Hildreth JEK, Siliciano RF, Wilson KL. 2003. Barrier-to-autointegration factor BAF binds p55 Gag and matrix and is a host component of human immunodeficiency virus type 1 virions. J. Virol. 77:13084–13092. 10.1128/JVI.77.24.13084-13092.2003 [DOI] [PMC free article] [PubMed] [Google Scholar]
- 26.Oswald-Richter K, Grill SM, Leelawong M, Unutmaz D. 2004. HIV infection of primary human T cells is determined by tunable thresholds of T cell activation. Eur. J. Immunol. 34:1705–1714. 10.1002/eji.200424892 [DOI] [PubMed] [Google Scholar]
- 27.Agosto LM, Yu JJ, Dai J, Kaletsky R, Monie D, O'Doherty U. 2007. HIV-1 integrates into resting CD4+ T cells even at low inoculums as demonstrated with an improved assay for HIV-1 integration. Virology 368:60–72. 10.1016/j.virol.2007.06.001 [DOI] [PMC free article] [PubMed] [Google Scholar]
- 28.Pace MJ, Graf EH, Agosto LM, Mexas AM, Male F, Brady T, Bushman FD, O'Doherty U. 2012. Directly infected resting CD4+ T cells can produce HIV Gag without spreading infection in a model of HIV latency. PLoS Pathog. 8:e1002818. 10.1371/journal.ppat.1002818 [DOI] [PMC free article] [PubMed] [Google Scholar]
- 29.Chun TW, Nickle DC, Justement JS, Large D, Semerjian A, Curlin ME, O'Shea MA, Hallahan CW, Daucher M, Ward DJ, Moir S, Mullins JI, Kovacs C, Fauci AS. 2005. HIV-infected individuals receiving effective antiviral therapy for extended periods of time continually replenish their viral reservoir. J. Clin. Invest. 115:3250–3255. 10.1172/JCI26197 [DOI] [PMC free article] [PubMed] [Google Scholar]
- 30.Levy Y, Sereti I, Tambussi G, Routy JP, Lelievre JD, Delfraissy JF, Molina JM, Fischl M, Goujard C, Rodriguez B, Rouzioux C, Avettand-Fenoel V, Croughs T, Beq S, Morre M, Poulin JF, Sekaly RP, Thiebaut R, Lederman MM. 2012. Effects of recombinant human interleukin 7 on T-cell recovery and thymic output in HIV-infected patients receiving antiretroviral therapy: results of a phase I/IIa randomized, placebo-controlled, multicenter study. Clin. Infect. Dis. 55:291–300. 10.1093/cid/cis383 [DOI] [PMC free article] [PubMed] [Google Scholar]
- 31.Eriksson S, Graf EH, Dahl V, Strain MC, Yukl SA, Lysenko ES, Bosch RJ, Lai J, Chioma S, Emad F, Abdel-Mohsen M, Hoh R, Hecht F, Hunt P, Somsouk M, Wong J, Johnston R, Siliciano RF, Richman DD, O'Doherty U, Palmer S, Deeks SG, Siliciano JD. 2013. Comparative analysis of measures of viral reservoirs in HIV-1 eradication studies. PLoS Pathog. 9:e1003174. 10.1371/journal.ppat.1003174 [DOI] [PMC free article] [PubMed] [Google Scholar]
- 32.Ho Y-C, Shan L, Hosmane NH, Wang J, Laskey SB, Rosenbloom DIS, Lai J, Blankson JN, Siliciano JD, Siliciano RF. 2013. Replication-competent noninduced proviruses in the latent reservoir increase barrier to HIV-1 cure. Cell 155:540–551. 10.1016/j.cell.2013.09.020 [DOI] [PMC free article] [PubMed] [Google Scholar]
- 33.Mexas AM, Graf EH, Pace MJ, Yu JJ, Papasavvas E, Azzoni L, Busch MP, Di Mascio M, Foulkes AS, Migueles SA, Montaner LJ, O'Doherty U. 2012. Concurrent measures of total and integrated HIV DNA monitor reservoirs and ongoing replication in eradication trials. AIDS 26:2295–2306. 10.1097/QAD.0b013e32835a5c2f [DOI] [PMC free article] [PubMed] [Google Scholar]
- 34.Palmer S, Maldarelli F, Wiegand A, Bernstein B, Hanna GJ, Brun SC, Kempf DJ, Mellors JW, Coffin JM, King MS. 2008. Low-level viremia persists for at least 7 years in patients on suppressive antiretroviral therapy. Proc. Natl. Acad. Sci. U. S. A. 105:3879–3884. 10.1073/pnas.0800050105 [DOI] [PMC free article] [PubMed] [Google Scholar]
- 35.Murray JM, Emery S, Kelleher AD, Law M, Chen J, Hazuda DJ, Nguyen BY, Teppler H, Cooper DA. 2007. Antiretroviral therapy with the integrase inhibitor raltegravir alters decay kinetics of HIV, significantly reducing the second phase. AIDS 21:2315–2321 [DOI] [PubMed] [Google Scholar]
- 36.Pace MJ, Graf EH, O'Doherty U. 2013. HIV 2-long terminal repeat circular DNA is stable in primary CD4+ T cells. Virology 441:18–21. 10.1016/j.virol.2013.02.028 [DOI] [PMC free article] [PubMed] [Google Scholar]
- 37.Pierson TC, Kieffer TL, Ruff CT, Buck C, Gange SJ, Siliciano RF. 2002. Intrinsic stability of episomal circles formed during human immunodeficiency virus type 1 replication. J. Virol. 76:4138–4144. 10.1128/JVI.76.8.4138-4144.2002 [DOI] [PMC free article] [PubMed] [Google Scholar]
- 38.Sharkey M, Triques K, Kuritzkes DR, Stevenson M. 2005. In vivo evidence for instability of episomal human immunodeficiency virus type 1 cDNA. J. Virol. 79:5203–5210. 10.1128/JVI.79.8.5203-5210.2005 [DOI] [PMC free article] [PubMed] [Google Scholar]
- 39.Ribeiro RM, Mohri H, Ho DD, Perelson AS. 2002. In vivo dynamics of T cell activation, proliferation, and death in HIV-1 infection: why are CD4+ but not CD8+ T cells depleted? Proc. Natl. Acad. Sci. U. S. A. 99:15572–15577. 10.1073/pnas.242358099 [DOI] [PMC free article] [PubMed] [Google Scholar]
- 40.Hazuda DJ, Felock P, Witmer M, Wolfe A, Stillmock K, Grobler JA, Espeseth A, Gabryelski L, Schleif W, Blau C, Miller MD. 2000. Inhibitors of strand transfer that prevent integration and inhibit HIV-1 replication in cells. Science 287:646–650. 10.1126/science.287.5453.646 [DOI] [PubMed] [Google Scholar]
- 41.Buzon M, Massanella M, Llibre JM, Esteve A, Dahl V, Puertas MC, Gatell JM, Domingo P, Paredes R, Sharkey M, Palmer S, Stevenson M, Clotet B, Blanco J, Martinez-Picado J. 2010. HIV-1 replication and immune dynamics are affected by raltegravir intensification of HAART-suppressed subjects. Nat. Med. 16:460–465. 10.1038/nm.2111 [DOI] [PubMed] [Google Scholar]
- 42.Butler SL, Hansen MS, Bushman FD. 2001. A quantitative assay for HIV DNA integration in vivo. Nat. Med. 7:631–634. 10.1038/87979 [DOI] [PubMed] [Google Scholar]
- 43.Archin NM, Cheema M, Parker D, Wiegand A, Bosch RJ, Coffin JM, Eron J, Cohen M, Margolis DM. 2010. Antiretroviral intensification and valproic acid lack sustained effect on residual HIV-1 viremia or resting CD4+ cell infection. PLoS One 5:e9390. 10.1371/journal.pone.0009390 [DOI] [PMC free article] [PubMed] [Google Scholar]
- 44.Blazkova J, Chun TW, Belay BW, Murray D, Justement JS, Funk EK, Nelson A, Hallahan CW, Moir S, Wender PA, Fauci AS. 2012. Effect of histone deacetylase inhibitors on HIV production in latently infected, resting CD4+ T cells from infected individuals receiving effective antiretroviral therapy. J. Infect. Dis. 206:765–769. 10.1093/infdis/jis412 [DOI] [PMC free article] [PubMed] [Google Scholar]