

Abstract
Neurite outgrowth is an essential process during neuronal differentiation as well as neuroregeneration. Thus, understanding the molecular and cellular control of neurite outgrowth will benefit patients with neurological diseases. We have previously shown that overexpression of the signaling adaptor protein SH2B1β promotes fibroblast growth factor 1 (FGF1)-induced neurite outgrowth (W. F. Lin, C. J. Chen, Y. J. Chang, S. L. Chen, I. M. Chiu, and L. Chen, Cell. Signal. 21:1060–1072, 2009). SH2B1β also undergoes nucleocytoplasmic shuttling and regulates a subset of neurotrophin-induced genes. Although these findings suggest that SH2B1β regulates gene expression, the nuclear role of SH2B1β was not known. In this study, we show that SH2B1β interacts with the transcription factor, signal transducer, and activator of transcription 3 (STAT3) in neuronal PC12 cells, cortical neurons, and COS7 fibroblasts. By affecting the subcellular distribution of STAT3, SH2B1β increased serine phosphorylation and the concomitant transcriptional activity of STAT3. As a result, overexpressing SH2B1β enhanced FGF1-induced expression of STAT3 target genes Egr1 and Cdh2. Chromatin immunoprecipitation assays further reveal that, in response to FGF1, overexpression of SH2B1β promotes the in vivo occupancy of STAT3-Sp1 heterodimers at the promoter of Egr1 and Cdh2. These findings establish a central role of SH2B1β in orchestrating signaling events to transcriptional activation through interacting and regulating STAT3-containing complexes during neuronal differentiation.
INTRODUCTION
During neuronal development, neurotrophins, which include nerve growth factor (NGF) (1), brain-derived neurotrophic factor (BDNF), and fibroblast growth factors (FGFs), influence the differentiation and survival of neurons (2–4). In the nervous system, the neurotrophic properties of FGFs are important in maintaining neuronal populations and stimulate regeneration after neuronal injury (5, 6). FGFs induce the FGF receptor (FGFR) substrate 2 (FRS2), Ras–mitogen-activated protein kinase (MAPK) pathway, phosphatidylinositol 3-kinase (PI3K)–AKT pathway, and phospholipase C γ (PLCγ) pathways, which lead to various cellular responses (7). FGF1, originally isolated from bovine brain and hypothalamus (8), binds to FGFR1 to FGFR4, and its binding to FGFR1 induces neuronal differentiation via MAPK activation in PC12 cells, a well-established neuronal cell line (9, 10).
Adaptor proteins in a signaling pathway act to convey extracellular signals to downstream signaling molecules. They often contain several protein-protein interaction domains that are responsible for recruiting signaling components (11). Several lines of study have revealed their unexpected roles in regulating transcriptional complexes. β-Arrestin 2, for instance, is an adaptor/scaffold protein that plays a role in G protein-coupled receptor signaling pathways. It binds to inhibitor of κBα (IκBα) and nuclear factor κB (NF-κB), prevents degradation of IκBα, leads to accumulation of NF-κB in the cytoplasm, and inhibits the expression of NF-κB target genes during an immune response (12, 13). Along the same lines, in response to δ-opioid receptor activation, β-arrestin 1 shuttles between the cytoplasm and nucleus, interacts with cyclic AMP (cAMP) response element-binding protein, and as a result recruits p300 to regulate acetylation of downstream gene promoters and gene expression of p27 and c-fos (14). Signal transducing adaptor protein 2 (STAP-2) is another case in which an adaptor protein acts together with signal transducers and activators of transcription 3 (STAT3) to regulate STAT3 activation, transcriptional activity, and downstream gene expression to regulate tumor progression (15–17). Thus, the involvement of signaling adaptor proteins in transcriptional regulation has emerged as a new venue to regulate physiological responses.
SH2B1, SH2B2, and SH2B3 are adaptor/scaffold proteins that belong to the SH2B family. SH2B1β (β variant of SH2B1) participates in signaling pathways for several receptor tyrosine kinases (RTKs), such as insulin, NGF (1), glial cell line-derived neurotrophic factor (GDNF), FGF1, and erythropoietin receptors (18–23). We have previously shown that SH2B1β enhances FGF1-induced neurite outgrowth in PC12 cells, mainly through the MAPK kinase (MEK)–extracellular signal-regulated kinase (ERK1/2)-STAT3 pathway and the expression of STAT3 target gene Egr1 (24). SH2B1β also undergoes nucleocytoplasmic shuttling and regulates a subset of NGF-responsive genes, suggestive of its involvement in transcriptional regulation (25, 26). Expressing a mutant form of SH2B1β that contains a defective nuclear localization signal (NLS) inhibits NGF-induced neurite outgrowth in PC12 cells, implicating the importance of its nuclear function during neuronal differentiation (27).
SH2B1β does not contain a DNA binding domain. We think that SH2B1β may interact with STAT3 to affect the expression of genes required for differentiation. STAT3 is phosphorylated and activated by tyrosine kinases, including Janus protein tyrosine kinases (JAKs). Tyrosine-phosphorylated STAT3 has been implicated in mediating STAT3 dimerization and translocation to the nucleus to regulate gene expression (28, 29). In addition, serine phosphorylation of STAT3 is required for its maximal transcriptional activity (30, 31). Although tyrosine phosphorylation of STAT3 is thought to be required for serine phosphorylation, accumulating evidence suggests that serine-phosphorylated STAT3 regulates transcriptional activity independently of tyrosine phosphorylation (24, 32–34). Acetylation of STAT3 also has an essential role in dimerization and transcriptional activation independent of phosphorylation (35–38). Several studies have demonstrated that STAT3 regulates the formation of dendritic spines (39), neuronal differentiation (40), cell aggregation (41), and migration (42) by regulating the expression of Cdh2, which encodes N-cadherin. Cdh2 is a direct target of STAT3 in response to oncostatin M (43), and expression of N-cadherin is required for neuronal differentiation (44, 45). In this study, we examine whether SH2B1β binds to STAT3 and whether it affects the transcriptional activity of STAT3 and expression of EGR1 and N-cadherin during neuronal differentiation.
MATERIALS AND METHODS
Reagents.
Anti-pSTAT3(S727) and anti-pSTAT3(Y705) were purchased from Bioworld (Minneapolis, MN). Anti-N-cadherin was purchased from ECM Biosciences (Versailles, KY). Anti-ERK1/2, anti-glyceraldehyde-3-phosphate dehydrogenase (anti-GAPDH) antibodies, mithramycin A, and bovine serum albumin (BSA) were purchased from Sigma (St. Louis, MO). Anti-STAT3, anti-STAT1, and anti-poly(ADP-ribose) polymerase antibodies were purchased from Cell Signaling (Danvers, MA). Anti-Sp1, antiphosphotyrosine, and anti-histone deacetylase (anti-HDAC) antibodies were obtained from Millipore (Billerica, MA). Anti-GAP-43, anti-green fluorescent protein (GFP) antibodies, and rabbit IgG were purchased from GeneTex (Irvine, CA). Anti-EGR1, anti-lamin B, anti-α-tubulin, anti-FGFR1 antibodies, and STA-21 were purchased from Santa Cruz Biotechnology (Santa Cruz, CA). Anti-FRS2 was purchased from Abcam (Cambridge, United Kingdom). Polyclonal anti-SH2B1 antibody was raised against a glutathione S-transferase fusion protein containing residues 527 to 670 of SH2B1β as described previously (22) and was a generous gift from Christin Carter-Su from the University of Michigan. Anti-GFP and anti-myc tag antibodies were purchased from Hopegen Biotechnology Development Enterprise (Taipei, Taiwan, Republic of China). IRDye800W-labeled anti-rabbit secondary antibody was purchased from LI-COR Biosciences (Lincoln, NE). Anti-TfR and anti-STAT5b antibodies, Alexa Fluor 700-conjugated secondary antibody, and all media and sera used in this study were from Invitrogen (Carlsbad, CA). Rat-tail collagen I was purchased from BD Bioscience. Human FGF1 was provided by Ing-Ming Chiu at the National Health Research Institutes in Taiwan.
Plasmids.
The pEGFP-C1 vector and GFP-SH2B1β, myc-SH2B1β, and GFP-SH2B1β(R555E) constructs were generous gifts from Christin Carter-Su. GFP-SH2B1β(1-260), GFP-SH2B1β(270-670), GFP-SH2B1β(397-670), GFP-SH2B1β(ΔNES), and GFP-SH2B1β(ΔNLS) were made as described in Chen and Carter-Su (25), and SH2B3 was made as described in Wang et al. (46). STAT3, STAT3-C-FLAG (47), hemagglutinin (HA)–STAT3-D (48), and STAT3-Y705F (49) were gifts from Ming-Jer Tang at National Cheng Kung University, Taiwan. The lysine mutant STAT3(K685R) was constructed by site-directed mutagenesis. pLucTKS3, the STAT3 binding site luciferase plasmid, was a gift from James Turkson at the University of Central Florida (50). pm674 (STAT binding site luciferase; plasmid 8688; Addgene [51]), STAT3-S727A (plasmid 8708; Addgene [52]), and Sp1 (plasmid 24543; Addgene) constructs were purchased from Addgene Inc. (Cambridge, MA). The Cdh2 promoter luciferase plasmid was a gift from Shen-Liang Chen at National Central University, Taiwan (53). Rat FGFR1 plasmid was a gift from Manabu Negishi at Kyoto University, Japan (54).
Cell culture.
PC12 cells were obtained from the American Type Culture Collection. PC12 cells stably overexpressing GFP, GFP-SH2B1β, or GFP-SH2B1β(R555E) were made as described in Wang et al. (55), and stably overexpressing GFP-SH2B1β(ΔNES) and GFP-SH2B1β(ΔNLS) were made as described in Wu et al. (56). PC12 cells were seeded on collagen-coated plates (coated with 0.1 mg/ml rat-tail collagen in 0.02 N acetic acid) and maintained in Dulbecco's modified Eagle medium (DMEM) containing 10% horse serum (HS), 5% fetal bovine serum (FBS), 1% l-glutamine (l-Gln), 1% antibiotic-antimycotic (AA) under conditions of 37°C and 10% CO2. COS7 cells and 293T cells were obtained from the American Type Culture Collection, and PC-3 cells were gifts from Hong-Lin Chan at National Tsing Hua University, Taiwan. COS7 cells, 293T cells, and PC-3 cells were maintained in DMEM containing 10% FBS, 1% l-Gln, and 1% AA and cultured at 37°C under 5% CO2 conditions.
Primary culture of cortical neurons.
The preparation of primary cortical neurons was as described previously (46). Briefly, cells were dissociated from the brain cortex of embryonic day 18 (E18) embryos of Sprague-Dawley rats (BioLASCO Taiwan Co., Ltd.) by treatment with papain (10 U/ml). Dissociated cells were washed and suspended in minimal essential medium (MEM) supplemented with 5% HS and 5% FBS. Neurons were then plated at a density of 8 × 10⁶ cells/dish in dishes coated with 30 mg/ml of poly-l-lysine and cultured in neurobasal medium with B27 (containing an additional 0.025 mM glutamate). This corresponded to day in vitro (DIV) 1. On DIV 3, cells were treated with 5 μM cytosine 1-β-d-arabinofuranoside (ARC) to inhibit the growth of glial cells. Half of the medium was replaced with fresh neurobasal/B27 medium on DIV 4 and then every 2 days. On DIV 7, cell lysates of the cortical neurons were extracted.
Immunoblotting and immunoprecipitation.
Cells were lysed by radioimmunoprecipitation assay (RIPA) buffer (50 mM Tris, pH 7.5, 1% Triton X-100, 150 mM NaCl, 2 mM EGTA) containing 1 mM Na3VO4, 1 mM phenylmethylsulfonyl fluoride (PMSF), 10 ng/ml aprotinin, and 10 ng/ml leupeptin. The protein concentration of each sample was determined by bicinchoninic acid (BCA) assay. An equal amount of each protein sample was separated by sodium dodecyl sulfate-polyacrylamide gel electrophoresis (SDS-PAGE), followed by immunoblotting with the indicated antibodies. The immunoblots were subsequently detected using IRDye-conjugated IgG and the Odyssey infrared imaging system (LI-COR Biosciences). For immunoprecipitation, cell lysates were prepared in RIPA buffer and incubated with the indicated antibody and then mixed with protein A-Sepharose or protein G-agarose beads. Thereafter, beads were collected, washed three times, and resuspended in 2× SDS sample buffer. Immunoprecipitated proteins were resolved by SDS-PAGE.
Fractionation.
Cells were collected in fractionation buffer (10 mM Tris-HCl, pH 7.9, 10 mM KCl, 0.1 mM EDTA, 0.1 mM EGTA, 1 mM dithiothreitol [DTT]) containing 1 mM Na3VO4, 1 mM PMSF, 10 ng/ml aprotinin, and 10 ng/ml leupeptin. Cell lysates were passed through a 27-gauge needle 50 times using a 1-ml syringe and then centrifuged at 2,300 rpm (500 × g) at 4°C for 5 min. After centrifugation, the supernatant is the cytoplasmic fraction and the pellet is the nuclear fraction (nuclei and nucleus-associated structures), and they were washed twice by adding fractionation buffer containing 0.5% NP-40, centrifuged again at 13,000 rpm (16,000 × g) at 4°C for 5 min, and resuspended in RIPA buffer containing 0.1% SDS.
Duolink in situ PLA.
The Duolink in situ proximity ligation assay (PLA) kit was purchased from Olink Bioscience (Uppsala, Sweden) and performed according to the manufacturer's instructions. Briefly, cells were seeded on Matrigel-coated coverslips, incubated in serum-free medium overnight, and then treated with 100 ng/ml FGF1 and 10 μg/ml heparin for the time indicated. Cells were fixed by 4% paraformaldehyde (Electron Microscopy Sciences) on ice for 10 min, permeabilized by 100% methanol at −20°C for 10 min, and then incubated in blocking buffer containing 1% bovine serum albumin. Cells were incubated with mouse anti-STAT3 antibody along with rabbit anti-GFP or anti-Sp1 antibody at 4°C overnight, followed by incubation with Duolink PLA rabbit plus and PLA mouse minus probes. After incubation, ligation and amplification were followed by using Duolink detection reagent red. Nucleus was stained with 4′,6-diamidino-2-phenylindole (DAPI), and cells were mounted using Prolong Gold reagent (Invitrogen). Fluorescence signals were detected by an LSM 780 confocal fluorescence microscope (Zeiss) with a 63× oil objective, and we performed a z-stack series. Images were analyzed by ZEN 2011 software (Zeiss) to perform maximum intensity projection, and PLA signal spots were counted by BlobFinder (Centre for Image Analysis, Uppsala University, Uppsala, Sweden).
Luciferase assay.
To analyze STAT3 transcriptional activity, PC12-GFP and PC12-SH2B1β cells were transiently transfected with STAT3 promoter sequences fused to firefly luciferase (pLucTKS3 or pm674) along with a cytomegalovirus-Renilla-Luc plasmid as an internal control for 6 h. The cells were subsequently cultured in complete medium for another 18 h. Cells then were harvested, and firefly and Renilla luciferase activities were determined using a dual-luciferase reporter assay system (Promega) and measured with a VICTOR3 multilabel plate reader (PerkinElmer). The firefly luciferase activity was normalized to the Renilla luciferase activity.
For Cdh2 promoter activity, PC-3 cells were transiently transfected with a Cdh2 promoter plasmid containing firefly luciferase along with the pEGFP-C1 plasmid as an internal control for 6 h. The cells were cultured in complete medium for another 18 h. Firefly luciferase activities were determined using a luciferase assay system (Promega), and GFP fluorescence was measured with the VICTOR3 multilabel plate reader. The firefly luciferase activity was normalized to the GFP fluorescence.
FGF1 treatment and neurite outgrowth.
For FGF1-induced neurite outgrowth, PC12 cells were subcultured to 20 to 30% confluence in low-serum differentiation medium (DMEM containing 2% HS, 1% FBS, 1% AA, and 1% l-Gln). FGF1 needs heparin to elicit its physiological action (57, 58); thus, heparin was added together with FGF1 during all FGF1 treatments in this study. To inhibit STAT3 activity, PC12-SH2B1β cells were pretreated with STA-21 20 μM for 1 h before the addition of 100 ng/ml FGF1 and 10 μg/ml heparin in differentiation medium for 4 days. Medium containing FGF1 and STA-21 was changed every 2 days. Live-cell images were taken using an inverted Zeiss Observer Z1 microscope. The average neurite length of PC12-SH2B1β cells on day 4 was determined with ImageJ software. For the STAT3 knockdown stable cell lines (see below), cells were treated with 100 ng/ml FGF1 and 10 μg/ml heparin in differentiation medium for 6 days. Cells were considered differentiated if their neurite lengths were at least twice the diameter of their cell bodies.
Knockdown of STAT3.
Three pLKO.1-shSTAT3 plasmids (TRCN0000020842 and TRCN0000071456) were obtained from the National Core Facility at the Institute of Molecular Biology, Genomic Research Center, Academic Sinica, Taiwan. To knock down STAT3 in PC12-SH2B1β cells, cells were transfected with pLKO.1-shSTAT3 plasmid or pLKO.1-shLacZ control plasmid and selected by treatment with puromycin for at least 2 months. Pooled populations of stable clones were used to avoid clonal variation.
Molecular docking.
To perform molecular docking of SH2B1β and STAT3, the crystal structure of full-length STAT3 (PDB code 1BG1, chain A [59]) and the SH2 domain of SH2B1β (PDB code 2HDX, chain A [60]) was applied. Based on results from the protein immunoprecipitation experiments, we focused on the SH2 domains of SH2B1β and STAT3 as likely regions for this interaction. The complex model of SH2 and STAT3 was generated by ClusPro v2.0, a protein-protein docking server (61–64). The five highest-scoring models, which were ranked based on their interaction free energies, were used to calculate the interface area with PDBePISA (65). The structural mutagenesis and the model representations were generated by PyMOL (DeLano Scientific) and UCSF Chimera (66).
ChIP assay.
The chromatin immunoprecipitation (ChIP) assays were performed by following the methods described by Schoppee Bortz and Wamhoff (67), with modifications. In brief, PC12-GFP and PC12-SH2B1β cells were incubated in serum-free medium overnight before being treated with 100 ng/ml FGF1 for the indicated time periods. Cells were cross-linked with 1% formaldehyde for 10 min at room temperature and terminated with 125 mM glycine for 5 min at room temperature, and cells were harvested and sonicated to an average length of 0.5 to 1 kb by using 45 bursts of 30 s on and 30 s off on a Bioruptor sonicator (Diagenode). The sheared chromatin was immunoprecipitated with 1 μg anti-IgG or anti-STAT3 antibody. The cross-linking then was reversed with 0.2 M NaCl and RNase A at 37°C for 30 min, followed by adding proteinase K at 37°C overnight and heating at 65°C overnight. DNA fragments were purified by phenol-chloroform and precipitated by 100% ethanol. The immunoprecipitated DNA was quantified by semiquantitative real-time PCR (qPCR) using SYBR green master mix and an ABI Prism 7500 real-time PCR system (Applied Biosystems). The forward primer for flanking the Sp1-binding site at the promoter region of Cdh2 at bp −738/−732 is 5′-CAGCTCTCCCCCCACCACAC-3′, and the reverse primer is 5′-CCGCAGCCGGAGAACAGT-3′. The forward primer for flanking the bp −273/−263 region of the Cdh2 promoter is 5′-CACGCCCGCCCTTCTC-3′, and the reverse primer is 5′-CAGCTCCTTGATCTCCCGTC-3′. The forward primer for flanking the bp −139/−132 region of the Cdh2 promoter is 5′-GAGCAGCGGAGAAGGGGGT-3′, and the reverse primer is 5′-TGCCCGGAGCCGTCTC-3′. The STAT3-binding site at the promoter region of Egr1 is at bp −1552/−1545, TTCCTGGA (68, 69), and the Sp1 binding site is at the GC box at bp −77/−59 (70). The specific forward primer designed for flanking the STAT3-binding site is 5′-GTTGGAAACAAGAGCCTTCC-3′, and the reverse primer is 5′-AGCAACCCAAAGGGAGAAG-3′. The forward primer for flanking the Sp1-binding site is 5′-CATGTACGTCACGGCGGA-3′, and the reverse primer is 5′-TCGGCCTCTATTTCAAGGGTC-3′. qPCR data for occupancy of the promoters was calculated by the following equation: ΔCT(normalized ChIP) = CT(ChIP) − [CT (input) − log2(input dilution factor)], where CT is the threshold cycle. The input dilution factor is 1 divided by the fraction of the input chromatin saved. The percentage of input was calculated as 2−ΔCT(normalized ChIP).
Statistical analysis.
The statistical analysis of immunoblotting results, luciferase activity, average neurite length, differentiation percentage, and qPCR of ChIP assay was performed using the paired Student t test. Significance is defined as P < 0.05.
RESULTS
Interaction between SH2B1β and STAT3.
SH2B1 contains a dimerization domain, three proline-rich domains, a pleckstrin homology (PH) domain, and an Src homology (SH2) domain near its C terminus (Fig. 1A). Alternative splicing of SH2B1 results in four isoforms, α, β, γ, and δ (71). Based on our previous report, overexpression of SH2B1β promotes FGF1-induced serine 727 phosphorylation of STAT3 [pSTAT3(S727)] and expression of the STAT3 target gene Egr1 during neuronal differentiation (24). We set out to determine whether SH2B1β binds to STAT3, and if it does, which domain(s) is responsible for the interaction. COS7 cells were transiently transfected with GFP, GFP-SH2B1β, GFP-SH2B1β(R555E), GFP-SH2B1β(1-260), GFP-SH2B1β(270-670), or GFP-SH2B1β(397-670). SH2B1β and its mutants were immunoprecipitated using anti-GFP antibody, and the presence of STAT3 was determined by Western blotting. SH2B1β, SH2B1β(270-670), and SH2B1β(397-670) were able to interact with STAT3 (Fig. 1B, left). In contrast, SH2B1β(R555E) and SH2B1β(1-260) did not bind to STAT3. SH2B1β(R555E) has a point mutation in the FLVR motif within the SH2 domain, and SH2B1β(1-260) contains the N-terminal region without PH and SH2 domains. This result suggests that the SH2 domain of SH2B1β is required for interacting with STAT3. In contrast, SH2B1β does not interact with other STAT family members, such as STAT1 and STAT5b (Fig. 1B, far right).
FIG 1.

SH2B1β interacts with STAT3. (A) Domains of SH2B1β and SH2B1β deletion mutants. SH2B1β contains three proline-rich domains (P), a dimerization domain (DD), a nuclear localization signal (NLS), a nuclear export sequence (NES), a PH domain, and an SH2 domain. SH2B1β(R555E) is a dominant-negative mutant with a point mutation of arginine to glutamic acid at residue 555. (B) COS7 cells were transiently transfected with GFP, GFP-SH2B1β(1-670), GFP-SH2B1β(R555E), GFP-SH2B1β(1-260), GFP-SH2B1β(270-670), and GFP-SH2B1β(390-670) (left). Cell lysates were immunoprecipitated using anti-GFP antibody and resolved via SDS-PAGE followed by immunoblotting with anti-GFP and anti-STAT3 antibodies. Arrowheads indicate the overexpressed proteins. Cell lysates from COS7 cells expressing myc-SH2B1β were immunoprecipitated using anti-IgG or anti-myc antibody and resolved with SDS-PAGE, followed by immunoblotting using antibodies against STAT3, STAT1, STAT5b, and SH2B1. (C) COS7 cells were transiently cotransfected with vector only or myc-SH2B1β along with plasmid containing STAT3- or STAT-binding sequences fused to firefly luciferase (pLucTKS3 or pm674) and pEGFP. Cells were harvested, and the firefly luciferase activity was measured and normalized to pEGFP levels. Values are the means ± standard errors of the means (SEM) from three independent experiments. (D) COS7 cells were transiently transfected with GFP-SH2B1β(ΔNES) or GFP-SH2B1β(ΔNLS). Cell lysates were fractionated and immunoblotted with anti-STAT3 and anti-SH2B1 antibodies. α-Tubulin was used as a marker for the cytoplasmic fraction and lamin B as a marker for the nuclear fraction. Cytoplasmic STAT3 was normalized to cytoplasmic α-tubulin, and nuclear STAT3 was normalized to nuclear lamin B levels. Values are means ± SEM from three independent experiments. (E) COS7 cells were transiently transfected with GFP-SH2B1β, GFP-SH2B1β(ΔNES), or GFP-SH2B1β(ΔNLS) along with pm674 and a Renilla luciferase plasmid. The firefly luciferase activities were normalized to the corresponding Renilla luciferase activities. Values are the means ± SEM from three independent experiments. *, P < 0.05 by paired Student's t test.
We next determined whether SH2B1β regulates STAT3 transcriptional activity. Luciferase reporter constructs that contain seven STAT3-specific binding sites (pLucTKS3) or four STAT-binding sites (pm674), together with a vector control or myc-SH2B1β, were transfected into COS7 cells, and the relative transcriptional activity was determined. Overexpression of SH2B1β was able to increase the luciferase activity approximately 2-fold for both reporter constructs (Fig. 1C). One mechanism by which SH2B1β increases STAT3-mediated transcriptional activity is through affecting the subcellular distribution of STAT3. To this end, COS7 cells were transiently transfected with SH2B1β that lacks a nuclear export sequences (NES) [SH2B1β(ΔNES)] or NLS [SH2B1β(ΔNLS)]. SH2B1β(ΔNES) accumulates in the nucleus, whereas SH2B1β(ΔNLS) is retained in the cytoplasm (25–27). Cell lysates were subjected to fractionation, and the relative amounts of STAT3 were compared. The nuclear STAT3 in cells expressing SH2B1β(ΔNES) was 1.5-fold higher than that in cells expressing SH2B1β(ΔNLS), whereas cytoplasmic STAT3 in cells expressing SH2B1β(ΔNES) was 0.6-fold higher than that in cells expressing SH2B1β(ΔNLS) (Fig. 1D). Overexpression of SH2B1β(ΔNES) or SH2B1β(ΔNLS) in COS7 cells reduced the STAT3-mediated transcriptional activity (Fig. 1E). These results suggest that SH2B1β affects the distribution of STAT3 and that the nucleocytoplasmic shuttling ability of SH2B1β is required to regulate the transcriptional activity of STAT3.
Interaction between SH2B1β and STAT3 depends on STAT3 phosphorylation.
To determine which region or modification of STAT3 is important for the interaction with SH2B1β, we used PC-3 cells, which lack endogenous STAT3 (72), to introduce various STAT3 mutants. STAT3 contains an N-terminal domain (ND), coiled-coil domain (CCD), DNA binding domain (DBD), SH2 domain, and transcription activation domain (TAD). To characterize the domains that are responsible for the interaction with SH2B1β, PC-3 cells were transfected with GFP-SH2B1β together with STAT3, STAT3-C (with A662C and N664C mutations resulting in dimer-forming disulfide bridges) (47), STAT3-D (with a DNA binding domain mutation), STAT3-K685R, in which the acetylation site K685 is mutated, STAT3-Y705F, which contains a point mutation at Y705, or STAT3-S727A, which contains a point mutation at S727 (Fig. 2A). Coimmunoprecipitation experiments were performed, and the presence of SH2B1β in various STAT3-containing complexes was determined. SH2B1β interacted with STAT3 and STAT3-D (Fig. 2B). The association between SH2B1β and STAT3-C, STAT3-Y705F, or STAT3-S727A was significantly inhibited. Because SH2B1β is defective in interacting with STAT3-C, which constitutively forms a dimer, it is possible that SH2B1β binds preferentially to the STAT3 monomer. Consistent with this possibility, STAT3-K685R, which is no longer acetylated and may exist primarily as a monomeric form (35, 37, 38), can still bind to SH2B1β. These data also suggest that SH2B1β recognizes phosphorylated STAT3. Thus, it is possible that SH2B1β binds phosphorylated STAT3 monomer before the formation of STAT3 homodimer.
FIG 2.

Interaction between SH2B1β and STAT3 depends on STAT3 phosphorylation. (A) Domains of STAT3 and STAT3 mutant constructs. (B) PC-3 cells were transiently transfected with GFP-SH2B1β along with STAT3, STAT3-C-FLAG, HA-STAT3-D, STAT3-K685R, STAT3-Y705F, or STAT3-S727A (designated WT, C, D, K685R, Y705F, and S727A). Lysates were immunoprecipitated using anti-IgG or anti-GFP antibody and resolved with SDS-PAGE followed by immunoblotting using antibodies against SH2B1 and STAT3. Representative blots are shown from four independent experiments. Arrowheads indicate the STAT3 protein. An asterisk indicates the nonspecific bands. (C) The overall complex model contains the SH2 domain of SH2B1β (in cyan; PDB code 2HDX) and STAT3β (in magenta; PDB code 1BG1). A higher-magnification view of the boxed region is shown in panels D and E. (D) STAT3 is shown as a magenta ribbon, and the surface electrostatic potential of SH2B1β is also shown. The first (702) and last (716) residues of the phosphotyrosyl tail segment of STAT3 are numbered. N664 and pY705, which are involved in STAT3-SH2B1β complex formation, are shown as sticks (left). The phosphorylated tyrosine of STAT3 provides a negative charge to interact with SH2B1β (middle). The interaction is likely disrupted in the Y705F mutant due to the loss of the negative charge of the phosphate group (right). (E) The residues involved in SH2B1β-STAT3 interaction are shown (left). SH2B1β and STAT3 are shown as cyan and magenta ribbons, respectively. R555 of SH2B1β is surrounded by polar residues Q643, Q644, and N647 at a distance of 4 to 6 Å (middle). The distance is increased to 7 to 8 Å as R555 is mutated to glutamic acid (right). (F) SH2B1β and STAT3 are shown in cyan and magenta ribbons, respectively. The location of K685 of STAT3 is relatively far away from the interacting interface with 16.4 Å relative to E612, the nearest residue of SH2B1β (left). The distance is not affected after the K685 residue was replaced by arginine (right).
To confirm these data, we used structural modeling to examine whether SH2B1β binds preferentially with monomeric STAT3. Because the immunoprecipitation assay showed that SH2B1β interacts with STAT3 through its SH2 domain, the calculation of molecular docking of SH2B1β to STAT3 was accomplished using the available crystal structures of the full-length STAT3 and the SH2 domain of SH2B1β (23, 73). The crystal structure of full-length SH2B1β is not available. Among the SH2B1β-STAT3 complex models developed from the molecular docking calculations, the interacting regions of the five highest-scoring structures were all located in their SH2 domains. The interface area for each of these five complex models was calculated by the PDBePISA server. The largest interface area of the model was 1,585 Å2, and this putative complex is depicted in Fig. 2C. The interface between the two proteins was stabilized through the electrostatic interaction from a polar cavity of the SH2 domain of SH2B1β and a phosphotyrosyl tail segment (residues 702 to 716) of STAT3 (Fig. 2D). Mouse STAT3β contains 722 amino acid residues instead of 770 for STAT3α (no crystal structure available) (74). Thus, there is no S727 in the structural modeling of STAT3β. The phosphorylated Y705 in the phosphotyrosyl tail may interact with residues G615, S616, S617, and D618 of SH2B1β through the phosphate group (within 4-Å distance). The negatively charged phosphate group provides an electrostatic force to interact with surrounded residues of SH2B1β. These interactions might be disrupted in the Y705F mutant due to the loss of negative charge of the phosphate group (Fig. 2D). On the tip of an extended loop (residues 656 to 680) of STAT3, N664 might form a hydrogen bond with N582 of SH2B1β (∼2.9 Å) (Fig. 2E, left). In addition, R555 of SH2B1β is inserted into an α-helix (residues 642 to 647) of STAT3 and is surrounded by polar residues Q643, Q644, and N647 at a distance of 4 to 6 Å. These residues may form hydrogen bonds through side chain rotation to immobilize the complex. The result of the immunoprecipitation assay showed that the SH2B1β(R555E) mutant lost the ability to bind to STAT3 (Fig. 1B). The glutamic acid is negatively charged, which is opposite the charge of arginine, and the side chain is shorter than that of arginine. As R555 was mutated to E, the distances to Q643, Q644, and N647 of STAT3 increased to 7 to 8 Å (Fig. 2E, right). The altered charge and longer distance lower the possibility of interacting with STAT3. In this complex model, K685 of STAT3 resides in a very flexible loop and is relatively far away from the interacting interface with 16.4 Å to E612, the nearest residue of SH2B1β. The distance between R685 of the K685R mutated complex model and E612 of SH2B1β does not change (Fig. 2F), showing that residue 685 of STAT3 has no effect on SH2B1β-STAT3 interaction. Thus, it is not likely that K685 participates in the interaction with SH2B1β.
Interestingly, STAT3 forms homodimers through its SH2 domain, and the dimeric form of STAT3 has been implicated in transcriptional activation (73). A constitutively active form of STAT3 was previously made by replacing A662 and N664 with cysteines to form two pairs of intermolecular disulfide bonds (47). Our immunoprecipitation experiments showed that the A662C/N664C mutant of STAT3 did not bind SH2B1β. In line with this result, the interface area of STAT3 homodimer was 1,294.5 Å2, which is smaller than that of the SH2B1β-STAT3 complex model, 1,585 Å2, indicative of stronger binding between SH2B1β and STAT3. These results raise the possibility that SH2B1β competes for binding with monomeric STAT3. Thus, STAT3 monomer may preferentially bind to SH2B1β and form SH2B1β-STAT3 complex. Together, these results suggest that SH2B1β interacts with phosphorylated STAT3 monomer, transport it to the nucleus, and facilitate STAT3 function in the nucleus.
Functional significance of the interaction between SH2B1β and STAT3.
To determine the functional significance of the SH2B1β and STAT3 interaction, we examined the effect of overexpressing SH2B1β in neuronal PC12 cells. Three stable PC12 cell lines that expressed GFP (PC12-GFP), GFP-SH2B1β (PC12-SH2B1β), and GFP-SH2B1β(R555E) (PC12-R555E) were established (55). The basal level of pSTAT3(S727) was compared between PC12-GFP and PC12-SH2B1β cells. The level of pSTAT3(S727) in PC12-SH2B1β cells was 2.8-fold higher than that in PC12-GFP cells (Fig. 3Ai). At resting state, cytoplasmic pSTAT3(S727) in PC12-SH2B1β cells was 2.2-fold, whereas the nuclear pSTAT3(S727) was 1.7-fold higher than those in PC12-GFP cells (Fig. 3Aii and iii). The relative transcriptional activity was also compared by using luciferase reporter assays. Similarly, the relative transcriptional activity in PC12-SH2B1β cells was 2.9-fold (pLucTK3) and 2.6-fold (pm674) higher than that in PC12-GFP cells (Fig. 3B). To verify the interaction between SH2B1 and STAT3 in neuronal cells, STAT3 was immunoprecipitated from lysates of PC12-SH2B1β cells and cortical neurons derived from embryonic day 18 mouse brains. The presence of SH2B1 in the STAT3-containing complexes was determined. As shown in Fig. 3C, SH2B1 interacted with STAT3 both in PC12-SH2B1β cells and primary cortical neurons. The interaction between SH2B1β and STAT3 was increased 10 min after FGF1 treatment. In response to FGF1 stimulation, SH2B1β also interacted with pSTAT3(S727) (Fig. 3C, middle). To confirm the coimmunoprecipitation results, Duolink in situ PLAs were used to examine the association between SH2B1β and STAT3 in response to FGF1. PC12-SH2B1β cells were left untreated or were treated with FGF1, followed by incubation with anti-GFP (detect GFP-SH2B1β) and anti-STAT3 antibodies and then reaction with in situ PLA probes and reagents. The interactions between SH2B1β and STAT3 were detected by fluorescent punctate signal. In response to FGF1 stimulation, levels of SH2B1β-STAT3 complexes increased (Fig. 3D). Taken together, these data suggest that SH2B1β interacts with STAT3, and the interaction increases in response to FGF1 stimulation. We next examined whether FGF1-induced expression of EGR1 depends on the interaction between SH2B1β and STAT3. To this end, PC12-GFP, PC12-SH2B1β, and PC12-R555E cell lines were subjected to FGF1 stimulation for 2 h, and EGR1 expression was determined. SH2B1β enhanced FGF1-induced EGR1, whereas SH2B1β(R555E) did not (Fig. 3E), which is consistent with its inability to bind STAT3 (Fig. 1B, left). In line with these data, PC12-SH2B1β cells had higher levels of induced pSTAT3(S727), whereas PC12-GFP and PC12-R555E cells had similar levels of induced pSTAT3(S727) (Fig. 3E). To examine whether the enhancement of FGF1-induced expression of EGR1 and neuronal differentiation depends on the nucleocytoplasmic shuttling ability of SH2B1β, PC12-GFP, PC12-SH2B1β, PC12-SH2B1β(ΔNES), and PC12-SH2B1β(ΔNLS) cell lines were subjected to FGF1 stimulation, and EGR1 expression and neurite outgrowth were determined. Neither SH2B1β(ΔNES) nor SH2B1β(ΔNLS) can enhance FGF1-induced EGR1 expression (Fig. 3F) and neurite outgrowth (Fig. 3G) compared to SH2B1β. Together, these results suggest that SH2B1β interacts with STAT3 in PC12 cells and primary cortical neurons. The interaction between SH2B1β and STAT3 is required for the enhancement of FGF1-induced expression of the STAT3 target gene, Egr1.
FIG 3.

SH2B1β enhances S727 phosphorylation and transcriptional activity of STAT3. (Ai) Cell lysates from PC12 cells that stably expressed GFP or GFP-SH2B1β were collected, and an equal amount of proteins from each was separated by SDS-PAGE and immunoblotted (IB) with anti-pSTAT3(S727) and anti-STAT3 antibodies. α-Tubulin was used as a loading control. Expression of pSTAT3(S727) was normalized to total STAT3 levels. Values are the means ± SEM from five independent experiments. (Aii and iii) Cell lysates from PC12-GFP and PC12-SH2B1β cells were separated by subcellular fractionation. Samples were resolved by SDS-PAGE and immunoblotted with anti-STAT3 and anti-pSTAT3(S727). Transferrin receptor (TfR) was used as a membrane (M) fraction marker, α-tubulin was used as a cytoplasmic (C) fraction marker, and histone deacetylase (HDAC) was used as a nuclear (N) fraction marker. L, total cell lysate. The relative level of a fraction marker was the level of the marker in a fraction divided by the level in total cell lysate. The relative level of the indicated protein was the level of the indicated protein in a fraction times the relative level of a fraction marker. Values are means ± SEM from three independent experiments. (B) PC12-GFP and PC12-SH2B1β cells were transiently transfected with pLucTKS3 or pm674 and a Renilla luciferase plasmid. Cells were harvested 18 h later, and firefly luciferase activities were measured. The firefly luciferase activities were normalized to the corresponding Renilla luciferase activities. Values are the means ± SEM from at least three independent experiments. (C) PC12-SH2B1β cells were incubated in serum-free medium overnight before being left untreated or treated with 100 ng/ml FGF1 plus 10 μg/ml heparin for 10 min. Cell lysates were immunoprecipitated using anti-IgG, anti-STAT3, or anti-pSTAT3(S727) antibody. Immunoprecipitated complexes were resolved with SDS-PAGE followed by immunoblotting using antibodies against STAT3, SH2B1, and pSTAT3(S727). Primary cortical neurons from E18 mice were cultured in vitro for 7 days (DIV 7). Lysates were immunoprecipitated using anti-IgG or anti-STAT3 antibody and immunoblotted with anti-STAT3 and anti-SH2B1 antibodies. (D) PC12-SH2B1β cells were incubated in serum-free medium overnight before being left untreated or treated with 100 ng/ml FGF1 for 10 min. Primary rabbit anti-GFP and mouse anti-STAT3 antibodies were combined with Duolink PLA mouse minus and PLA rabbit plus probes. Cells incubated with Duolink PLA probes only served as a negative control. Images were taken using an LSM 780 confocal fluorescence microscope. The SH2B1β-STAT3 complexes were detected as spots of PLA signal. Nuclear material was stained by DAPI. Scale bar, 5 μm. Representative images are shown from two independent experiments. (E) PC12-GFP, PC12-SH2B1β, and PC12-SH2B1β(R555E) cells were incubated in serum-free medium overnight and then were treated with 100 ng/ml FGF1 for 2 h. Cell lysates were collected, and equal amounts of proteins were separated by SDS-PAGE and immunoblotted with anti-EGR1, anti-pSTAT3(S727), and anti-STAT3 antibodies. The expression levels of EGR1 and pSTAT3(S727) were normalized to total STAT3. Values are the means ± SEM from three independent experiments. (F) PC12-GFP, PC12-SH2B1β, PC12-SH2B1β(ΔNES), and PC12-SH2B1β(ΔNLS) cells were incubated in serum-free medium overnight and then treated with 100 ng/ml FGF1 for 2 h. Cell lysates were collected, and equal amounts of proteins were resolved by SDS-PAGE and immunoblotted with anti-EGR1, anti-pSTAT3(S727), and anti-STAT3 antibodies. Expression of EGR1 was normalized to total STAT3 levels. Values are means ± SEM from three independent experiments. (G) PC12-GFP, PC12-SH2B1β, PC12-SH2B1β(ΔNES), and PC12-SH2B1β(ΔNLS) cells were treated with 100 ng/ml FGF1 for 4 days. The average neurite length on differentiation day 4 was calculated from three independent experiments. *, P < 0.05 by paired Student's t test.
To determine whether SH2B1β-regulated gene expression requires STAT3 activity, PC12-GFP and PC12-SH2B1β cell lines were either mock treated or pretreated with STA-21 followed by FGF1 treatment. STA-21 is known to inhibit nuclear translocation and transcriptional activity of STAT3 (75). The FGF1-induced EGR1 levels in PC12-GFP and PC12-SH2B1β cells were dramatically reduced by treatment with STA-21 inhibitor. This inhibition may in part result from reduced pSTAT3(S727) in response to STA-21 (Fig. 4A) but not the change of pSTAT3(Y705) (data not shown). As a result, STA-21 inhibited FGF1-induced neurite outgrowth, with the average neurite length reduced by 60% in PC12-SH2B1β cells (Fig. 4B and C).
FIG 4.

Inhibiting STAT3 activity reduces SH2B1β-enhanced EGR1 expression and neurite outgrowth. (A) PC12-GFP and PC12-SH2B1β cells were incubated in serum-free medium overnight before being treated with DMSO (−) or with the STAT3 inhibitor STA-21 (20 μM) (+) for 24 h, and then 100 ng/ml FGF1 was added for 2 h. Cell lysates were collected, and equal amounts of proteins were separated by SDS-PAGE and immunoblotted with anti-EGR1, anti-pSTAT3(S727), and anti-STAT3 antibodies. EGR1 expression was normalized to STAT3 levels. Values are the means ± SEM from three independent experiments. (B) PC12-SH2B1β cells were preincubated with DMSO or 20 μM STA-21 for 1 h and then were left untreated or treated with 100 ng/ml FGF1 for 4 days. Live-cell images are shown. Scale bar, 50 μm. (C) The average neurite length of PC12-SH2B1β cells on differentiation day 4 was calculated from three independent experiments. *, P < 0.05 by paired Student's t test.
If STAT3 activity is required for SH2B1β-mediated enhancement of neurite outgrowth, reduction of the endogenous STAT3 should have an impact on neuronal differentiation. STAT3 knockdown cell lines were established to test this hypothesis. PC12-SH2B1β cells were transfected with one of the two short hairpin STAT3 (shSTAT3) constructs (842 and 456) or with a shLacZ control. These two stable cell lines had STAT3 levels that were 20 to 65% of the STAT3 level in the shLacZ control cell line. The level of N-cadherin, encoded by another STAT3 target gene, Cdh2, was also reduced as a result of STAT3 reduction (Fig. 5A). FGF1-induced EGR1 expression was reduced by 40% (Fig. 5B). PC12-SH2B1β cells with reduced STAT3 levels significantly reduced FGF1-induced neurite outgrowth and differentiation (Fig. 5C and D). These results indicate that SH2B1β-mediated enhancement of FGF1-induced neurite outgrowth and gene expression is STAT3 dependent.
FIG 5.

STAT3 is required for SH2B1β-enhanced gene expression during neuronal differentiation. (A) PC12-SH2B1β cell lines that stably expressed shLacZ or one of the shSTAT3 constructs (842 and 456) were established. Cell lysates were collected, and equal amounts of proteins were separated by SDS-PAGE and immunoblotted with anti-STAT3 and anti-N-cadherin antibodies. α-Tubulin was used as a loading control. The arrow points to the N-cadherin band. The level of STAT3 was normalized to α-tubulin. Values are the means ± SEM from four independent experiments. (B) Cells like those described for panel A were incubated in serum-free medium overnight and then treated with 100 ng/ml FGF1 for 2 h. Cell lysates were collected and immunoblotted with anti-STAT3 and anti-EGR1 antibodies. α-Tubulin was used as a loading control. The level of EGR1 was normalized to α-tubulin. Values are the means ± SEM from four independent experiments. (C) Cells like those described for panel A were treated with 100 ng/ml FGF1 for 6 days. Live-cell images are shown. Scale bar, 50 μm. (D) The percentage of differentiated cells was calculated from three independent experiments. *, P < 0.05 by paired Student's t test.
SH2B1β regulates Cdh2 promoter activity through the STAT3-Sp1 complex.
N-cadherin is a Ca2+-dependent cell-cell adhesion molecule that is expressed in the nervous system and regulates neuronal development, cell migration, and differentiation (76–78). During FGF1-induced neuronal differentiation, the level of N-cadherin increased in PC12-SH2B1β cells (Fig. 6A, right) but not in PC12-GFP control cells (Fig. 6A, left). The inhibition of STAT3 activity by STA-21 dramatically reduced the levels of FGF1-induced N-cadherin and growth-associated protein 43 (GAP-43; encoded by another STAT3 target gene) (Fig. 6B). This finding suggests that the SH2B1β-mediated STAT3 transcriptional complex regulates expression of N-cadherin. However, the Cdh2 promoter region does not have a predicted STAT3-specific binding element. Instead, three Sp1-binding sites have previously been implicated in the Cdh2 promoter region (79, 80). Interestingly, STAT3 is able to regulate gene expression through direct interaction with another transcription factor, Sp1 (81, 82). Thus, it is possible that SH2B1β regulates STAT3-dependent Cdh2 promoter activity through the binding of Sp1. To determine whether SH2B1β and STAT3 regulate the promoter activity of Cdh2, luciferase assays using the Cdh2 promoter fused to the luciferase gene were performed. Because of the high endogenous level of STAT3 in PC12 cells, STAT3-null PC-3 cells were chosen for this analysis (72, 83). PC-3 cells were transiently transfected with the Cdh2 promoter construct together with SH2B1β, STAT3, or Sp1. Our results showed that overexpressing SH2B1β alone did not affect Cdh2 promoter activity in PC-3 cells (Fig. 6C, left). In contrast, overexpression of STAT3 or Sp1 enhanced Cdh2 promoter activity in PC-3 cells (Fig. 6C, middle and right). Coexpression of SH2B1β further increased STAT3-enhanced Cdh2 promoter activity (Fig. 6D, left). On the contrary, coexpressing SH2B1β did not affect Sp1-mediated Cdh2 promoter activity (Fig. 6D, middle). Coexpression of STAT3, on the other hand, synergistically increased Sp1-enhanced Cdh2 promoter activity (Fig. 6D, right). Consistent with these results, STAT3 was coimmunoprecipitated with Sp1 (Fig. 6E), but Sp1 was not present in SH2B1β-containing complexes (Fig. 6F). In addition, STAT3 is likely to form a heterodimer with Sp1, because the constitutive dimer form of STAT3 (STAT3-C mutant) did not bind to Sp1 (Fig. 6E). To verify that STAT3 regulates Cdh2 promoter activity through Sp1, PC-3 cells were pretreated with the Sp1 inhibitor MMA, and promoter activity of Cdh2 was determined. Inhibiting Sp1 DNA binding with MMA treatment decreased STAT3-mediated Cdh2 promoter activity (Fig. 6G). These data suggest that SH2B1β and STAT3 mediate Cdh2 promoter activity through the binding of Sp1. Therefore, SH2B1β may promote transcriptional activation of Cdh2 by promoting the binding of STAT3-Sp1 heterodimers to the promoter region of Cdh2.
FIG 6.

SH2B1β regulates Cdh2 promoter activity through STAT3 and Sp1. (A) PC12-GFP and PC12-SH2B1β cells were treated with 100 ng/ml FGF1 for the indicated number of days. Cell lysates were collected, and equal amounts of proteins were separated by SDS-PAGE and immunoblotted with anti-N-cadherin, anti-GAPDH, and anti-α-tubulin antibodies. GAPDH or α-tubulin was used as a loading control. The level of N-cadherin was normalized to GADPH or α-tubulin. Values of PC12-GFP cells are the means ± standard deviations from two independent experiments, and values of PC12-SH2B1β cells are the means ± SEM from three independent experiments. (B) PC12-SH2B1β cells were preincubated with DMSO or STA-21 (20 μM) for 1 h and then were left untreated or treated with 100 ng/ml FGF1 for 4 days. Cell lysates were analyzed by Western blotting using anti-N-cadherin and anti-GAP-43 antibodies. α-Tubulin was used as a loading control. The level of N-cadherin was normalized to α-tubulin. Values are the means ± SEM from three independent experiments. (C) PC-3 cells were transiently transfected with SH2B1β, STAT3, or Sp1 together with Cdh2 promoter sequences fused to firefly luciferase and pEGFP. Cells were harvested 18 h later, and luciferase activities were measured. Firefly luciferase activities were normalized to pEGFP levels. (D) PC-3 cells were transiently cotransfected with SH2B1β ± STAT3 (left), SH2B1β ± Sp1 (middle), or STAT3 ± Sp1 (right), together with the Cdh2 promoter construct and pEGFP. Cells were harvested at 18 h, and luciferase activities were analyzed as described for panel C. (E) PC-3 cells were transiently transfected with Sp1 along with vector control, STAT3, and STAT3-C-FLAG (designated WT and C). Cell lysates were extracted and immunoprecipitated using anti-Sp1 antibody and analyzed by Western blotting using antibodies against Sp1, STAT3, and N-cadherin. (F) PC-3 cells were transiently transfected with GFP or GFP-SH2B1β plasmid. Cell lysates were immunoprecipitated using anti-GFP antibody and analyzed by Western blotting using antibodies against SH2B1 and Sp1. (G) PC-3 cells were left untransfected or were transiently transfected with STAT3 plus Cdh2 reporter constructs and pEGFP. Cells were treated with 0, 1, or 5 μM MMA for 18 h and then were harvested for luciferase activity measurements. Firefly luciferase activities were normalized to pEGFP levels. Values in panels C, D, and G are means ± SEM from three independent experiments. *, P < 0.05 by paired Student's t test.
Overexpression of SH2B1β enhances in vivo occupancy of STAT3-Sp1 heterodimers at the promoter regions of Cdh2 and Egr1.
According to transcriptional factor binding prediction (84), there are three Sp1-binding sites (−139/−132, −273/−263, and −738/−732) at the promoter region of rat Cdh2 (Fig. 7A). To determine in vivo occupancy of STAT3-Sp1 complexes at the promoter region of Cdh2, chromatin immunoprecipitation (ChIP) assays were performed. PC12-GFP and PC12-SH2B1β cells were treated with FGF1 for 2 days, and STAT3-chromatin complexes were immunoprecipitated by anti-STAT3 antibody. The relative occupancy of STAT3-Sp1 complexes was determined via qPCR with specific primers flanking each Sp1-binding site. In response to FGF1, the in vivo occupancy of STAT3-Sp1 heterodimers at the −139/−132 Sp1-binding site within the Cdh2 promoter was increased 1.3-fold in PC12-GFP cells and 3.6-fold in PC12-SH2B1β cells (Fig. 7B, left). This result is in line with our finding that FGF1 treatment increased N-cadherin levels in PC12-SH2B1β cells (Fig. 6A, right) but not so much in PC12-GFP cells (Fig. 6A, left). A similar trend was found for the other two Sp1-binding sites at −273/−263 and −738/−732 (Fig. 7B, middle and right), although the relative occupancy of STAT3-Sp1 heterodimers was much lower. These data suggest that SH2B1β enhances the in vivo occupancy of STAT3-Sp1 heterodimers at the −139/−132 Sp1-binding site of the Cdh2 promoter in response to FGF1 stimulation.
FIG 7.

SH2B1β enhances in vivo STAT3-Sp1 occupancy at the Cdh2 and Egr1 promoter. (A) Diagram of the Cdh2 promoter region containing three Sp1-binding sites. (B) PC12-GFP and PC12-SH2B1β cells were incubated in serum-free medium overnight before 100 ng/ml FGF1 treatment for 2 days. Cells were cross-linked, followed by ChIP analysis using either anti-IgG or anti-STAT3 antibody for immunoprecipitation. The immunoprecipitated DNA was analyzed by qPCR with specific primers flanking three Sp1-binding sites within the Cdh2 promoter. Values are the means ± SEM from four independent experiments. (C) Diagram of the Egr1 promoter region containing the STAT3-binding site or Sp1-binding sites. (D) PC12-GFP and PC12-SH2B1β cells were incubated in serum-free medium overnight before 100 ng/ml FGF1 treatment for 1 h. Cells were cross-linked, followed by ChIP analysis using either anti-IgG or anti-STAT3 antibody for immunoprecipitation. The immunoprecipitated DNA was analyzed by qPCR with specific primers flanking the STAT3-binding site or Sp1-binding site within the Egr1 promoter. Values are the means ± SEM from three independent experiments. *, P < 0.05 by paired Student's t test. (E) PC12-GFP and PC12-SH2B1β cells were incubated in serum-free medium overnight before being left untreated or treated with 100 ng/ml FGF1 for 1 h. Primary mouse anti-STAT3 and rabbit anti-Sp1 antibodies were combined with Duolink PLA mouse minus and PLA rabbit plus probes. Cells incubated with Duolink PLA probes only served as the negative control. Images were taken using an LSM 780 confocal fluorescence microscope. The STAT3-Sp1 heterodimers were detected as spots of PLA signal. Nuclear material was stained by DAPI. Scale bar, 5 μm. (F) Quantification of PLA spots counted by Blobfinder software and calculated from two independent experiments. Values are means ± standard deviations.
At the promoter region of Egr1, there are two Sp1-binding sites and a STAT3-binding site (Fig. 7C). To determine the in vivo occupancy of STAT3 homodimers or STAT3-Sp1 complexes at the promoter region of Egr1, ChIP assays were performed. In response to FGF1, the in vivo occupancy of STAT3 at the STAT3-binding site within the Egr1 promoter was increased 3.2-fold for PC12-GFP cells and 1.3-fold for PC2-SH2B1β cells (Fig. 7D, left). The recruitment of STAT3-Sp1 heterodimers at the Sp1-binding site of the Egr1 promoter was 4.8-fold for PC12-GFP and 6.7-fold for PC12-SH2B1β cells (Fig. 7D, right). These results suggest that overexpression of SH2B1β orchestrates a switch from formation of STAT3 homodimers to STAT3-Sp1 heterodimers to enhance FGF1-induced Egr1 expression.
To visualize the in vivo interaction between STAT3 and Sp1, Duolink in situ PLAs were performed. Similar to the results from ChIP assays, the level of FGF1-induced formation of STAT3-Sp1 heterodimers in PC12-SH2B1β cells was higher than that in PC12-GFP cells (Fig. 7E and F). Different from the ChIP experiments, PLA assays report overall interaction between STAT3 and Sp1 in cells that is not specific to certain promoter regions. The different experimental approaches may explain why we do not see a similar trend of increase in control PC12-GFP cells. Taken together, these results suggest that overexpression of SH2B1β increases the formation of STAT3-Sp1 heterodimers to enhance the expression of FGF1-induced Cdh2 and Egr1.
In this study, we present the first evidence showing that the adaptor protein SH2B1β binds to the transcription factor STAT3 in various cell systems, including embryonic kidney cells (COS7), prostate cancer cells (PC-3 cells), neuronal PC12 cells, and primary neurons. SH2B1β regulates the distribution and transcriptional activation of STAT3 as well as the expression of EGR1 and N-cadherin during FGF1-induced neuronal differentiation. The mechanism by which SH2B1β enhances FGF1-induced EGR1 and N-cadherin expression is by increasing the occupancy of STAT3-Sp1 heterodimers at the promoters of Cdh2 and Egr1.
DISCUSSION
Following the discovery of SH2B1β's nucleocytoplasmic shuttling ability (25), SH2B1 has more recently been shown to regulate a subset of NGF-responsive genes (26). No published report thus far demonstrates its nuclear function. The nucleocytoplasmic shuttling of SH2B1 is required for the enhanced effect, because SH2B1β lacking either NLS or NES cannot enhance FGF1-induced gene expression and neurite outgrowth to the same extent as SH2B1β (Fig. 3F and G). In this study, we present evidence showing that SH2B1β binds to the transcription factor STAT3 to enhance the expression of FGF1-induced EGR1 and N-cadherin during neuronal differentiation. These results also reveal a novel mechanism in which the formation of STAT3-Sp1 heterodimer complexes contributes to FGF1-induced and SH2B1β-regulated gene expression during neuronal differentiation. This study clearly links signal activation to transcriptional regulation by adaptor protein SH2B1β.
SH2B1β, as a signaling adaptor, was recruited to the cell surface and bound to FGF receptor 1 (FGFR1) and FRS2 (Fig. 8A). Interaction between SH2B1β and FGFR1 was increased in response to FGF1. As a result, SH2B1β was tyrosine phosphorylated upon FGF1 stimulation (Fig. 8B). STAT3 can also bind to pFGFR1 (85). Thus, it is likely that FGF1-induced FGFR1 phosphorylation recruits both SH2B1β and STAT3, allowing an interaction between SH2B1β and monomeric STAT3 to occur (Fig. 9, steps 1 and 2). SH2B1β then transports STAT3 to the nucleus (Fig. 9, step 3). Once SH2B1β-STAT3 complex enters the nucleus, nuclear Sp1 or STAT3 may compete for binding to STAT3 (Fig. 9, step 4). STAT3 can now form either homodimers or heterodimers with Sp1 and can bind to promoter regions of Egr1 and Cdh2 to regulate gene expression (Fig. 9, step 5). Consistent with this model, the relative amounts of SH2B1β-STAT3 complexes increased after FGF1 stimulation (Fig. 3C). Although we cannot exclude the contribution of the canonical pathway of STAT3 activation, dimerization, and nuclear transport in this process (Fig. 9, steps 6 and 7), in response to FGF1, overexpression of SH2B1β increases the in vivo occupancy of Sp1-STAT3 heterodimers at the promoter of Egr1 and Cdh2 and induces higher levels of EGR1 and N-cadherin (Fig. 7). Consistent with our results, accumulating evidence suggests that STAT3 and Sp1 cooperatively regulate gene expression through neighboring Sp1 and STAT3 binding sites or through the Sp1 binding site alone (81, 82, 86, 87). pSTAT3(S727) specifically interacts with Sp1 (82). The reason that STAT3-Sp1 heterodimer is more efficient in turning on Egr1 than STAT3 homodimers could simply be that there are two Sp1-binding sites in the Egr1 promoter, whereas there is only one STAT3-binding site. Although FGF1-induced increase of STAT3-Sp1 complexes at the promoter regions of Egr1 and Cdh2 was not statistically significant in control PC12-GFP cells, there was a similar trend of increase (Fig. 7B and D). It is possible that when the endogenous SH2B1 level is increased during a later stage of differentiation, the binding of STAT3-Sp1 complexes at the promoter regions of FGF1-responsive genes is significantly increased. At resting state, SH2B1β overexpression increases the in vivo occupancy of STAT3 at the STAT3-binding site within the Egr1 promoter, which is consistent with higher pSTAT3(S727) levels in PC12-SH2B1β cells. Nonetheless, this increased occupancy of STAT3 at the promoter region of Egr1 is not sufficient to drive the initiation of transcription. It is likely that appropriate epigenetic modification in response to differentiation signal is also needed for the initiation of transcription.
FIG 8.
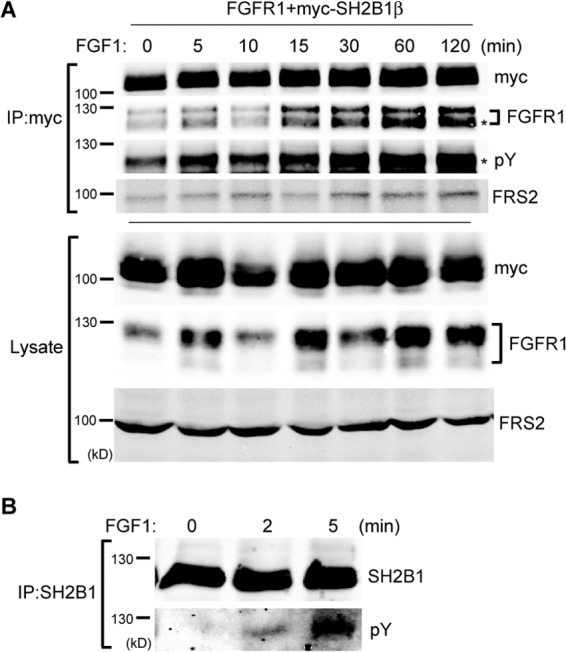
SH2B1β interacts with FGFR1. (A) COS7 cells were transiently transfected with rat FGFR1 and myc-SH2B1β. Cells were incubated in serum-free medium overnight before being treated with 100 ng/ml FGF1 plus 10 μg/ml heparin for the indicated times. Cell lysates were immunoprecipitated using anti-myc antibody and resolved with SDS-PAGE, followed by immunoblotting using antibodies against FGFR1, myc, phosphotyrosine (pY), and FRS2. An asterisk indicates matching molecular sizes. (B) PC12-SH2B1β cells were incubated in serum-free medium overnight before being treated with 100 ng/ml FGF1 for the indicated times. Cell lysates were immunoprecipitated using anti-SH2B1 antibody and resolved with SDS-PAGE followed by immunoblotting using antibodies against SH2B1 and phosphotyrosine to determine FGF1-induced tyrosine phosphorylation of SH2B1β.
FIG 9.

Schematic model of how SH2B1β enhances gene expression and neuronal differentiation through STAT3 (step 1). After FGF1 stimulation, SH2B1β and STAT3 interact with FGFR1 (step 2). SH2B1β subsequently interacts with STAT3 (step 3) and transports STAT3 to the nucleus (step 4). SH2B1β and STAT3 dissociate, followed by the formation of STAT3-STAT3 dimers and/or STAT3-Sp1 heterodimers, both of which bind to the promoter regions of differentiation genes, such as Egr1 (step 5) and Cdh2 (step 6). In a parallel pathway, phosphorylated STAT3 forms a homodimer and shuttles to the nucleus in response to FGF1 stimulation (step 7). SH2B1β may regulate a putative serine kinase (K) that phosphorylates STAT3. Solid line, known pathways or pathways identified in this study; dashed line, putative steps.
Taken together, these findings provide an important insight into how interaction between SH2B1β and STAT3 regulates the expression of neuronal differentiation genes. Most importantly, our results reveal a central role for SH2B1β in regulating transcriptional activation of STAT3 target genes during neuronal differentiation.
ACKNOWLEDGMENTS
We thank Liang-Tung Yang from the National Health Research Institutes in Taiwan for insightful discussions concerning this project. We also thank Ming-Jer Tang from National Cheng Kung University in Taiwan for providing STAT3 constructs.
This study was supported by grants from the National Science Council of Taiwan (NSC101-2311-B-007-012-MY3 and NSC101-2311-B-007-001), National Health Research Institutes (NHRI-EX102-10206NI), and National Tsing Hua University, Taiwan (102N2061E1).
Footnotes
Published ahead of print 6 January 2014
REFERENCES
- 1.Hashimoto M, Sagara Y, Langford D, Everall IP, Mallory M, Everson A, Digicaylioglu M, Masliah E. 2002. Fibroblast growth factor 1 regulates signaling via the glycogen synthase kinase-3beta pathway. Implications for neuroprotection. J. Biol. Chem. 277:32985–32991. 10.1074/jbc.M202803200 [DOI] [PubMed] [Google Scholar]
- 2.Allen SJ, Dawbarn D. 2006. Clinical relevance of the neurotrophins and their receptors. Clin. Sci. 110:175–191. 10.1042/CS20050161 [DOI] [PubMed] [Google Scholar]
- 3.Iwata T, Hevner RF. 2009. Fibroblast growth factor signaling in development of the cerebral cortex. Dev. Growth Differ. 51:299–323. 10.1111/j.1440-169X.2009.01104.x [DOI] [PubMed] [Google Scholar]
- 4.McAllister AK. 2001. Neurotrophins and neuronal differentiation in the central nervous system. Cell. Mol. Life Sci. 58:1054–1060. 10.1007/PL00000920 [DOI] [PMC free article] [PubMed] [Google Scholar]
- 5.Baird A. 1994. Fibroblast growth factors: activities and significance of non-neurotrophin neurotrophic growth factors. Curr. Opin. Neurobiol. 4:78–86. 10.1016/0959-4388(94)90035-3 [DOI] [PubMed] [Google Scholar]
- 6.Eckenstein FP. 1994. Fibroblast growth factors in the nervous system. J. Neurobiol. 25:1467–1480. 10.1002/neu.480251112 [DOI] [PubMed] [Google Scholar]
- 7.Dailey L, Ambrosetti D, Mansukhani A, Basilico C. 2005. Mechanisms underlying differential responses to FGF signaling. Cytokine Growth Factor Rev. 16:233–247. 10.1016/j.cytogfr.2005.01.007 [DOI] [PubMed] [Google Scholar]
- 8.Lobb R, Sasse J, Sullivan R, Shing Y, D'Amore P, Jacobs J, Klagsbrun M. 1986. Purification and characterization of heparin-binding endothelial cell growth factors. J. Biol. Chem. 261:1924–1928 [PubMed] [Google Scholar]
- 9.Lin HY, Xu J, Ornitz DM, Halegoua S, Hayman MJ. 1996. The fibroblast growth factor receptor-1 is necessary for the induction of neurite outgrowth in PC12 cells by aFGF. J. Neurosci. 16:4579–4587 [DOI] [PMC free article] [PubMed] [Google Scholar]
- 10.Rydel RE, Greene LA. 1987. Acidic and basic fibroblast growth factors promote stable neurite outgrowth and neuronal differentiation in cultures of PC12 cells. J. Neurosci. 7:3639–3653 [DOI] [PMC free article] [PubMed] [Google Scholar]
- 11.Flynn DC. 2001. Adaptor proteins. Oncogene 20:6270–6272. 10.1038/sj.onc.1204769 [DOI] [PubMed] [Google Scholar]
- 12.Gao H, Sun Y, Wu Y, Luan B, Wang Y, Qu B, Pei G. 2004. Identification of beta-arrestin2 as a G protein-coupled receptor-stimulated regulator of NF-kappaB pathways. Mol. Cell 14:303–317. 10.1016/S1097-2765(04)00216-3 [DOI] [PubMed] [Google Scholar]
- 13.Witherow DS, Garrison TR, Miller WE, Lefkowitz RJ. 2004. Beta-arrestin inhibits NF-kappaB activity by means of its interaction with the NF-kappaB inhibitor IkappaBalpha. Proc. Natl. Acad. Sci. U. S. A. 101:8603–8607. 10.1073/pnas.0402851101 [DOI] [PMC free article] [PubMed] [Google Scholar]
- 14.Kang J, Shi Y, Xiang B, Qu B, Su W, Zhu M, Zhang M, Bao G, Wang F, Zhang X, Yang R, Fan F, Chen X, Pei G, Ma L. 2005. A nuclear function of beta-arrestin1 in GPCR signaling: regulation of histone acetylation and gene transcription. Cell 123:833–847. 10.1016/j.cell.2005.09.011 [DOI] [PubMed] [Google Scholar]
- 15.Ikeda O, Sekine Y, Mizushima A, Nakasuji M, Miyasaka Y, Yamamoto C, Muromoto R, Nanbo A, Oritani K, Yoshimura A, Matsuda T. 2010. Interactions of STAP-2 with Brk and STAT3 participate in cell growth of human breast cancer cells. J. Biol. Chem. 285:38093–38103. 10.1074/jbc.M110.162388 [DOI] [PMC free article] [PubMed] [Google Scholar]
- 16.Minoguchi M, Minoguchi S, Aki D, Joo A, Yamamoto T, Yumioka T, Matsuda T, Yoshimura A. 2003. STAP-2/BKS, an adaptor/docking protein, modulates STAT3 activation in acute-phase response through its YXXQ motif. J. Biol. Chem. 278:11182–11189. 10.1074/jbc.M211230200 [DOI] [PubMed] [Google Scholar]
- 17.Mitchell PJ, Sara EA, Crompton MR. 2000. A novel adaptor-like protein which is a substrate for the non-receptor tyrosine kinase, BRK. Oncogene 19:4273–4282. 10.1038/sj.onc.1203775 [DOI] [PubMed] [Google Scholar]
- 18.Javadi M, Hofstatter E, Stickle N, Beattie BK, Jaster R, Carter-Su C, Barber DL. 2012. The SH2B1 adaptor protein associates with a proximal region of the erythropoietin receptor. J. Biol. Chem. 287:26223–26234. 10.1074/jbc.M112.382721 [DOI] [PMC free article] [PubMed] [Google Scholar]
- 19.Kong M, Wang CS, Donoghue DJ. 2002. Interaction of fibroblast growth factor receptor 3 and the adapter protein SH2-B. A role in STAT5 activation. J. Biol. Chem. 277:15962–15970. 10.1074/jbc.M102777200 [DOI] [PubMed] [Google Scholar]
- 20.Qian X, Ginty DD. 2001. SH2-B and APS are multimeric adapters that augment TrkA signaling. Mol. Cell. Biol. 21:1613–1620. 10.1128/MCB.21.5.1613-1620.2001 [DOI] [PMC free article] [PubMed] [Google Scholar]
- 21.Qian X, Riccio A, Zhang Y, Ginty DD. 1998. Identification and characterization of novel substrates of Trk receptors in developing neurons. Neuron 21:1017–1029. 10.1016/S0896-6273(00)80620-0 [DOI] [PubMed] [Google Scholar]
- 22.Rui L, Herrington J, Carter-Su C. 1999. SH2-B is required for nerve growth factor-induced neuronal differentiation. J. Biol. Chem. 274:10590–10594. 10.1074/jbc.274.15.10590 [DOI] [PubMed] [Google Scholar]
- 23.Zhang Y, Zhu W, Wang YG, Liu XJ, Jiao L, Liu X, Zhang ZH, Lu CL, He C. 2006. Interaction of SH2-Bbeta with RET is involved in signaling of GDNF-induced neurite outgrowth. J. Cell Sci. 119:1666–1676. 10.1242/jcs.02845 [DOI] [PubMed] [Google Scholar]
- 24.Lin WF, Chen CJ, Chang YJ, Chen SL, Chiu IM, Chen L. 2009. SH2B1beta enhances fibroblast growth factor 1 (FGF1)-induced neurite outgrowth through MEK-ERK1/2-STAT3-Egr1 pathway. Cell. Signal. 21:1060–1072. 10.1016/j.cellsig.2009.02.009 [DOI] [PubMed] [Google Scholar]
- 25.Chen L, Carter-Su C. 2004. Adapter protein SH2-B beta undergoes nucleocytoplasmic shuttling: implications for nerve growth factor induction of neuronal differentiation. Mol. Cell. Biol. 24:3633–3647. 10.1128/MCB.24.9.3633-3647.2004 [DOI] [PMC free article] [PubMed] [Google Scholar]
- 26.Chen L, Maures TJ, Jin H, Huo JS, Rabbani SA, Schwartz J, Carter-Su C. 2008. SH2B1beta (SH2-Bbeta) enhances expression of a subset of nerve growth factor-regulated genes important for neuronal differentiation including genes encoding urokinase plasminogen activator receptor and matrix metalloproteinase 3/10. Mol. Endocrinol. 22:454–476. 10.1210/me.2007-0384 [DOI] [PMC free article] [PubMed] [Google Scholar]
- 27.Maures TJ, Chen L, Carter-Su C. 2009. Nucleocytoplasmic shuttling of the adapter protein SH2B1beta (SH2-Bbeta) is required for nerve growth factor (NGF)-dependent neurite outgrowth and enhancement of expression of a subset of NGF-responsive genes. Mol. Endocrinol. 23:1077–1091. 10.1210/me.2009-0011 [DOI] [PMC free article] [PubMed] [Google Scholar]
- 28.Levy DE, Darnell JE., Jr 2002. Stats: transcriptional control and biological impact. Nat. Rev. Mol. Cell. Biol. 3:651–662. 10.1038/nrm909 [DOI] [PubMed] [Google Scholar]
- 29.Zhong Z, Wen Z, Darnell JE., Jr 1994. Stat3: a STAT family member activated by tyrosine phosphorylation in response to epidermal growth factor and interleukin-6. Science 264:95–98. 10.1126/science.8140422 [DOI] [PubMed] [Google Scholar]
- 30.Wen Z, Zhong Z, Darnell JE., Jr 1995. Maximal activation of transcription by Stat1 and Stat3 requires both tyrosine and serine phosphorylation. Cell 82:241–250. 10.1016/0092-8674(95)90311-9 [DOI] [PubMed] [Google Scholar]
- 31.Zhang X, Blenis J, Li HC, Schindler C, Chen-Kiang S. 1995. Requirement of serine phosphorylation for formation of STAT-promoter complexes. Science 267:1990–1994. 10.1126/science.7701321 [DOI] [PubMed] [Google Scholar]
- 32.Courapied S, Sellier H, de Carne Trecesson S, Vigneron A, Bernard AC, Gamelin E, Barre B, Coqueret O. 2010. The cdk5 kinase regulates the STAT3 transcription factor to prevent DNA damage upon topoisomerase I inhibition. J. Biol. Chem. 285:26765–26778. 10.1074/jbc.M109.092304 [DOI] [PMC free article] [PubMed] [Google Scholar]
- 33.Lim CP, Cao X. 1999. Serine phosphorylation and negative regulation of Stat3 by JNK. J. Biol. Chem. 274:31055–31061. 10.1074/jbc.274.43.31055 [DOI] [PubMed] [Google Scholar]
- 34.Ng YP, Cheung ZH, Ip NY. 2006. STAT3 as a downstream mediator of Trk signaling and functions. J. Biol. Chem. 281:15636–15644. 10.1074/jbc.M601863200 [DOI] [PubMed] [Google Scholar]
- 35.O'Shea JJ, Kanno Y, Chen X, Levy DE. 2005. Cell signaling. Stat acetylation–a key facet of cytokine signaling? Science 307:217–218. 10.1126/science.1108164 [DOI] [PubMed] [Google Scholar]
- 36.Ohbayashi N, Ikeda O, Taira N, Yamamoto Y, Muromoto R, Sekine Y, Sugiyama K, Honjoh T, Matsuda T. 2007. LIF- and IL-6-induced acetylation of STAT3 at Lys-685 through PI3K/Akt activation. Biol. Pharm. Bull. 30:1860–1864. 10.1248/bpb.30.1860 [DOI] [PubMed] [Google Scholar]
- 37.Wang R, Cherukuri P, Luo J. 2005. Activation of Stat3 sequence-specific DNA binding and transcription by p300/CREB-binding protein-mediated acetylation. J. Biol. Chem. 280:11528–11534. 10.1074/jbc.M413930200 [DOI] [PubMed] [Google Scholar]
- 38.Yuan ZL, Guan YJ, Chatterjee D, Chin YE. 2005. Stat3 dimerization regulated by reversible acetylation of a single lysine residue. Science 307:269–273. 10.1126/science.1105166 [DOI] [PubMed] [Google Scholar]
- 39.Kubota K, Inoue K, Hashimoto R, Kumamoto N, Kosuga A, Tatsumi M, Kamijima K, Kunugi H, Iwata N, Ozaki N, Takeda M, Tohyama M. 2009. Tumor necrosis factor receptor-associated protein 1 regulates cell adhesion and synaptic morphology via modulation of N-cadherin expression. J. Neurochem. 110:496–508. 10.1111/j.1471-4159.2009.06099.x [DOI] [PubMed] [Google Scholar]
- 40.Snyder M, Huang XY, Zhang JJ. 2011. Stat3 is essential for neuronal differentiation through direct transcriptional regulation of the Sox6 gene. FEBS Lett. 585:148–152. 10.1016/j.febslet.2010.11.030 [DOI] [PMC free article] [PubMed] [Google Scholar]
- 41.Fujio Y, Matsuda T, Oshima Y, Maeda M, Mohri T, Ito T, Takatani T, Hirata M, Nakaoka Y, Kimura R, Kishimoto T, Azuma J. 2004. Signals through gp130 upregulate Wnt5a and contribute to cell adhesion in cardiac myocytes. FEBS Lett. 573:202–206. 10.1016/j.febslet.2004.07.082 [DOI] [PubMed] [Google Scholar]
- 42.Colomiere M, Findlay J, Ackland L, Ahmed N. 2009. Epidermal growth factor-induced ovarian carcinoma cell migration is associated with JAK2/STAT3 signals and changes in the abundance and localization of alpha6beta1 integrin. Int. J. Biochem. Cell Biol. 41:1034–1045. 10.1016/j.biocel.2008.09.018 [DOI] [PubMed] [Google Scholar]
- 43.Snyder M, Huang XY, Zhang JJ. 2008. Identification of novel direct Stat3 target genes for control of growth and differentiation. J. Biol. Chem. 283:3791–3798. 10.1074/jbc.M706976200 [DOI] [PubMed] [Google Scholar]
- 44.Bixby JL, Zhang R. 1990. Purified N-cadherin is a potent substrate for the rapid induction of neurite outgrowth. J. Cell Biol. 110:1253–1260. 10.1083/jcb.110.4.1253 [DOI] [PMC free article] [PubMed] [Google Scholar]
- 45.Gao X, Bian W, Yang J, Tang K, Kitani H, Atsumi T, Jing N. 2001. A role of N-cadherin in neuronal differentiation of embryonic carcinoma P19 cells. Biochem. Biophys. Res. Commun. 284:1098–1103. 10.1006/bbrc.2001.5089 [DOI] [PubMed] [Google Scholar]
- 46.Wang TC, Chiu H, Chang YJ, Hsu TY, Chiu IM, Chen L. 2011. The adaptor protein SH2B3 (Lnk) negatively regulates neurite outgrowth of PC12 cells and cortical neurons. PLoS One 6:e26433. 10.1371/journal.pone.0026433 [DOI] [PMC free article] [PubMed] [Google Scholar]
- 47.Bromberg JF, Wrzeszczynska MH, Devgan G, Zhao Y, Pestell RG, Albanese C, Darnell JE., Jr 1999. Stat3 as an oncogene. Cell 98:295–303. 10.1016/S0092-8674(00)81959-5 [DOI] [PubMed] [Google Scholar]
- 48.Su HW, Yeh HH, Wang SW, Shen MR, Chen TL, Kiela PR, Ghishan FK, Tang MJ. 2007. Cell confluence-induced activation of signal transducer and activator of transcription-3 (Stat3) triggers epithelial dome formation via augmentation of sodium hydrogen exchanger-3 (NHE3) expression. J. Biol. Chem. 282:9883–9894. 10.1074/jbc.M606754200 [DOI] [PubMed] [Google Scholar]
- 49.Kaptein A, Paillard V, Saunders M. 1996. Dominant negative stat3 mutant inhibits interleukin-6-induced Jak-STAT signal transduction. J. Biol. Chem. 271:5961–5964. 10.1074/jbc.271.11.5961 [DOI] [PubMed] [Google Scholar]
- 50.Turkson J, Bowman T, Garcia R, Caldenhoven E, De Groot RP, Jove R. 1998. Stat3 activation by Src induces specific gene regulation and is required for cell transformation. Mol. Cell. Biol. 18:2545–2552 [DOI] [PMC free article] [PubMed] [Google Scholar]
- 51.Besser D, Bromberg JF, Darnell JE, Jr, Hanafusa H. 1999. A single amino acid substitution in the v-Eyk intracellular domain results in activation of Stat3 and enhances cellular transformation. Mol. Cell. Biol. 19:1401–1409 [DOI] [PMC free article] [PubMed] [Google Scholar]
- 52.Wen Z, Darnell JE., Jr 1997. Mapping of Stat3 serine phosphorylation to a single residue (727) and evidence that serine phosphorylation has no influence on DNA binding of Stat1 and Stat3. Nucleic Acids Res. 25:2062–2067. 10.1093/nar/25.11.2062 [DOI] [PMC free article] [PubMed] [Google Scholar]
- 53.Hsiao SP, Chen SL. 2010. Myogenic regulatory factors regulate M-cadherin expression by targeting its proximal promoter elements. Biochem. J. 428:223–233. 10.1042/BJ20100250 [DOI] [PubMed] [Google Scholar]
- 54.Harada A, Katoh H, Negishi M. 2005. Direct interaction of Rnd1 with FRS2 beta regulates Rnd1-induced down-regulation of RhoA activity and is involved in fibroblast growth factor-induced neurite outgrowth in PC12 cells. J. Biol. Chem. 280:18418–18424. 10.1074/jbc.M411356200 [DOI] [PubMed] [Google Scholar]
- 55.Wang TC, Li YH, Chen KW, Chen CJ, Wu CL, Teng NY, Chen L. 2011. SH2B1beta regulates N-cadherin levels, cell-cell adhesion and nerve growth factor-induced neurite initiation. J. Cell. Physiol. 226:2063–2074. 10.1002/jcp.22544 [DOI] [PubMed] [Google Scholar]
- 56.Wu CL, Chou YH, Chang YJ, Teng NY, Hsu HL, Chen L. 2012. Interplay between cell migration and neurite outgrowth determines SH2B1beta-enhanced neurite regeneration of differentiated PC12 cells. PLoS One 7:e34999. 10.1371/journal.pone.0034999 [DOI] [PMC free article] [PubMed] [Google Scholar]
- 57.Burgess WH, Shaheen AM, Ravera M, Jaye M, Donohue PJ, Winkles JA. 1990. Possible dissociation of the heparin-binding and mitogenic activities of heparin-binding (acidic fibroblast) growth factor-1 from its receptor-binding activities by site-directed mutagenesis of a single lysine residue. J. Cell Biol. 111:2129–2138. 10.1083/jcb.111.5.2129 [DOI] [PMC free article] [PubMed] [Google Scholar]
- 58.Harper JW, Lobb RR. 1988. Reductive methylation of lysine residues in acidic fibroblast growth factor: effect on mitogenic activity and heparin affinity. Biochemistry 27:671–678. 10.1021/bi00402a027 [DOI] [PubMed] [Google Scholar]
- 59.Becker S, Corthals GL, Aebersold R, Groner B, Muller CW. 1998. Expression of a tyrosine phosphorylated, DNA binding Stat3beta dimer in bacteria. FEBS Lett. 441:141–147. 10.1016/S0014-5793(98)01543-9 [DOI] [PubMed] [Google Scholar]
- 60.Hu J, Hubbard SR. 2006. Structural basis for phosphotyrosine recognition by the Src homology-2 domains of the adapter proteins SH2-B and APS. J. Mol. Biol. 361:69–79. 10.1016/j.jmb.2006.05.070 [DOI] [PubMed] [Google Scholar]
- 61.Comeau SR, Gatchell DW, Vajda S, Camacho CJ. 2004. ClusPro: a fully automated algorithm for protein-protein docking. Nucleic Acids Res. 32:W96–W99. 10.1093/nar/gkh354 [DOI] [PMC free article] [PubMed] [Google Scholar]
- 62.Comeau SR, Gatchell DW, Vajda S, Camacho CJ. 2004. ClusPro: an automated docking and discrimination method for the prediction of protein complexes. Bioinformatics 20:45–50. 10.1093/bioinformatics/btg371 [DOI] [PubMed] [Google Scholar]
- 63.Kozakov D, Brenke R, Comeau SR, Vajda S. 2006. PIPER: an FFT-based protein docking program with pairwise potentials. Proteins 65:392–406. 10.1002/prot.21117 [DOI] [PubMed] [Google Scholar]
- 64.Kozakov D, Hall DR, Beglov D, Brenke R, Comeau SR, Shen Y, Li K, Zheng J, Vakili P, Paschalidis I, Vajda S. 2010. Achieving reliability and high accuracy in automated protein docking: ClusPro, PIPER, SDU, and stability analysis in CAPRI rounds 13–19. Proteins 78:3124–3130. 10.1002/prot.22835 [DOI] [PMC free article] [PubMed] [Google Scholar]
- 65.Krissinel E, Henrick K. 2007. Inference of macromolecular assemblies from crystalline state. J. Mol. Biol. 372:774–797. 10.1016/j.jmb.2007.05.022 [DOI] [PubMed] [Google Scholar]
- 66.Pettersen EF, Goddard TD, Huang CC, Couch GS, Greenblatt DM, Meng EC, Ferrin TE. 2004. UCSF Chimera–a visualization system for exploratory research and analysis. J. Comput. Chem. 25:1605–1612. 10.1002/jcc.20084 [DOI] [PubMed] [Google Scholar]
- 67.Schoppee Bortz PD, Wamhoff BR. 2011. Chromatin immunoprecipitation (ChIP): revisiting the efficacy of sample preparation, sonication, quantification of sheared DNA, and analysis via PCR. PLoS One 6:e26015. 10.1371/journal.pone.0026015 [DOI] [PMC free article] [PubMed] [Google Scholar]
- 68.Schiavone D, Avalle L, Dewilde S, Poli V. 2011. The immediate early genes Fos and Egr1 become STAT1 transcriptional targets in the absence of STAT3. FEBS Lett. 585:2455–2460. 10.1016/j.febslet.2011.06.020 [DOI] [PubMed] [Google Scholar]
- 69.Vallania F, Schiavone D, Dewilde S, Pupo E, Garbay S, Calogero R, Pontoglio M, Provero P, Poli V. 2009. Genome-wide discovery of functional transcription factor binding sites by comparative genomics: the case of Stat3. Proc. Natl. Acad. Sci. U. S. A. 106:5117–5122. 10.1073/pnas.0900473106 [DOI] [PMC free article] [PubMed] [Google Scholar]
- 70.Russell DL, Doyle KM, Gonzales-Robayna I, Pipaon C, Richards JS. 2003. Egr-1 induction in rat granulosa cells by follicle-stimulating hormone and luteinizing hormone: combinatorial regulation by transcription factors cyclic adenosine 3′,5′-monophosphate regulatory element binding protein, serum response factor, sp1, and early growth response factor-1. Mol. Endocrinol. 17:520–533. 10.1210/me.2002-0066 [DOI] [PubMed] [Google Scholar]
- 71.Yousaf N, Deng Y, Kang Y, Riedel H. 2001. Four PSM/SH2-B alternative splice variants and their differential roles in mitogenesis. J. Biol. Chem. 276:40940–40948. 10.1074/jbc.M104191200 [DOI] [PubMed] [Google Scholar]
- 72.Clark J, Edwards S, Feber A, Flohr P, John M, Giddings I, Crossland S, Stratton MR, Wooster R, Campbell C, Cooper CS. 2003. Genome-wide screening for complete genetic loss in prostate cancer by comparative hybridization onto cDNA microarrays. Oncogene 22:1247–1252. 10.1038/sj.onc.1206247 [DOI] [PubMed] [Google Scholar]
- 73.Becker S, Groner B, Muller CW. 1998. Three-dimensional structure of the Stat3beta homodimer bound to DNA. Nature 394:145–151. 10.1038/28101 [DOI] [PubMed] [Google Scholar]
- 74.Schaefer TS, Sanders LK, Nathans D. 1995. Cooperative transcriptional activity of Jun and Stat3 beta, a short form of Stat3. Proc. Natl. Acad. Sci. U. S. A. 92:9097–9101. 10.1073/pnas.92.20.9097 [DOI] [PMC free article] [PubMed] [Google Scholar]
- 75.Song H, Wang R, Wang S, Lin J. 2005. A low-molecular-weight compound discovered through virtual database screening inhibits Stat3 function in breast cancer cells. Proc. Natl. Acad. Sci. U. S. A. 102:4700–4705. 10.1073/pnas.0409894102 [DOI] [PMC free article] [PubMed] [Google Scholar]
- 76.Radice GL, Rayburn H, Matsunami H, Knudsen KA, Takeichi M, Hynes RO. 1997. Developmental defects in mouse embryos lacking N-cadherin. Dev. Biol. 181:64–78. 10.1006/dbio.1996.8443 [DOI] [PubMed] [Google Scholar]
- 77.Redies C. 2000. Cadherins in the central nervous system. Progress Neurobiol. 61:611–648. 10.1016/S0301-0082(99)00070-2 [DOI] [PubMed] [Google Scholar]
- 78.Shoval I, Ludwig A, Kalcheim C. 2007. Antagonistic roles of full-length N-cadherin and its soluble BMP cleavage product in neural crest delamination. Development 134:491–501. 10.1242/dev.02742 [DOI] [PubMed] [Google Scholar]
- 79.Le Mee S, Fromigue O, Marie PJ. 2005. Sp1/Sp3 and the myeloid zinc finger gene MZF1 regulate the human N-cadherin promoter in osteoblasts. Exp. Cell Res. 302:129–142. 10.1016/j.yexcr.2004.08.028 [DOI] [PubMed] [Google Scholar]
- 80.Li B, Paradies NE, Brackenbury RW. 1997. Isolation and characterization of the promoter region of the chicken N-cadherin gene. Gene 191:7–13. 10.1016/S0378-1119(97)00006-1 [DOI] [PubMed] [Google Scholar]
- 81.Loeffler S, Fayard B, Weis J, Weissenberger J. 2005. Interleukin-6 induces transcriptional activation of vascular endothelial growth factor (VEGF) in astrocytes in vivo and regulates VEGF promoter activity in glioblastoma cells via direct interaction between STAT3 and Sp1. Int. J. Cancer 115:202–213. 10.1002/ijc.20871 [DOI] [PubMed] [Google Scholar]
- 82.Yang XP, Irani K, Mattagajasingh S, Dipaula A, Khanday F, Ozaki M, Fox-Talbot K, Baldwin WM, III, Becker LC. 2005. Signal transducer and activator of transcription 3alpha and specificity protein 1 interact to upregulate intercellular adhesion molecule-1 in ischemic-reperfused myocardium and vascular endothelium. Arterioscler. Thromb. Vasc. Biol. 25:1395–1400. 10.1161/01.ATV.0000168428.96177.24 [DOI] [PubMed] [Google Scholar]
- 83.Spiotto MT, Chung TD. 2000. STAT3 mediates IL-6-induced growth inhibition in the human prostate cancer cell line LNCaP. Prostate 42:88–98 [DOI] [PubMed] [Google Scholar]
- 84.Akintola AD, Crislip ZL, Catania JM, Chen G, Zimmer WE, Burghardt RC, Parrish AR. 2008. Promoter methylation is associated with the age-dependent loss of N-cadherin in the rat kidney. Am. J. Physiol. Renal Physiol. 294:F170–F176. 10.1152/ajprenal.00285.2007 [DOI] [PubMed] [Google Scholar]
- 85.Dudka AA, Sweet SM, Heath JK. 2010. Signal transducers and activators of transcription-3 binding to the fibroblast growth factor receptor is activated by receptor amplification. Cancer Res. 70:3391–3401. 10.1158/0008-5472.CAN-09-3033 [DOI] [PMC free article] [PubMed] [Google Scholar]
- 86.Kiryu-Seo S, Kato R, Ogawa T, Nakagomi S, Nagata K, Kiyama H. 2008. Neuronal injury-inducible gene is synergistically regulated by ATF3, c-Jun, and STAT3 through the interaction with Sp1 in damaged neurons. J. Biol. Chem. 283:6988–6996. 10.1074/jbc.M707514200 [DOI] [PubMed] [Google Scholar]
- 87.Lin S, Saxena NK, Ding X, Stein LL, Anania FA. 2006. Leptin increases tissue inhibitor of metalloproteinase I (TIMP-1) gene expression by a specificity protein 1/signal transducer and activator of transcription 3 mechanism. Mol. Endocrinol. 20:3376–3388. 10.1210/me.2006-0177 [DOI] [PMC free article] [PubMed] [Google Scholar]