

ABSTRACT
Influenza A(H3N2) viruses became widespread in humans during the 1968 H3N2 virus pandemic and have been a major cause of influenza epidemics ever since. These viruses evolve continuously by reassortment and genomic evolution. Antigenic drift is the cause for the need to update influenza vaccines frequently. Using two data sets that span the entire period of circulation of human influenza A(H3N2) viruses, it was shown that influenza A(H3N2) virus evolution can be mapped to 13 antigenic clusters. Here we analyzed the full genomes of 286 influenza A(H3N2) viruses from these two data sets to investigate the genomic evolution and reassortment patterns. Numerous reassortment events were found, scattered over the entire period of virus circulation, but most prominently in viruses circulating between 1991 and 1998. Some of these reassortment events persisted over time, and one of these coincided with an antigenic cluster transition. Furthermore, selection pressures and nucleotide and amino acid substitution rates of all proteins were studied, including those of the recently discovered PB1-N40, PA-X, PA-N155, and PA-N182 proteins. Rates of nucleotide and amino acid substitutions were most pronounced for the hemagglutinin, neuraminidase, and PB1-F2 proteins. Selection pressures were highest in hemagglutinin, neuraminidase, matrix 1, and nonstructural protein 1. This study of genotype in relation to antigenic phenotype throughout the period of circulation of human influenza A(H3N2) viruses leads to a better understanding of the evolution of these viruses.
IMPORTANCE Each winter, influenza virus infects approximately 5 to 15% of the world's population, resulting in significant morbidity and mortality. Influenza A(H3N2) viruses evolve continuously by reassortment and genomic evolution. This leads to changes in antigenic recognition (antigenic drift) which make it necessary to update vaccines against influenza A(H3N2) viruses frequently. In this study, the relationship of genetic evolution to antigenic change spanning the entire period of A(H3N2) virus circulation was studied for the first time. The results presented in this study contribute to a better understanding of genetic evolution in correlation with antigenic evolution of influenza A(H3N2) viruses.
INTRODUCTION
Influenza A viruses are members of the Orthomyxoviridae family, which comprises enveloped, negative-sense, single-stranded RNA viruses containing a genome divided over eight segments. The eight segments include basic polymerase 2 (PB2), basic polymerase 1 (PB1), acidic polymerase (PA), hemagglutinin (HA), nucleoprotein (NP), neuraminidase (NA), matrix (M), and nonstructural protein (NS).
The segmented nature of the genome allows for the exchange of entire genes between different influenza viruses during simultaneous infection of a host, in a process called reassortment. Intersubtypic reassortments between swine, avian, and/or human influenza A viruses have led to several pandemics. These pandemic viruses later became established as seasonal influenza viruses causing annual epidemics. Influenza virus type A is subdivided based on the antigenic properties of the major surface glycoproteins: HA and NA. To date, 17 HA (1, 2) and 10 NA (3, 4) subtypes have been found in nature.
The 1957 H2N2 influenza pandemic emerged as a consequence of reassortment between the then circulating seasonal influenza A(H1N1) virus and an avian influenza A(H2N2) virus (5). The A(H2N2) virus caused annual epidemics until the 1968 H3N2 influenza pandemic emerged. This pandemic was the result of reassortment of a human A(H2N2) virus with an avian influenza A(H3N2) virus (5). A(H3N2) viruses have been a major cause of influenza epidemics ever since, with significant morbidity and mortality (6, 7). A(H2N2) and A(H3N2) viruses cocirculated until 1971 (8), after which A(H2N2) viruses became extinct in the human population.
Reassortment between influenza viruses of the same subtype (intrasubtypic reassortment), together with genomic evolution, is presumably one of many ways for the virus to increase diversity (9–11), shaping the short-term evolution of influenza A viruses (9). Mutations in the major surface glycoproteins (HA and NA) resulting from antibody pressure, in a process known as antigenic drift (12), increase diversity but, more importantly, are a way for the virus to effectively evade the host's immune system.
In 2004, Smith et al. mapped the antigenic evolution of the HA proteins of A(H3N2) viruses from their introduction in 1968 until 2003 (13). Their study was based on an extensive data set of A(H3N2) virus isolates obtained from each consecutive influenza season. The study revealed 11 antigenic clusters, named after the first vaccine strain of each cluster: A/Hong Kong/1/1968 (HK68), A/England/42/1972 (EN72), A/Victoria/3/1975 (VI75), A/Texas/1/1977 (TX77), A/Bangkok/1/1979 (BK79), A/Sichuan/2/1987 (SI87), A/Beijing/353/1989 (BE89), A/Beijing/32/1992 (BE92), A/Wuhan/359/1995 (WU95), A/Sydney/5/1997 (SY97), and A/Fujian/411/2002 (FU02). Each of these antigenic clusters contains viruses that are antigenically similar for some time, after which a “cluster transition” warrants a vaccine update. Recently, two additional major antigenic clusters were described by de Jong et al.: A/California/7/2004 (CA04) and A/Perth/16/2009 (PE09) (14).
Genetic analysis of the NA and HA1 proteins of A(H3N2) viruses from these two studies revealed a large number of reassortment events and an asynchronous and slightly slower evolution of NA than that of HA1 (15). Here we extended this analysis to the full genome. In total, 284 full A(H3N2) virus genomes, comprising viruses described by Smith et al. (13) and de Jong et al. (14), were submitted to GenBank. In addition, two vaccine/reference strains from GenBank were included in our data set, resulting in 286 full genomes spanning more than 40 years of A(H3N2) virus evolution. These full genomes were analyzed with a focus on reassortment, rates of evolutionary change, and selection pressures of the eight segments and 15 proteins. The results presented in this study contribute to a better understanding of the complex evolution of A(H3N2) viruses.
MATERIALS AND METHODS
Viruses.
A total of 284 A(H3N2) viruses isolated between 1968 and 2011 (13–15) were subjected to full-genome sequencing. Viruses were propagated as described previously (15), and full-genome sequencing was performed as described previously (15) or by the J. Craig Venter Institute (JCVI). Sequences of two of the vaccine strains that were included in this study were retrieved from GenBank, as well as a number of sequences from segments that were not fully sequenced.
Of the 284 A(H3N2) viruses, 281 viruses were sequenced at JCVI. Viral RNA was purified using a Zymo Research Corporation 96 Viral RNA kit, and the complete genome was simultaneously amplified from 3 μl of purified RNA by using a multisegment reverse transcription-PCR (M-RTPCR) strategy (16, 17). The majority of the samples were sequenced using a PCR/Sanger high-throughput sequencing pipeline (18). Primer sequences are available upon request. Thirteen samples [A/Bangkok/1/1979, A/Auckland/4382/1982(mixed), A/Netherlands/233/1982, A/Leningrad/360/1986, A/Victoria/1/1988, A/Oklahoma/5/1988, A/Beijing/353/1989, A/United Kingdom/261/1991, A/Brisbane/8/1996, A/Netherlands/5/1998, A/Netherlands/301/1999, A/Netherlands/009/2010, and A/Netherlands/034/2010] were sequenced by M-RTPCR (16, 17), followed by sequence-independent single-primer amplification (SISPA) (19) and then combined next-generation sequencing using a 454/Roche GS-FLX instrument and an Illumina Genome Analyzer II instrument.
Sequence preparation.
Nucleotide sequences of 286 complete A(H3N2) virus genomes (details on the segments can be found in Table S1 in the supplemental material) were aligned using the ClustalW program running within the BioEdit software package, version 7.0.9.0 (20). Nucleotides before the first start codon and after the last stop codon of each segment were removed. The sequences were manually edited and translated into amino acids by using BioEdit. Ambiguous amino acids were assigned either a “B” (indicating aspartate or asparagine) or an “X” (indicating any amino acid). The stop codons of the amino acid alignments of PB1-F2 and PA-X were replaced by “X.” Both the nucleotide and amino acid NS1 alignments were C-terminally truncated to a length of 220 codons/amino acids (aa) due to stop codons at codons/aa 221 and 231 in some of the NS1 sequences.
Phylogeny.
We inferred maximum likelihood (ML) phylogenetic trees by using the GTR+Γ4+I (the general time-reversible model with the proportion of invariant sites and the gamma distribution of among-site rate variation with four categories estimated from the empirical data) model of nucleotide substitution and the PhyML package, version 3.0 (21), performing a full heuristic search and subtree pruning and regrafting (SPR) searches. Garli, version 0.951 (22), was used to perform 1 million generations of the best nucleotide tree from PhyML to optimize tree topology and branch lengths. The reliability of all phylogenetic groupings of each tree was determined through a nonparametric bootstrap resampling analysis with Garli: 1,000 replicates of ML trees were analyzed by applying the GTR+Γ4+I model of nucleotide substitution. Detailed trees, including bootstrap values, are shown in Fig. S1 in the supplemental material. Trees were visualized through the FigTree program, version 1.3.1 (http://tree.bio.ed.ac.uk/software/figtree/).
Rates of amino acid evolution.
To determine the ML-optimized best-fit models of protein evolution, amino acid sequence alignments were subjected to analysis by ProtTest (23) (see Table S2 in the supplemental material). ML trees were inferred by applying the PhyML package, version 3.0 (21), in combination with the best-fit model of protein evolution based on the Akaike information criterion (AIC), and performing a full heuristic search and SPR searches.
For all A(H3N2) viruses, the genetic distance of each open reading frame (ORF), HA1, or HA2 to A/Hong Kong/1/68 was calculated from the phylogenetic tree and plotted as a function of time.
Detection of reassortment.
TreeMap, version 1.0 (http://taxonomy.zoology.gla.ac.uk/rod/treemap.html), was used to generate tanglegrams with the phylogenetic ML trees.
Reassortment events were identified by the graph incompatibility-based reassortment finder (GiRaF) program (24), as described previously (15). Nucleotide alignments of the full segments were used as input for MrBayes (25, 26). The best-fit models of nucleotide substitution were determined using jModelTest (27). As input for the GiRaF program, 1,000 unrooted candidate trees were inferred by using the GTR+Γ4+I (PB1, HA, and NP) or GTR+Γ4 (PB2, PA, NA, M, and NS) substitution model, a burn-in of 50% (100,000 iterations), and sampling every 200 iterations. These trees were subsequently used to model the phylogenetic uncertainty for each segment, using the GiRaF program with default settings. The default confidence threshold was 0.7; for our data set, all events reported by GiRaF had confidence levels of >0.83, with almost all falling above 0.9. This procedure was repeated 50 times with 50 independent MrBayes tree files per segment. Rather than looking at only one pair of segments, GiRaF was applied to all 28 combinations of segments. This was done to more comprehensively catalog reassortment events, making the analysis even more stringent (24).
Estimation of nucleotide substitution rates and times of divergence.
Overall rates of evolutionary change (number of nucleotide [nt] substitutions per site per year) and times of circulation of the most recent common ancestor (MRCA) (in years) were estimated using the BEAST program, version 1.7.0 (http://beast.bio.ed.ac.uk/) (28). For all analyses, the uncorrelated log-normal relaxed molecular clock was used to accommodate variation in the molecular evolutionary rate among lineages, in combination with the GTR+Γ4+I (PB1, HA, HA1, and NP), GTR+Γ4 (PB2, PB1-F2, PB1-N40, PA, PA-N155, PA-N182, HA2, NA, M, M2, NS, NS1, and NEP), or GTR+I (PA-X and M1) substitution model. Isolation dates were used to calibrate the molecular clock. This analysis was conducted using a time-aware linear Bayesian skyride coalescent tree prior (29) over the unknown tree space, relatively uninformative priors on all model parameters, and a normal prior on the mean skyride size (log units) of 11.0 (standard deviation [SD], 1.8) (30).
Sequences were grouped into the following 13 taxon sets based on the antigenic clusters of HA (13, 14): HK68, EN72, VI75, TX77, BK79, SI87, BE89, BE92, WU95, SY97, FU02, CA04, and PE09. Three independent Bayesian Markov chain Monte Carlo (MCMC) analyses were performed on all segments, coding regions, HA1, and HA2 for 50 million states, with sampling every 2,000 states. Convergences and effective sample sizes of the estimates were checked with Tracer, version 1.5 (http://tree.bio.ed.ac.uk/software/tracer/). These analyses were combined with LogCombiner, version 1.7.0, with a burn-in of 10 to 20% to reach full convergence. Uncertainty in parameter estimates was reported as the 95% highest posterior density (HPD). A Bayes factor test was employed to evaluate if the times of circulation of the MRCAs of the gene segments of a given antigenic cluster were significantly different (10, 31–34) (see Table S3 in the supplemental material).
Selection pressures.
Selection pressures were measured for all codon alignments in combination with the ML trees of each segment. To determine the degree of natural selection acting on all protein coding regions, the average numbers of nonsynonymous (dN) and synonymous (dS) substitutions per codon (dN/dS ratio) were estimated for the entire tree, the internal branches, and the external branches by using single-likelihood ancestor counting (SLAC) (35).
Positively selected codons along internal branches were detected with the internal fixed-effects likelihood (IFEL) method (36). Codons subject to episodic diversifying selection were identified with the mixed-effects model of evolution (MEME) method (37). Codons with P values of <0.05 were reported as positively selected codons.
Fast unconstrained Bayesian approximation (FUBAR) was used to rapidly detect negative and positive selection by Bayesian MCMC analyses to robustly account for parameter estimation errors (38). Codons with posterior probabilities of ≥0.9 were reported as being either negatively or positively selected.
Directional positive selection was detected using the directional evolution in protein sequences (DEPS) test (39). For this procedure, the ML trees were combined with the amino acid alignment. Residues with a Bayes factor of >20 were reported as positively selected.
All methods were implemented in the HyPhy package (40), combined with the best-fit model of nucleotide substitution or, in the case of the DEPS test, the best-fit model of protein evolution (see Table S2 in the supplemental material) based on the AIC. The FUBAR analyses were accessed through the Datamonkey webserver (41, 42).
Because of overlapping ORFs in the PB1, PA, M, and NS segments, these analyses were restricted to the nonoverlapping ORFs of PB1, PA, M1, M2, NS1, and NEP. The dN/dS ratios for PB1-F2 and PA-X were biased by the +1 ORF from PB1 or PA and were therefore excluded in the SLAC, IFEL, MEME, and FUBAR analyses.
Nucleotide sequence accession numbers.
Nucleotide sequences presented in this study are available from GenBank under the following accession numbers: CY012104 to CY012111, CY031812, CY033638, CY033639, CY033641 to CY033645, CY034108, CY034109, CY034111 to CY034115, CY035025, CY035027, CY039093, CY039094, CY077825, CY112233 to CY112318, CY112320 to CY112368, CY112396 to CY112411, CY112420 to CY112564, CY112566 to CY112630, CY112632 to CY112972, CY112981 to CY113004, CY113013 to CY113028, CY113037 to CY113109, CY113111 to CY113476, CY113485 to CY113820, CY113829 to CY114348, CY114357 to CY114516, CY116573 to CY116575, CY116587 to CY116591, CY116594, CY116596, CY116600, CY121181, DQ508846 to DQ508850, DQ508852, DQ508853, GQ293081, GQ293082, EU283414, EU597800 to EU597805, GQ293081, GQ293082, HQ166049 to HQ166056, and KC296462 to KC296481. Sequences for PB2, PB1, PA, NP, M, and NS of A/Perth/16/2009 are available from the Global Initiative on Sharing Avian Influenza Data (GiSAID) database under accession numbers EPI272741 to EPI272746.
RESULTS
Data set background.
To study the genotype in relation to the antigenic phenotype throughout the period of circulation of human A(H3N2) influenza viruses, we used a data set comprising 286 full genomes of viruses sampled between 1968 and 2011. The antigenic phenotype of each of these viruses was previously determined, and this data set represents all 13 antigenic clusters of viruses (13, 14). Thus far, only the HA1 and NA sequences of these viruses have been studied (13, 15). To extend these studies to the full genome, 284 isolates were sequenced. Sequences of two vaccine/reference strains were obtained from GenBank. Deduced amino acid sequences were aligned, together with the sequences of the two vaccine/reference strains (see Fig. S2 in the supplemental material).
Genomic evolution.
ML trees were inferred to study the nucleotide evolution of all segments (Fig. 1). The ML trees of each segment were color coded based on antigenic clusters (13, 14). All trees displayed a similar topological structure with a typical ladder-like gradual evolution, with rapid replacement of old viruses by newer ones. For the PB2, PA, NP, and NA segments, the early (1968 to 1970) HK68-like viruses were separated from the late (1970 to 1972) HK68-like viruses by a long branch. This was most likely due to cocirculation and reassortment with A(H2N2) viruses in 1969 to 1971 (8).
FIG 1.
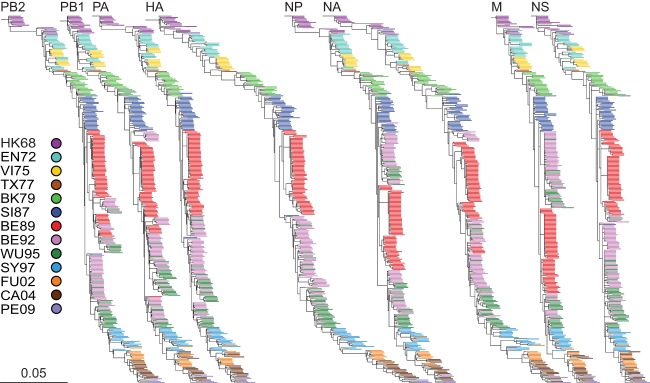
ML trees of all segments of A(H3N2) viruses circulating between 1968 and 2011. The ML trees of PB2, PB1, PA, HA, NP, NA, M, and NS were generated with 286 nucleotide sequences per segment. Scale bars roughly represent 5% of nucleotide substitutions between close relatives. The color coding of viruses is based on the antigenic clusters of HA (13, 14) and is consistent between all trees. Trees were rooted on A/Hong Kong/1/1968.
For all segments, the viruses on the trunk were the ancestors of all variants in future years. However, in some cases, viruses belonging to an antigenic cluster were not seeded by the viruses from the antigenic cluster preceding it. For example, the two TX77-like viruses (1976 to 1977) were seeded by the previously circulating EN72-like (1972 to 1975) viruses rather than by the VI75-like viruses. This was more prominent for the BE89-like, BE92-like, and WU95-like viruses circulating between 1992 and 1998. There were, however, differences in the origins of the different segments. In the PB2, PA, HA, NP, M, and NS trees, the SI87-like viruses were the progenitors of the BE92-like viruses instead of the BE89-like viruses. As a result, the BE89-like viruses clustered away from the trunk in an evolutionarily terminal clade. In contrast, in the PB1 and NA trees, the BE89-like viruses were the progenitors of the BE92-like viruses.
By applying the antigenic cluster colors for HA (13, 14) to all trees of the individual segments, it became clear that the topologies, although similar, were not identical to the clustering observed for HA. These observations strongly suggest frequent reassortment between segments.
Reassortment of A(H3N2) viruses.
To investigate reassortment over the entire genome, a combined approach of tanglegrams and GiRaF analyses (15, 24) was applied (Table 1 and Fig. 2; see Table S4 in the supplemental material). In short, tanglegrams were made to enable visualization of the locations of particular isolates within the HA tree and each of the trees of the other segments. In the absence of reassortment, the twines should connect both trees, in theory, in a seamlessly horizontal way. This was the case for some of the isolates used in this study, but not for all, thus suggesting reassortment between the segments. To explore whether these were indeed reassortment events, multiple trees per segment were analyzed for incompatible splits in each tree pair by using the GiRaF program. We performed 50 independent GiRaF analyses on 50 independent MrBayes runs per segment. Reassortment events found in ≥50% of the 50 independent GiRaF runs are indicated in Table 1. The 50% cutoff was chosen arbitrarily. The events found in 100% of the 50 independent GiRaF runs and that included the HA segment are indicated with asterisks in Table 1 and depicted on the tanglegrams as bold twines in Fig. 2. Numbers in Fig. 2 correspond to the numbers in Table 1.
TABLE 1.
Reassortment events between segments of A(H3N2) viruses circulating between 1968 and 2011, analyzed with GiRaFa
| Eventb | %c | Yr of isolation | Cluster | Segment(s) involvedd |
|
|---|---|---|---|---|---|
| Virus 1 | Virus 2 | ||||
| 1 | 72 | 1968 | HK68 | (HA), PB2 | NS |
| 2 | 68 | 1970 | HK68 | HA, PB2 | PA |
| 3 | 56 | 1977 | VI75 | HA, (PA) | M, (NA) |
| 4 | 74 | 1982 | BK79 | NA | NS |
| 5* | 100 | 1992–1993 | BE92 | HA, M, NP, PA | PB2 |
| 6 | 90 | 1993 | BE92 | NA, (NS), PB1 | NP |
| 7 | 88 | 1993 | BE92 | HA, NS, PB2 | PA |
| 8 | 78 | 1993 | BE92 | HA | PA |
| 9 | 78 | 1993 | BE92 | HA, PA, PB2 | NA |
| 10 | 56 | 1994–1996 | BE92 | HA | M, PA |
| 11* | 100 | 1994, 1996 | BE92 | HA, PA, PB2 | NP |
| 12 | 98 | 1995 | BE92 | (M), NS | PB2 |
| 13 | 68 | 1995 | BE92 | HA, NA | M, (NP) |
| 14* | 100 | 1996 | BE92 | HA | M, NP, PB1, PB2 |
| 15* | 100 | 1992–2011 | BE92-end | HA, M, NP | NA, PB1 |
| 16* | 100 | 1992–2011 | BE92-end | HA, NP, NS | NA |
| 17 | 84 | 1993–2011 | BE92-end | HA, M, NP | PB1 |
| 18* | 100 | 1994–2011 | BE92-end | HA | M |
| 19 | 90 | 1992–1997 | BE92/WU95 | HA, NP, PA | PB1 |
| 20* | 100 | 1993 | BE92/WU95 | HA, M, NP | NS, (PB2) |
| 21* | 100 | 1993 | BE92/WU95 | HA, (PB2) | (NA), NP, (PA) |
| 22* | 100 | 1993–1994 | BE92/WU95 | HA, M, NP | PA |
| 23* | 100 | 1993–1994 | BE92/WU95 | HA, NS, PB2 | NA |
| 24* | 100 | 1993–1994 | BE92/WU95 | HA, NS, PB2 | NA |
| 25 | 54 | 1993–1994 | BE92/WU95 | HA, NS, PB2 | PB1 |
| 26 | 86 | 1993–1996 | BE92/WU95 | NA, PA, PB1 | NP |
| 27 | 84 | 1993–1996 | BE92/WU95 | NP | (NS), (PB1), PB2 |
| 28 | 72 | 1993–1996 | BE92/WU95 | HA, NS, PB2 | NP |
| 29* | 100 | 1993–1997 | BE92/WU95 | HA, M, NP | PB2 |
| 30* | 100 | 1993–1997 | BE92/WU95 | HA, M, NP | PB2 |
| 31 | 92 | 1994–1997 | BE92/WU95 | M, NS, PA | PB2 |
| 32* | 100 | 1995–1996 | BE92/WU95 | (HA), M, NA, PA, PB1, PB2 | NP |
| 33* | 100 | 1995–1996 | BE92/WU95 | HA, NS, PB1 | M, NP, PB2 |
| 34* | 100 | 1995–1997 | BE92/WU95 | HA, M, NS, PA | PB2 |
| 35 | 100 | 1993 | WU95 | ||
| 36 | 96 | 1995 | WU95 | HA, M | NP, PB1, PB2 |
| 37* | 100 | 1995–1996 | WU95 | M, NP, (PA) | NA, NS |
| 38 | 98 | 1996 | WU95 | HA, (NA) | M, NP, PA |
| 39 | 50 | 1996 | WU95 | HA | (M), NP, PA |
| 40* | 100 | 1996–1997 | WU95 | M | PB1 |
| 41 | 100 | 1996–1997 | WU95 | NA, PB1 | (NP), M, (PA) |
| 42* | 100 | 1997 | WU95 | (HA), PA, PB2 | M, NA, NP, PB1 |
| 43* | 100 | 1997 | WU95 | (HA), M, (NA), NP, PB2 | PA |
| 44* | 100 | 1997 | WU95 | HA, (M) | NP, (PB1) |
| 45 | 100 | 1997–1998 | WU95 | M, NP, PA | PB2 |
| 46* | 100 | 1997–1998 | WU95 | HA, PB2 | NA, NP, PB1 |
| 47* | 100 | 1998 | WU95 | HA, (M) | (NA), NP, PA |
| 48 | 100 | 1995–2011 | WU95-end | M, NA | PB1 |
| 49 | 72 | 1996–2011 | WU95-end | (HA) | (PA), (PB1) |
| 50 | 68 | 1996–2011 | WU95-end | NA, PB1, PB2 | PA |
| 51* | 100 | 1999 | SY97 | HA | NA |
| 52 | 54 | 2001 | SY97 | (M), NP | PB2 |
| 53 | 76 | 2000–2001 | SY97 | ||
| 54* | 100 | 2003 | FU02 | HA | M, NA, NP, NS, PA, PB1, PB2 |
| 55* | 100 | 2002–2011 | FU02-end | HA | M, NP, PA, PB1 |
| 56 | 90 | 2005 | CA04 | HA | NP |
| 57* | 100 | 2006 | CA04 | HA, PA | M, PB1 |
| 58* | 100 | 2005–2011 | CA04-end | HA, PB2 | M, PB1 |
| 59 | 100 | 2007–2011 | CA04-end | M, PB1 | (NA), (NP), PB2 |
Persistent reassortment events are shown in bold. Details on isolates involved in the reassortment events can be found in Table S4 in the supplemental material. *, events with a support level of 100% and involving HA are depicted as bold twines in the tanglegrams (Fig. 2).
Event numbering corresponds to that in Fig. 2.
Percentage of reassortment events observed in 50 independent GiRaF analyses of 50 independent MrBayes runs per segment.
Involved segments with a support level of ≥75% of the runs are indicated in parentheses.
FIG 2.

Reassortment events between segments of A(H3N2) viruses circulating between 1968 and 2011. Tanglegrams are displayed with the ML HA tree on the left side and the mirrored trees of PB2 (A), PB1 (B), PA (C), NP (D), NA (E), M (F), and NS (G) on the right side. Twines between both trees are color coded according to the antigenic clusters of HA (see the legend to Fig. 1). GiRaF was used to detect reassortment events between all segments. Reassortment events with a support of 100% between HA and any other segment are depicted as bold twines, and numbers correspond to reassortment events in Table 1. The arrows indicate the introduction of new segments by reassortment into the population that persisted until the last sampled isolate.
Reassortment events during circulation of the HK68-like, VI75-like, BK79-like, BE92-like, WU95-like, SY97-like, FU02-like, CA04-like, and PE09-like viruses were identified by GiRaF analysis, although most did not persist over time. Reassortment was found for all eight segments, although the frequency of reassortment of the individual segments varied. The majority of these reassortment events occurred between viruses from one antigenic cluster (Table 1, events 1 to 14, 35 to 47, 51 to 54, 56, and 57), whereas between 1992 and 1997, reassortment events comprised viruses from multiple antigenic clusters, i.e., BE92-like and WU95-like viruses (events 19 to 34). Apart from nonpersistent reassortment events, several persistent reassortment events were established during the circulation of BE92-like (events 15 to 18), WU95-like (events 48 to 50), FU02-like (event 55), and CA04-like (events 58 and 59) viruses. No support for reassortment was found during circulation of the EN72-like, SI87-like, and BE89-like viruses. It should be noted that reassortment between highly similar sequences is likely to be missed. Similarly, discordance in phylogenies due to high similarity of some sequences can result in an under- or overestimation of reassortment events.
We investigated whether the timing of persistent reassortment coincided with antigenic cluster transitions. From our GiRaF analysis, the only cluster transition that was linked to a persistent reassortment event was the SY97-to-FU02 antigenic cluster transition (event 55) (Fig. 2 and Table 1). Persistent reassortment events during circulation of BE92-like viruses were detected in late 1992, while the first BE92-like viruses were isolated in the beginning of 1992. The first WU95-like viruses were isolated in 1993, while the persistent reassortment events were not detected until late 1995. Similarly, persistent reassortment events for CA04-like viruses were only detected in 2005.
In agreement with the GiRaF results, visual inspection of the tanglegrams revealed that the early viruses (and their ancestors) of each antigenic cluster were similarly positioned in each of the ML trees, with an exception for the reported reassortment event of SY95-FU02.
Time of circulation of the MRCA of each antigenic cluster.
We further studied reassortment in correlation with antigenic change in HA by estimating the time of circulation of the MRCA of each segment for viruses from each antigenic cluster (Fig. 3). For the HA segment, the time of circulation of the MRCA roughly corresponds to the sample date of the first isolated virus of each antigenic cluster.
FIG 3.
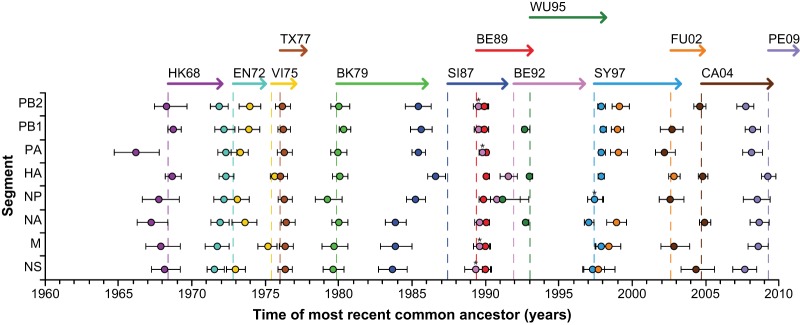
Time of circulation of the MRCA of A(H3N2) viruses of each antigenic cluster. The time of circulation of the MRCA of each genomic segment is shown. The values shown represent the means (spheres) and 95% highest posterior density intervals (error bars) for the times of circulation of the MRCAs estimated across trees sampled using Bayesian MCMC analyses. Dashed lines show the date of the first sampled isolate of each antigenic cluster. Arrows show the time span from the first sampled isolate until the last sampled isolate of the data set for each antigenic cluster. Asterisks represent two data points on top of each other (i.e., BE89/WU95 and SY97/FU02). Color coding was done according to the antigenic clusters of HA (see the legend to Fig. 1).
At the onset of the 1968 H3N2 influenza pandemic, the PB1 and HA segments were newly acquired through reassortment (5, 43–45). Similarly, our BEAST analyses showed that the MRCA of the HA and PB1 segments circulated at the onset of the 1968 H3N2 influenza pandemic. The MRCA of the PA segment circulated 2 years before this time, most likely because PA was introduced from the A(H2N2) virus lineage that circulated at that time.
The MRCA of each segment of the EN72-like viruses originated in 1972, with the onset of the antigenic cluster. This was indicative of a genomewide selective sweep (Fig. 3). GiRaF found no support for reassortment during circulation of EN72-like viruses (Fig. 2 and Table 1).
During circulation of the VI75-like viruses, the MRCA of the HA and M segments originated in 1975, while the other segments had MRCAs that circulated in 1973 and 1974 (Fig. 3). This signifies a selective sweep for the HA and M segments, while the genetic diversity of the other segments was likely maintained by reassortment.
Strikingly, the EN72-like viruses, not the VI75-like viruses, seeded the TX77-like viruses (Fig. 1). Neither GiRaF nor the time of circulation of the MRCAs gave an indication of reassortment for TX77-like viruses; however, the data set used comprised only two TX77-like viruses. The transition to BK79-like viruses coincided with a genomewide selective sweep (Fig. 3).
Little information was available on the A(H3N2) viruses circulating between 1987 and 1992 (SI87-like viruses). The MRCA of the HA segment of SI87-like viruses circulated around 1986 to 1987, while the NA, M, and NS segments had MRCAs that circulated before that time (1984), indicative of reassorted NA, M, and NS segments.
In agreement with previous studies (46, 47), there was evidence for reassortment between BE89- and BE92-like viruses. The PB2, PB1, PA, NA, M, and NS segments of the BE92-like viruses shared roughly the same times of their MRCAs as those of the BE89-like viruses, indicating that these segments originated from BE89-like viruses through reassortment. This is in contrast to the HA segment, which underwent a selective sweep (Fig. 3).
For the WU95-like viruses, the times of MRCAs of the PB2, PA, M, and NS segments remained the same as those of the BE89-like viruses, also indicative of reassortment, while the PB1, HA, and NA segments underwent a selective sweep (Fig. 3). Three persistent reassortment events were reported by GiRaF, all involving the HA segment. GiRaF analyses further suggested that reassortment events of A(H3N2) viruses occurred particularly frequently during the circulation of BE92- and WU95-like viruses (Fig. 2 and Table 1). The increase in reassortment rates during the circulation of the BE89-like, BE92-like, and WU95-like viruses could be explained partially by cocirculation: BE89-like viruses circulated from mid-1989 until early 1993, BE92-like viruses circulated from late 1991 until late 1996, and WU95-like viruses circulated from early 1993 until early 1998.
The SY97-like-to-FU02-like virus antigenic cluster transition has been well described and coincided with reassortment (10, 48). Our BEAST analyses showed an MRCA of the HA segment that circulated around 2002, while the other segments had MRCAs that circulated before that time (1998 to 1999) (Fig. 3). This is indicative of a selective sweep for the HA segment, while the genetic diversity of the other segments was retained. Next to one nonpersistent reassortment event, GiRaF found a persistent reassortment event involving the HA segment of a different virus lineage compared to that of the PB1, PA, NP, and M segments. Moreover, a large genetic distance was seen between SY97-like and FU02-like viruses, which was represented by a long branch separating the two clades in the HA ML tree, and this is in line with a previous study (49).
The transition of FU02-like to CA04-like viruses coincided with a selective sweep for the PB2, HA, NA, and NS segments according to the BEAST analyses. GiRaF provided evidence of two persistent reassortment events, in which the PB1 and M segments were derived from a virus lineage different from that of the PB2 segment. The PB2 and NS segments have an MRCA that circulated before the MRCA of HA for the PE09-like viruses, suggesting reassortment of the PB2 and NS segments and a selective sweep of the HA segment.
Nucleotide substitution rates of all A(H3N2) open reading frames.
Rates of nucleotide substitution (number of nt substitutions/site/year) for all segments, and the proteins they encode, were estimated using BEAST (Table 2). The PB2, HA, NP, and NA segments each encode single proteins: PB2, HA, NP, and NA. The PB1 segment encodes three proteins: PB1; an N-terminally truncated version of PB1 starting at codon 40 (PB1-N40) (50); and PB1-frame 2 (PB1-F2), expressed through an alternative ORF (51). The PA segment encodes four proteins: PA; PA-X, through a second ORF accessed via ribosomal frameshifting (52); and two N-terminally truncated versions of PA, i.e., PA-N155 and PA-N182 (53). The M and NS segments each individually encode proteins from the colinear transcript: M1 and NS1. Additionally, they encode a second protein through mRNA splicing: M2 and NS2, known as the nuclear export protein (NEP) (54). The HA protein is composed of two subunits that are cleaved by host proteases from their precursor, HA0 (57): HA1, which is the immunogenic section of the HA protein (55, 56), and HA2.
TABLE 2.
Mean rates of substitution for all segments and coding regions of A(H3N2) viruses circulating between 1968 and 2011
| Segment | Region | Mean rate of substitution (10−3 substitutions/site/yr) |
|||
|---|---|---|---|---|---|
| Nucleotidea |
Amino acidb | ||||
| Mean | 95% HPD |
||||
| Lower | Upper | ||||
| PB2 | Full | 2.41 | 2.17 | 2.67 | 1.4 |
| PB1 | Full | 2.54 | 2.31 | 2.78 | 0.8 |
| PB1-N40 | 2.54 | 2.30 | 2.78 | 0.8 | |
| PB1-F2 | 3.67 | 2.81 | 4.58 | 9.5 | |
| PA | Full | 2.28 | 2.05 | 2.52 | 1.8 |
| PA-N155 | 2.39 | 2.12 | 2.68 | 1.1 | |
| PA-N182 | 2.41 | 2.12 | 2.71 | 1.2 | |
| PA-X | 1.58 | 0.98 | 2.20 | 1.6 | |
| HA | HA0 | 3.99 | 3.63 | 4.38 | 10.8 |
| HA1 | 4.84 | 4.32 | 5.38 | 14.9 | |
| HA2 | 3.12 | 2.63 | 3.64 | 1.4 | |
| NP | Full | 2.51 | 2.21 | 2.82 | 2.9 |
| NA | Full | 3.27 | 2.93 | 3.63 | 9.1 |
| M | Full | 2.07 | 1.75 | 2.40 | |
| M1 | 1.88 | 1.55 | 2.22 | 0.9 | |
| M2 | 2.63 | 1.94 | 3.33 | 1.4 | |
| NS | Full | 2.49 | 2.13 | 2.85 | |
| NS1 | 2.48 | 2.10 | 2.88 | 2.2 | |
| NEP | 2.32 | 1.79 | 2.86 | 0.5 | |
The mean rate of nucleotide substitution per site per year was estimated using BEAST.
Genetic distance to A/Hong Kong/1/1968 was calculated from the phylogenetic tree and was plotted as a function of time. The mean rate of amino acid substitution per site per year was inferred from the linear slope (Fig. 4).
The mean rates of nucleotide substitution of the individual segments varied from 2.07 × 10⁻³ to 3.99 × 10⁻³ nt substitutions/site/year, with the highest rates of nucleotide substitution for the major glycoproteins HA and NA and the lowest rate for the M segment. Multiple ORFs carried by the same segment showed different rates of nucleotide substitution. The PB1 segment and the PB1-N40 ORF shared the same rate (2.54 × 10⁻³ nt substitutions/site/year), in contrast to PB1-F2, which showed a rate comparable to those of the HA and NA segments (3.67 × 10⁻³ nt substitutions/site/year). PA-X displayed a much lower rate (1.58 × 10⁻³ nt substitutions/site/year) than that of the PA segment (2.28 × 10⁻³ nt substitutions/site/year). Both PA-N155 and PA-N182 had a rate comparable to that of the PA segment. Upon comparing the two HA subunits, we noted that HA1 displayed a higher rate than HA2 (4.84 × 10⁻³ and 3.12 × 10⁻³ nt substitutions/site/year).
Amino acid substitution rates of all A(H3N2) proteins.
Linear regression plots for the year of sampling versus amino acid distance to A/Hong Kong/1/1968 in the ML tree were generated (Fig. 4), and the rates of amino acid substitution were estimated based on the slopes (number of aa substitutions/site/year) (Table 2). The HA1 subunit showed the highest rate of amino acid substitution, whereas the rate for the HA2 subunit was much lower (14.9 × 10⁻³ compared to 1.4 × 10⁻³ aa substitutions/site/year). This was likely due to the fact that HA1 is the major immunogenic region of HA (55, 56). PB1-F2 and NA also displayed high rates of amino acid substitution: 9.5 × 10⁻³ and 9.1 × 10⁻³ aa substitutions/site/year. For all other proteins, rates of amino acid substitution were at least three times lower. Although the differences were minimal, PA had the highest rate of amino acid substitutions of the polymerase complex proteins. Of the M proteins, M2 displayed a higher rate of amino acid substitution than M1 (1.4 × 10⁻³ and 0.9 × 10⁻³ aa substitutions/site/year). The difference between the NS proteins was even larger, with a much higher rate of amino acid substitution for NS1 than for NEP (2.2 × 10⁻³ and 0.5 × 10⁻³ aa substitutions/site/year, respectively). The recently discovered PB1-N40, PA-X, PA-N155, and PA-N182 proteins all showed low rates of amino acid substitution (0.8 × 10⁻³ to 1.2 × 10⁻³ aa substitutions/site/year).
FIG 4.

Rates of amino acid evolution of all segments and ORFs of A(H3N2) viruses. Phylogenetic trees were generated with 286 amino acid sequences for PB2, PB1, PB1-N40, PB1-F2, PA, PA-N155, PA-N182, PA-X, HA0, HA1, HA2, NP, NA, M1, M2, NS1, and NEP. For all A(H3N2) viruses, the amino acid distance of each ORF to A/Hong Kong/1/68 was calculated from the phylogenetic tree and was plotted as a function of time. The color coding of viruses is based on the antigenic clusters of HA and is consistent between all plots (see the legend to Fig. 1). Note that the vertical axes differ between proteins with lower rates of amino acid substitution (four upper rows) and proteins with higher rates of amino acid substitution (two bottom rows).
Most plots illustrated a linear trend, reflecting a constant rate of amino acid substitutions over time. For the HK68-like viruses, a sudden increase in genetic distance to A/Hong Kong/1/1968 for PB2, PA, NP, and, NA was seen, reflecting the long branches also observed in the nucleotide ML trees. Such an increase was also observed for PA at the transition of the BK79-like to SI87-like viruses. For NP, some of the BE89-like, BE92-like, and WU95-like viruses showed a linear trend; however, there was also a large group of BE89-like, BE92-like, and WU95-like viruses that did not accumulate amino acid mutations and shared the same amino acid distance to A/Hong Kong/1/1968. In the NP nucleotide ML tree, these groups reflect two clades, and the viruses that accumulate amino acid mutations are the ancestors of the SY97-like viruses. The M1, M2, NEP, and PA-X proteins did not accumulate amino acid mutations in a constant manner. For NS1, the rate of amino acid substitution decelerated after 1991. This was roughly around the same time that the NS1 gene acquired a stop codon at position 231, resulting in a C-terminally truncated NS1 protein. This premature stop codon, observed in 218 (76%) NS1 sequences, first appeared at the end of 1971 and became fully fixed in late 1991 (see Table S1 in the supplemental material). In addition, two Dutch viruses circulating in 1970 harbored a stop codon at position 221 of NS1, but this stop codon did not become fixed. Premature stop codons were also observed in the PB1-F2 amino acid alignments. Twenty-four (8%) of the PB1-F2 sequences contained an additional stop codon, at position 9, 12, 26, 35, 58, 64, 80, or 88. Of the C-terminally truncated proteins, 19 (7%) were more than 78 codons long and still functional (58, 59). However, none of these stop codons became fixed over time. One PA-X sequence contained a stop codon at position 42.
Selection pressures.
The degree of natural selection acting on all ORFs was estimated by calculating the overall dN/dS and the mean dN/dS for the internal and external branches, as estimated using SLAC (35) (Table 3).
TABLE 3.
Selection pressures and positively and negatively selected codons of all coding regions of A(H3N2) viruses circulating between 1968 and 2011
| Coding region | No. of codons |
dN/dSa |
No. of selected sites (% of codons) |
||||||
|---|---|---|---|---|---|---|---|---|---|
| Overall | Internal | External | Internal/external | Positively selectede |
Negatively selected (FUBAR)b | ||||
| FUBARb | MEMEc | DEPSd | |||||||
| PB2 | 759 | 0.077 | 0.063 | 0.088 | 0.716 | 1 | 0 | 2 | 628 (83) |
| PB1 | 666 | 0.075 | 0.058 | 0.086 | 0.674 | 0 | 1 | 0 | 459 (69) |
| PB1-N40 | 635 | 0.074 | 0.059 | 0.084 | 0.702 | 0 | 1 | 0 | 431 (68) |
| PB1-F2f | ND | ND | ND | ND | ND | ND | ND | 2 | ND |
| PA | 654 | 0.085 | 0.070 | 0.095 | 0.737 | 0 | 4 | 1 | 435 (67) |
| PA-N155 | 500 | 0.094 | 0.084 | 0.100 | 0.840 | 0 | 3 | 1 | 327 (65) |
| PA-N182 | 473 | 0.097 | 0.090 | 0.102 | 0.882 | 0 | 3 | 1 | 306 (65) |
| PA-Xf | ND | ND | ND | ND | ND | ND | ND | 0 | ND |
| HA0 | 566 | 0.341 | 0.301 | 0.370 | 0.814 | 10 | 13 | 17 | 274 (48) |
| HA1 | 329 | 0.466 | 0.406 | 0.515 | 0.788 | 10 | 12 | 15 | 149 (45) |
| HA2 | 221 | 0.123 | 0.093 | 0.142 | 0.655 | 0 | 0 | 1 | 120 (54) |
| NP | 498 | 0.098 | 0.109 | 0.091 | 1.198 | 0 | 1 | 0 | 315 (63) |
| NA | 469 | 0.292 | 0.311 | 0.277 | 1.123 | 2 | 6 | 11 | 233 (50) |
| M1 | 229 | 0.058 | 0.078 | 0.043 | 1.814 | 0 | 1 | 0 | 132 (58) |
| M2 | 73 | 0.391 | 0.264 | 0.481 | 0.549 | 0 | 0 | 0 | 7 (10) |
| NS1 | 157 | 0.352 | 0.350 | 0.353 | 0.992 | 0 | 1 | 3 | 33 (21) |
| NEP | 40 | 0.074 | 0.055 | 0.087 | 0.632 | 0 | 0 | 0 | 11 (28) |
Calculated by SLAC.
Posterior probability of ≥0.9.
P value of <0.05.
Bayes factor of >20.
Information on the specific positively selected residues and their functions can be found in Table S5 in the supplemental material.
ND, coding regions of PB1-F2 and PA-X were excluded from the codon-based analyses (SLAC, FUBAR, and MEME).
The membrane proteins HA, NA, M2, and NS1 showed relatively high overall dN/dS values (0.341, 0.292, 0.391, and 0.352, respectively) compared to those of the other proteins, which ranged from 0.058 to 0.098. As expected, the HA1 subunit revealed a relatively higher overall dN/dS than that of HA2 (0.466 for HA1 and 0.123 for HA2). The PB1-N40, PA-N155, and PA-N182 proteins had relatively low overall dN/dS values that were comparable to those of the full PB1 and PA ORFs.
Comparing the mean internal and mean external dN/dS values provides a ratio (internal dN/dS to external dN/dS) that gives an indication of whether there is an excess of nonsynonymous mutations that are eventually removed from the virus population by purifying selection (ratio of <1) or kept in the population by positive selection (ratio of >1). The full and N-terminally truncated polymerases, HA, M2, and NEP, showed ratios of <1, indicative of purifying selection. NS1 had comparable external and internal dN/dS values. The NP, NA, and M1 proteins showed ratios that were >1, suggestive of positive selection.
Detection of positive and negative selection by FUBAR.
Negatively and positively selected codons were estimated by the FUBAR method, which detects pervasive diversifying or purifying selection by Bayesian MCMC analyses (36) (Table 3; see Table S5 in the supplemental material). All ORFs contained an abundance of negatively selected codons. For PB1, PA, and NP, 63 to 69% of the codons were negatively selected. This percentage was higher for PB2 (83%) and slightly lower for HA, NA, and M1 (48%, 50%, and 58%, respectively). M2, NS1, and NEP contained the lowest percentages of negatively selected codons (10%, 21%, and 28%, respectively). Positive selection was found only for PB2, HA, and NA. All eight positively selected codons of HA were located within antigenic sites (55, 56). Two codons within NA were positively selected: codon 267, which is not surface exposed, and a codon in antigenic site C (60) (codon 370).
Detection of positive and negative selection by MEME.
MEME was used to identify not only fixed but also more sporadic positively selected codons (37) (Table 3; see Table S5 in the supplemental material). MEME found positively selected codons in PB1, PA, HA, NP, NA, M1, and NS1. Four codons were selected in PA, among which one (codon 87) is located in the endonuclease activity region (61). The other three (codons 278, 487, and 550) are located in the region involved in PB1 binding (61). Of the 13 codons that were selected in HA, 12 were selected in HA1 and almost solely located within antigenic sites (55, 56). One codon was selected in NP (codon 54). In NA, six codons were selected, among which three are located in antigenic sites (60) (codons 199, 338, and 401). MEME identified codon 166 of M1, which is located in the C-terminal domain (61), and codon 65 of NS1.
Directional positive selection.
Directional positive selection was detected with the DEPS program, which helps in detecting selective sweeps (39) (Table 3; see Table S5 in the supplemental material). DEPS identified codons in PB2, PB1-F2, PA, HA, NA, and NS1. In the PB2 segment, codon 553, involved in cap binding (62, 63) and located in the RNA binding domain (61), and codon 679, interacting with PB1 (62, 63) and located in the importin binding domain (61), were positively selected. Both codons interact with NP (62, 63). In PB1-F2, codons 23 and 90 were positively selected. Codon 311, associated with PB1 binding (61), was positively selected in PA. There were 17 positively selected codons in HA, of which 15 were located in HA1. Twelve of the codons in HA1 are located in antigenic sites (55, 56). The positively selected codon in HA2 (codon 538) is located in the transmembrane anchor domain. Eleven positively selected codons were found in NA: three in the stalk region (codons 46, 52, and 56) and eight in the globular head, of which three are located within antigenic site C (60) (codons 328, 334, and 370). NS1 had three codons that were positively selected (codons 56, 84, and 129). In addition to FUBAR, MEME, and DEPS analyses, the data sets were analyzed with IFEL (see Table S5). IFEL detects negatively and positively selected codons along internal branches (36).
DISCUSSION
In this study, the relationship of genetic evolution to antigenic change spanning the entire period of A(H3N2) virus circulation was studied for the first time. We analyzed 286 full genomes scattered over 43 years of A(H3N2) virus evolution. The antigenic evolution based on hemagglutination inhibition data has been studied extensively for these viruses (13, 14). These antigenic properties were used as a basis for looking at genomic evolution and reassortment patterns of the whole genome between viruses belonging to the same antigenic cluster as well as between viruses belonging to different antigenic clusters.
The general topologies of the ML trees were similar for each segment, displaying the typical ladder-like gradual evolution previously described for HA1 (64). However, differences could be seen in reassortment patterns, clustering of viruses, evolutionary rates, and MRCAs upon comparison of their phylogenies. An asynchronous and slightly slower evolution of NA than of HA was observed, which is consistent with previous studies (15). In comparing HA with PB2, PB1, PA, NP, M, and NS, even larger differences were seen in the rate of nucleotide evolution.
Intrasubtypic reassortment of the eight segments of human A(H3N2) viruses has been studied for New York State viruses circulating between 1999 and 2004 (48), 1992 and 2005 (10), and 1997 and 2005 (9) and for German isolates sampled between 1998 and 2005 (65). The studies showed that the evolution of the A(H3N2) virus was not so much determined by adaptive processes (9) but was shaped by frequent reassortment (9, 10, 48, 65), cocirculation (9, 48) and persistence (10, 48) of clades, virus migration (9), and selective sweeps (10). The data sets of these studies contain data mostly for recent A(H3N2) viruses, and studies that included earlier isolates are sparse. Reassortment of early A(H3N2) viruses and A(H2N2) viruses circulating between 1957 and 1972 was investigated, providing evidence of cocirculation of A(H2N2) and A(H3N2) viruses (8), but no full genome studies on A(H3N2) viruses circulating between 1972 and 1992 have been published. The data set used in the present study contains isolates, mostly of European origin, sampled from each consecutive season between 1968 and 2011 whose antigenic properties were determined previously (13, 14). Although North America and Europe are both in the Northern Hemisphere and therefore use the same vaccine composition, the viruses between these regions could still potentially evolve independently. Consequently, this data set may not be comparable to the American data sets, nor does it represent the A(H3N2) virus worldwide. However, this data set does offer the opportunity to study reassortment in relation to antigenic change spanning the entire period of A(H3N2) virus circulation.
A combined approach of tanglegrams color coded by antigenic cluster and GiRaF analysis (24) was applied to map reassortment events. In addition, a methodology similar to that of Rambaut et al. (10) was used, but now investigating the time of circulation of the MRCA of each segment per antigenic cluster (13, 14). The tanglegrams showed abundant clustering differences suggestive of frequent reassortment over time. This was confirmed by GiRaF analyses, which revealed reassortment events particularly during the circulation of BE92-like and WU95-like viruses, in agreement with our previous study (15). A lower incidence of reassortment than that in our previous study was detected. This analysis was more stringent because GiRaF was applied to all combinations of segments rather than to HA and NA alone (24). Several reassortment events persisted, mostly in more recent years, suggesting that these reassortment events aided in increasing genetic diversity of the virus to improve fitness or to evade population immunity. However, most reassortment events were nonpersistent, indicating that reassortment is rarely beneficial enough to reach fixation.
Rates of nucleotide substitution estimated for A(H3N2) viruses were lower overall than rates previously reported by others (9, 10). However, the previous data sets spanned shorter time frames (1997 to 2005 and 1992 to 2005, respectively) and contained viruses sampled from North America, whereas our data set contained mostly European samples. Compared to a study of the polymerases of A(H3N2) viruses isolated between 1968 and 1997 (66) or the HA proteins of A(H3N2) viruses isolated between 1968 and 1986 (67), rates of amino acid substitution reported here were substantially higher. Estimated rates of amino acid substitution for PB1 and PB1-F2 were comparable to those in a different study, in which the authors describe a substantially elevated rate of amino acid substitution for PB1-F2 compared to PB1 (68). However, in contrast to our results, they found only a slightly elevated rate of nucleotide substitution for PB1-F2 compared to PB1 (68). The authors explained the increase in the rate of amino acid substitution in PB1-F2 via the frameshift relative to PB1 (68). A study that investigated different influenza virus strains [including human A(H3N2) viruses] showed that genetic and functional diversity of PB1-F2 is needed to support replication efficiency and virulence (69). Similar to PB1-F2, PA-X is located in the frame +1 relative to PA, but no increase of amino acid substitutions was detected. The rate of nucleotide substitution of PA-X was the lowest of all segments/ORFs. It was described for human influenza viruses that there is an increase in nonsynonymous substitutions in the PA ORF spanning the +1 PA-X ORF. This is indicative of selective constraints in the PA-X protein and hence of functional importance (70).
The PB1-F2 alignment revealed that 8% of all sequences exhibited a stop codon, although none of these stop codons were fixed over time. In NS1, 76% of all sequences acquired a stop codon at position 231, which is a lower percentage than that found in other studies (91%) (71). This stop codon started to appear at the end of 1971 and became fully fixed by late 1991, leaving the NS1 protein functional, since its N-terminal nuclear localization signal was retained (59) and can still interact with one of the essential components of the machinery for the 3′-end processing of cellular pre-mRNAs (58).
M2, NS1, HA, and NA had the highest dN/dS values (0.391, 0.352, 0.341, and 0.292, respectively). M2, HA, and NA are the surface glycoproteins and are thus accessible to antibodies, which could partially explain the relatively higher overall dN/dS values than those of the other proteins. Although it is surface exposed, M2 was shown to be almost nonimmunogenic (72). Five amino acid residues in the M2 ion channel have been linked to adamantane resistance in A(H3N2) viruses (73, 74). Although not detected as being positively selected for, there was a serine-to-asparagine change in one of these amino acid residues (codon 31) that was starting to appear in 2005 and became fixed in the population. NS1 plays a role in evading the innate and adaptive immune responses (75–77), which may explain its relatively high dN/dS value. The overall dN/dS results were in agreement with those of previous studies (78, 79).
HA contained the largest number of positively selected codons (29 codons), most prominently located in the HA1 subunit (26 codons), 22 of which are located in antigenic sites (55, 56). For NA, 19 sites were positively selected, 7 of which are located within antigenic sites (60). Both HA and NA are under antibody-mediated selection (55, 80–82), and at least some of the positively selected sites were likely due to immune evasion. It is likewise probable that some of the mutations, while not directly needed for evasion of the immune system, restore possible loss of viral fitness due to mutations that cause antigenic change. Although it is not surface exposed, PA has a large number of positively selected sites. While little is known for most mutations in the polymerases, these mutations in PA may possibly be responsible for fine-tuning replication. In contrast to the predominant humoral immune response-related drift of HA and NA, drift in internal proteins such as NP is linked to escape from cytotoxic T-lymphocyte immunity (83–85). Codon 146 of NP was found to be positively selected and has changed the T-cell epitope NP146–154 (TTYQRTRAL) (86) with the T146A substitution, which was fully fixed in the population in 2001.
There are several hypotheses to explain the mechanism that governs antigenic cluster transitions. One theory involves neutral networks in which phenotypically neutral mutations occur in the HA. Although these mutations do not have a direct impact on the antigenic phenotype, they might allow for subsequent mutations that do influence the antigenic properties of the virus (87). Other studies showed that a new HA lineage was acquired at the time of the SY97-to-FU02 antigenic change (10, 48). Also according to our GiRaF analysis, this cluster transition was linked to a persistent reassortment event (event 55) (Fig. 2 and Table 1). Based on our data set, there was no support for other persistent reassortment events linked to any of the other antigenic cluster transitions. Just recently, the molecular basis of antigenic drift was determined for human A(H3N2) viruses. From 1968 to 2003, antigenic change was caused mainly by single amino acid substitutions at seven positions around the receptor binding site (88). No clear correlation between antigenic cluster transition and positively selected codons in proteins other than HA was found. Some positively selected codons in PB2 (codon 697), PB1-F2 (codon 90), PA (codons 277, 311, and 437), NP (codon 146), and NA (codons 43, 46, 52, 56, 127, 199, 253, 267, 308, 328, 334, 338, 339, 370, 372, 401, and 437) were fixed (for a certain time) in the population. Codon 146 in NP is located in a T-cell epitope (86), and codons 199, 328, 334, 338, 339, 370, and 401 in NA are all located within antigenic sites (60). Future functional studies that investigate whether these mutations result in antigenic change due to immune pressure or change functional compatibility with HA, such as the HA-NA balance (89), will be interesting.
In summary, we have analyzed the evolutionary genetics of the full genomes of A(H3N2) viruses isolated between 1968 and 2011 and compared it to the antigenic evolution of HA. Reassortment of all eight segments occurred throughout almost the entire period of influenza A(H3N2) virus circulation, although persistent reassortment events were mostly found in recent years. Between 1987 and 1998, there was an increase in reassortment events, an increase or decrease in accumulation of amino acid substitutions of certain genes, and the acquisition of a stop codon in NS1. In addition, different antigenic lineages cocirculated during this time. These findings imply that the viruses used multiple mechanisms to increase virus diversity, presumably to improve fitness and/or to evade the host immune responses. This collection of viruses, together with the genetic and antigenic data, can now be used to carefully study genotypic and phenotypic relationships throughout the period of circulation of A(H3N2) viruses. To fully understand the dynamics of A(H3N2) virus evolution, future research of such extensive data sets should also focus on the functional and antigenic properties of proteins other than HA, using serological assays and antigenic cartography methods (90).
Supplementary Material
ACKNOWLEDGMENTS
This work was supported by an NWO-VICI grant and by NIH contract HHSN266200700010C. This project was also funded in part by federal funds from the National Institute of Allergy and Infectious Diseases, National Institutes of Health, Department of Health and Human Services, under contract HHSN272200900007C.
We gratefully thank G. J. D. Smith for stimulating discussions and technical assistance, N. Nagarajan and C. Kingsford for technical assistance with GiRaF, S. van der Vliet and O. Vuong for technical assistance in the lab, and B. Kalverda for critically reading the manuscript. We also thank the following members of the JCVI viral sequencing and assembly team for their technical assistance: T. Stockwell, E. Wester, K. Geer, D. Busam, and N. Fedorova.
Footnotes
Published ahead of print 26 December 2013
Supplemental material for this article may be found at http://dx.doi.org/10.1128/JVI.02163-13.
REFERENCES
- 1.Fouchier RA, Munster V, Wallensten A, Bestebroer TM, Herfst S, Smith D, Rimmelzwaan GF, Olsen B, Osterhaus AD. 2005. Characterization of a novel influenza A virus hemagglutinin subtype (H16) obtained from black-headed gulls. J. Virol. 79:2814–2822. 10.1128/JVI.79.5.2814-2822.2005 [DOI] [PMC free article] [PubMed] [Google Scholar]
- 2.Tong S, Li Y, Rivailler P, Conrardy C, Castillo DA, Chen LM, Recuenco S, Ellison JA, Davis CT, York IA, Turmelle AS, Moran D, Rogers S, Shi M, Tao Y, Weil MR, Tang K, Rowe LA, Sammons S, Xu X, Frace M, Lindblade KA, Cox NJ, Anderson LJ, Rupprecht CE, Donis RO. 2012. A distinct lineage of influenza A virus from bats. Proc. Natl. Acad. Sci. U. S. A. 109:4269–4274. 10.1073/pnas.1116200109 [DOI] [PMC free article] [PubMed] [Google Scholar]
- 3.Li Q, Sun X, Li Z, Liu Y, Vavricka CJ, Qi J, Gao GF. 2012. Structural and functional characterization of neuraminidase-like molecule N10 derived from bat influenza A virus. Proc. Natl. Acad. Sci. U. S. A. 109:18897–18902. 10.1073/pnas.1211037109 [DOI] [PMC free article] [PubMed] [Google Scholar]
- 4.Schild GC, Newman RW, Webster RG, Major D, Hinshaw VS. 1980. Antigenic analysis of influenza A virus surface antigens: considerations for the nomenclature of influenza virus. Comp. Immunol. Microbiol. Infect. Dis. 3:5–18. 10.1016/0147-9571(80)90034-X [DOI] [PubMed] [Google Scholar]
- 5.Scholtissek C, Rohde W, Von Hoyningen V, Rott R. 1978. On the origin of the human influenza virus subtypes H2N2 and H3N2. Virology 87:13–20. 10.1016/0042-6822(78)90153-8 [DOI] [PubMed] [Google Scholar]
- 6.WHO. 2003. Fact sheet number 211. Influenza. WHO, Geneva, Switzerland: http://www.who.int/mediacentre/factsheets/fs211 [Google Scholar]
- 7.Stohr K. 2002. Influenza—WHO cares. Lancet Infect. Dis. 2:517. 10.1016/S1473-3099(02)00366-3 [DOI] [PubMed] [Google Scholar]
- 8.Lindstrom SE, Cox NJ, Klimov A. 2004. Genetic analysis of human H2N2 and early H3N2 influenza viruses, 1957–1972: evidence for genetic divergence and multiple reassortment events. Virology 328:101–119. 10.1016/j.virol.2004.06.009 [DOI] [PubMed] [Google Scholar]
- 9.Nelson MI, Simonsen L, Viboud C, Miller MA, Taylor J, George KS, Griesemer SB, Ghedin E, Sengamalay NA, Spiro DJ, Volkov I, Grenfell BT, Lipman DJ, Taubenberger JK, Holmes EC. 2006. Stochastic processes are key determinants of short-term evolution in influenza A virus. PLoS Pathog. 2:e125. 10.1371/journal.ppat.0020125 [DOI] [PMC free article] [PubMed] [Google Scholar]
- 10.Rambaut A, Pybus OG, Nelson MI, Viboud C, Taubenberger JK, Holmes EC. 2008. The genomic and epidemiological dynamics of human influenza A virus. Nature 453:615–619. 10.1038/nature06945 [DOI] [PMC free article] [PubMed] [Google Scholar]
- 11.Wolf YI, Viboud C, Holmes EC, Koonin EV, Lipman DJ. 2006. Long intervals of stasis punctuated by bursts of positive selection in the seasonal evolution of influenza A virus. Biol. Direct 1:34. 10.1186/1745-6150-1-34 [DOI] [PMC free article] [PubMed] [Google Scholar]
- 12.Schild GC, Oxford JS, Dowdle WR, Coleman M, Pereira MS, Chakraverty P. 1974. Antigenic variation in current influenza A viruses: evidence for a high frequency of antigenic ‘drift' for the Hong Kong virus. Bull. World Health Organ. 51:1–11 [PMC free article] [PubMed] [Google Scholar]
- 13.Smith DJ, Lapedes AS, de Jong JC, Bestebroer TM, Rimmelzwaan GF, Osterhaus AD, Fouchier RA. 2004. Mapping the antigenic and genetic evolution of influenza virus. Science 305:371–376. 10.1126/science.1097211 [DOI] [PubMed] [Google Scholar]
- 14.de Jong JC, Donker GA, Meijer A, van der Hoek W, Rimmelzwaan GF, Osterhaus AD. 2011. Het influenzaseizoen 2010/2011 in Nederland: het nieuwe A(H1N1)-virus van 2009 blijft actief. Ned. Tijdschr. Med. Microbiol. 19:21–27 [Google Scholar]
- 15.Westgeest KB, de Graaf M, Fourment M, Bestebroer TM, van Beek R, Spronken MI, de Jong JC, Rimmelzwaan GF, Russell CA, Osterhaus AD, Smith GJ, Smith DJ, Fouchier RA. 2012. Genetic evolution of the neuraminidase of influenza A (H3N2) viruses from 1968 to 2009 and its correspondence to haemagglutinin evolution. J. Gen. Virol. 93:1996–2007. 10.1099/vir.0.043059-0 [DOI] [PMC free article] [PubMed] [Google Scholar]
- 16.Zhou B, Wentworth DE. 2012. Influenza A virus molecular virology techniques. Methods Mol. Biol. 865:175–192. 10.1007/978-1-61779-621-0_11 [DOI] [PubMed] [Google Scholar]
- 17.Zhou B, Donnelly ME, Scholes DT, St George K, Hatta M, Kawaoka Y, Wentworth DE. 2009. Single-reaction genomic amplification accelerates sequencing and vaccine production for classical and swine origin human influenza A viruses. J. Virol. 83:10309–10313. 10.1128/JVI.01109-09 [DOI] [PMC free article] [PubMed] [Google Scholar]
- 18.Dugan VG, Chen R, Spiro DJ, Sengamalay N, Zaborsky J, Ghedin E, Nolting J, Swayne DE, Runstadler JA, Happ GM, Senne DA, Wang R, Slemons RD, Holmes EC, Taubenberger JK. 2008. The evolutionary genetics and emergence of avian influenza viruses in wild birds. PLoS Pathog. 4:e1000076. 10.1371/journal.ppat.1000076 [DOI] [PMC free article] [PubMed] [Google Scholar]
- 19.Djikeng A, Halpin R, Kuzmickas R, DePasse J, Feldblyum J, Sengamalay N, Afonso C, Zhang X, Anderson NG, Ghedin E, Spiro DJ. 2008. Viral genome sequencing by random priming methods. BMC Genomics 9:5. 10.1186/1471-2164-9-5 [DOI] [PMC free article] [PubMed] [Google Scholar]
- 20.Hall TA. 1999. BioEdit: a user-friendly biological sequence alignment editor and analysis program for Windows 95/98/NT. Nucleic Acids Symp. Ser. 41:95–98 [Google Scholar]
- 21.Guindon S, Gascuel O. 2003. A simple, fast, and accurate algorithm to estimate large phylogenies by maximum likelihood. Syst. Biol. 52:696–704. 10.1080/10635150390235520 [DOI] [PubMed] [Google Scholar]
- 22.Zwickl DJ. 2006. Genetic algorithm approaches for the phylogenetic analysis of large biological sequence datasets under the maximum likelihood criterion. Ph.D. dissertation. The University of Texas at Austin, Austin, TX [Google Scholar]
- 23.Darriba D, Taboada GL, Doallo R, Posada D. 2011. ProtTest 3: fast selection of best-fit models of protein evolution. Bioinformatics 27:1164–1165. 10.1093/bioinformatics/btr088 [DOI] [PMC free article] [PubMed] [Google Scholar]
- 24.Nagarajan N, Kingsford C. 2011. GiRaF: robust, computational identification of influenza reassortments via graph mining. Nucleic Acids Res. 39:e34. 10.1093/nar/gkq1232 [DOI] [PMC free article] [PubMed] [Google Scholar]
- 25.Ronquist F, Huelsenbeck JP. 2003. MrBayes 3: Bayesian phylogenetic inference under mixed models. Bioinformatics 19:1572–1574. 10.1093/bioinformatics/btg180 [DOI] [PubMed] [Google Scholar]
- 26.Huelsenbeck JP, Ronquist F. 2001. MRBAYES: Bayesian inference of phylogenetic trees. Bioinformatics 17:754–755. 10.1093/bioinformatics/17.8.754 [DOI] [PubMed] [Google Scholar]
- 27.Posada D. 2008. jModelTest: phylogenetic model averaging. Mol. Biol. Evol. 25:1253–1256. 10.1093/molbev/msn083 [DOI] [PubMed] [Google Scholar]
- 28.Drummond AJ, Rambaut A. 2007. BEAST: Bayesian evolutionary analysis by sampling trees. BMC Evol. Biol. 7:214. 10.1186/1471-2148-7-214 [DOI] [PMC free article] [PubMed] [Google Scholar]
- 29.Minin VN, Bloomquist EW, Suchard MA. 2008. Smooth skyride through a rough skyline: Bayesian coalescent-based inference of population dynamics. Mol. Biol. Evol. 25:1459–1471. 10.1093/molbev/msn090 [DOI] [PMC free article] [PubMed] [Google Scholar]
- 30.Bahl J, Nelson MI, Chan KH, Chen R, Vijaykrishna D, Halpin RA, Stockwell TB, Lin X, Wentworth DE, Ghedin E, Guan Y, Peiris JS, Riley S, Rambaut A, Holmes EC, Smith GJ. 2011. Temporally structured metapopulation dynamics and persistence of influenza A H3N2 virus in humans. Proc. Natl. Acad. Sci. U. S. A. 108:19359–19364. 10.1073/pnas.1109314108 [DOI] [PMC free article] [PubMed] [Google Scholar]
- 31.Kass RE, Raftery AE. 1995. Bayes factors. J. Am. Stat. Assoc. 90:773–795. 10.1080/01621459.1995.10476572 [DOI] [Google Scholar]
- 32.Smith GJ, Bahl J, Vijaykrishna D, Zhang J, Poon LL, Chen H, Webster RG, Peiris JS, Guan Y. 2009. Dating the emergence of pandemic influenza viruses. Proc. Natl. Acad. Sci. U. S. A. 106:11709–11712. 10.1073/pnas.0904991106 [DOI] [PMC free article] [PubMed] [Google Scholar]
- 33.Suchard MA, Weiss RE, Sinsheimer JS. 2001. Bayesian selection of continuous-time Markov chain evolutionary models. Mol. Biol. Evol. 18:1001–1013. 10.1093/oxfordjournals.molbev.a003872 [DOI] [PubMed] [Google Scholar]
- 34.Vijaykrishna D, Bahl J, Riley S, Duan L, Zhang JX, Chen H, Peiris JS, Smith GJ, Guan Y. 2008. Evolutionary dynamics and emergence of panzootic H5N1 influenza viruses. PLoS Pathog. 4:e1000161. 10.1371/journal.ppat.1000161 [DOI] [PMC free article] [PubMed] [Google Scholar]
- 35.Kosakovsky Pond SL, Frost SD. 2005. Not so different after all: a comparison of methods for detecting amino acid sites under selection. Mol. Biol. Evol. 22:1208–1222. 10.1093/molbev/msi105 [DOI] [PubMed] [Google Scholar]
- 36.Pond SL, Frost SD, Grossman Z, Gravenor MB, Richman DD, Brown AJ. 2006. Adaptation to different human populations by HIV-1 revealed by codon-based analyses. PLoS Comput. Biol. 2:e62. 10.1371/journal.pcbi.0020062 [DOI] [PMC free article] [PubMed] [Google Scholar]
- 37.Kosakovsky Pond SL, Murrell B, Fourment M, Frost SD, Delport W, Scheffler K. 2011. A random effects branch-site model for detecting episodic diversifying selection. Mol. Biol. Evol. 28:3033–3043. 10.1093/molbev/msr125 [DOI] [PMC free article] [PubMed] [Google Scholar]
- 38.Murrell B, Moola S, Mabona A, Weighill T, Sheward D, Kosakovsky Pond SL, Scheffler K. 2013. FUBAR: a fast, unconstrained Bayesian approximation for inferring selection. Mol. Biol. Evol. 30:1196–1205. 10.1093/molbev/mst030 [DOI] [PMC free article] [PubMed] [Google Scholar]
- 39.Kosakovsky Pond SL, Poon AF, Leigh Brown AJ, Frost SD. 2008. A maximum likelihood method for detecting directional evolution in protein sequences and its application to influenza A virus. Mol. Biol. Evol. 25:1809–1824. 10.1093/molbev/msn123 [DOI] [PMC free article] [PubMed] [Google Scholar]
- 40.Pond SL, Frost SD, Muse SV. 2005. HyPhy: hypothesis testing using phylogenies. Bioinformatics 21:676–679. 10.1093/bioinformatics/bti079 [DOI] [PubMed] [Google Scholar]
- 41.Delport W, Poon AF, Frost SD, Kosakovsky Pond SL. 2010. Datamonkey 2010: a suite of phylogenetic analysis tools for evolutionary biology. Bioinformatics 26:2455–2457. 10.1093/bioinformatics/btq429 [DOI] [PMC free article] [PubMed] [Google Scholar]
- 42.Pond SL, Frost SD. 2005. Datamonkey: rapid detection of selective pressure on individual sites of codon alignments. Bioinformatics 21:2531–2533. 10.1093/bioinformatics/bti320 [DOI] [PubMed] [Google Scholar]
- 43.Fang R, Min Jou W, Huylebroeck D, Devos R, Fiers W. 1981. Complete structure of A/duck/Ukraine/63 influenza hemagglutinin gene: animal virus as progenitor of human H3 Hong Kong 1968 influenza hemagglutinin. Cell 25:315–323. 10.1016/0092-8674(81)90049-0 [DOI] [PubMed] [Google Scholar]
- 44.Kawaoka Y, Krauss S, Webster RG. 1989. Avian-to-human transmission of the PB1 gene of influenza A viruses in the 1957 and 1968 pandemics. J. Virol. 63:4603–4608 [DOI] [PMC free article] [PubMed] [Google Scholar]
- 45.Masurel N, Marine WM. 1973. Recycling of Asian and Hong Kong influenza A virus hemagglutinins in man. Am. J. Epidemiol. 97:44–49 [DOI] [PubMed] [Google Scholar]
- 46.Xu X, Cox NJ, Bender CA, Regnery HL, Shaw MW. 1996. Genetic variation in neuraminidase genes of influenza A (H3N2) viruses. Virology 224:175–183. 10.1006/viro.1996.0519 [DOI] [PubMed] [Google Scholar]
- 47.Abed Y, Hardy I, Li Y, Boivin G. 2002. Divergent evolution of hemagglutinin and neuraminidase genes in recent influenza A:H3N2 viruses isolated in Canada. J. Med. Virol. 67:589–595. 10.1002/jmv.10143 [DOI] [PubMed] [Google Scholar]
- 48.Holmes EC, Ghedin E, Miller N, Taylor J, Bao Y, St George K, Grenfell BT, Salzberg SL, Fraser CM, Lipman DJ, Taubenberger JK. 2005. Whole-genome analysis of human influenza A virus reveals multiple persistent lineages and reassortment among recent H3N2 viruses. PLoS Biol. 3:e300. 10.1371/journal.pbio.0030300 [DOI] [PMC free article] [PubMed] [Google Scholar]
- 49.Bragstad K, Nielsen LP, Fomsgaard A. 2008. The evolution of human influenza A viruses from 1999 to 2006: a complete genome study. Virol. J. 5:40. 10.1186/1743-422X-5-40 [DOI] [PMC free article] [PubMed] [Google Scholar]
- 50.Wise HM, Foeglein A, Sun J, Dalton RM, Patel S, Howard W, Anderson EC, Barclay WS, Digard P. 2009. A complicated message: identification of a novel PB1-related protein translated from influenza A virus segment 2 mRNA. J. Virol. 83:8021–8031. 10.1128/JVI.00826-09 [DOI] [PMC free article] [PubMed] [Google Scholar]
- 51.Chen W, Calvo PA, Malide D, Gibbs J, Schubert U, Bacik I, Basta S, O'Neill R, Schickli J, Palese P, Henklein P, Bennink JR, Yewdell JW. 2001. A novel influenza A virus mitochondrial protein that induces cell death. Nat. Med. 7:1306–1312. 10.1038/nm1201-1306 [DOI] [PubMed] [Google Scholar]
- 52.Jagger BW, Wise HM, Kash JC, Walters KA, Wills NM, Xiao YL, Dunfee RL, Schwartzman LM, Ozinsky A, Bell GL, Dalton RM, Lo A, Efstathiou S, Atkins JF, Firth AE, Taubenberger JK, Digard P. 2012. An overlapping protein-coding region in influenza A virus segment 3 modulates the host response. Science 337:199–204. 10.1126/science.1222213 [DOI] [PMC free article] [PubMed] [Google Scholar]
- 53.Muramoto Y, Noda T, Kawakami E, Akkina R, Kawaoka Y. 2013. Identification of novel influenza A virus proteins translated from PA mRNA. J. Virol. 87:2455–2462. 10.1128/JVI.02656-12 [DOI] [PMC free article] [PubMed] [Google Scholar]
- 54.O'Neill RE, Talon J, Palese P. 1998. The influenza virus NEP (NS2 protein) mediates the nuclear export of viral ribonucleoproteins. EMBO J. 17:288–296. 10.1093/emboj/17.1.288 [DOI] [PMC free article] [PubMed] [Google Scholar]
- 55.Wiley DC, Wilson IA, Skehel JJ. 1981. Structural identification of the antibody-binding sites of Hong Kong influenza haemagglutinin and their involvement in antigenic variation. Nature 289:373–378. 10.1038/289373a0 [DOI] [PubMed] [Google Scholar]
- 56.Wilson IA, Cox NJ. 1990. Structural basis of immune recognition of influenza virus hemagglutinin. Annu. Rev. Immunol. 8:737–771. 10.1146/annurev.iy.08.040190.003513 [DOI] [PubMed] [Google Scholar]
- 57.Skehel JJ, Waterfield MD. 1975. Studies on the primary structure of the influenza virus hemagglutinin. Proc. Natl. Acad. Sci. U. S. A. 72:93–97. 10.1073/pnas.72.1.93 [DOI] [PMC free article] [PubMed] [Google Scholar]
- 58.Li Y, Chen ZY, Wang W, Baker CC, Krug RM. 2001. The 3′-end-processing factor CPSF is required for the splicing of single-intron pre-mRNAs in vivo. RNA 7:920–931. 10.1017/S1355838201010226 [DOI] [PMC free article] [PubMed] [Google Scholar]
- 59.Melen K, Kinnunen L, Fagerlund R, Ikonen N, Twu KY, Krug RM, Julkunen I. 2007. Nuclear and nucleolar targeting of influenza A virus NS1 protein: striking differences between different virus subtypes. J. Virol. 81:5995–6006. 10.1128/JVI.01714-06 [DOI] [PMC free article] [PubMed] [Google Scholar]
- 60.Air GM, Els MC, Brown LE, Laver WG, Webster RG. 1985. Location of antigenic sites on the three-dimensional structure of the influenza N2 virus neuraminidase. Virology 145:237–248. 10.1016/0042-6822(85)90157-6 [DOI] [PubMed] [Google Scholar]
- 61.Du J, Cross TA, Zhou HX. 2012. Recent progress in structure-based anti-influenza drug design. Drug Discov. Today 17:1111–1120. 10.1016/j.drudis.2012.06.002 [DOI] [PMC free article] [PubMed] [Google Scholar]
- 62.Naffakh N, Tomoiu A, Rameix-Welti MA, van der Werf S. 2008. Host restriction of avian influenza viruses at the level of the ribonucleoproteins. Annu. Rev. Microbiol. 62:403–424. 10.1146/annurev.micro.62.081307.162746 [DOI] [PubMed] [Google Scholar]
- 63.Boulo S, Akarsu H, Ruigrok RW, Baudin F. 2007. Nuclear traffic of influenza virus proteins and ribonucleoprotein complexes. Virus Res. 124:12–21. 10.1016/j.virusres.2006.09.013 [DOI] [PubMed] [Google Scholar]
- 64.Fitch WM, Bush RM, Bender CA, Cox NJ. 1997. Long term trends in the evolution of H(3) HA1 human influenza type A. Proc. Natl. Acad. Sci. U. S. A. 94:7712–7718. 10.1073/pnas.94.15.7712 [DOI] [PMC free article] [PubMed] [Google Scholar]
- 65.Schweiger B, Bruns L, Meixenberger K. 2006. Reassortment between human A(H3N2) viruses is an important evolutionary mechanism. Vaccine 24:6683–6690. 10.1016/j.vaccine.2006.05.105 [DOI] [PubMed] [Google Scholar]
- 66.Hiromoto Y, Saito T, Lindstrom SE, Li Y, Nerome R, Sugita S, Shinjoh M, Nerome K. 2000. Phylogenetic analysis of the three polymerase genes (PB1, PB2 and PA) of influenza B virus. J. Gen. Virol. 81:929–937 [DOI] [PubMed] [Google Scholar]
- 67.Bean WJ, Schell M, Katz J, Kawaoka Y, Naeve C, Gorman O, Webster RG. 1992. Evolution of the H3 influenza virus hemagglutinin from human and nonhuman hosts. J. Virol. 66:1129–1138 [DOI] [PMC free article] [PubMed] [Google Scholar]
- 68.Trifonov V, Racaniello V, Rabadan R. 2009. The contribution of the PB1-F2 protein to the fitness of influenza A viruses and its recent evolution in the 2009 influenza A (H1N1) pandemic virus. PLoS Curr. 1:RRN1006. 10.1371/currents.RRN1006 [DOI] [PMC free article] [PubMed] [Google Scholar]
- 69.Chen CJ, Chen GW, Wang CH, Huang CH, Wang YC, Shih SR. 2010. Differential localization and function of PB1-F2 derived from different strains of influenza A virus. J. Virol. 84:10051–10062. 10.1128/JVI.00592-10 [DOI] [PMC free article] [PubMed] [Google Scholar]
- 70.Shi M, Jagger BW, Wise HM, Digard P, Holmes EC, Taubenberger JK. 2012. Evolutionary conservation of the PA-X open reading frame in segment 3 of influenza A virus. J. Virol. 86:12411–12413. 10.1128/JVI.01677-12 [DOI] [PMC free article] [PubMed] [Google Scholar]
- 71.Dundon WG, Capua I. 2009. A closer look at the NS1 of influenza virus. Viruses 1:1057–1072. 10.3390/v1031057 [DOI] [PMC free article] [PubMed] [Google Scholar]
- 72.Feng J, Zhang M, Mozdzanowska K, Zharikova D, Hoff H, Wunner W, Couch RB, Gerhard W. 2006. Influenza A virus infection engenders a poor antibody response against the ectodomain of matrix protein 2. Virol. J. 3:102. 10.1186/1743-422X-3-102 [DOI] [PMC free article] [PubMed] [Google Scholar]
- 73.Bright RA, Shay DK, Shu B, Cox NJ, Klimov AI. 2006. Adamantane resistance among influenza A viruses isolated early during the 2005–2006 influenza season in the United States. JAMA 295:891–894. 10.1001/jama.295.8.joc60020 [DOI] [PubMed] [Google Scholar]
- 74.Simonsen L, Viboud C, Grenfell BT, Dushoff J, Jennings L, Smit M, Macken C, Hata M, Gog J, Miller MA, Holmes EC. 2007. The genesis and spread of reassortment human influenza A/H3N2 viruses conferring adamantane resistance. Mol. Biol. Evol. 24:1811–1820. 10.1093/molbev/msm103 [DOI] [PubMed] [Google Scholar]
- 75.Li S, Min JY, Krug RM, Sen GC. 2006. Binding of the influenza A virus NS1 protein to PKR mediates the inhibition of its activation by either PACT or double-stranded RNA. Virology 349:13–21. 10.1016/j.virol.2006.01.005 [DOI] [PubMed] [Google Scholar]
- 76.Fernandez-Sesma A, Marukian S, Ebersole BJ, Kaminski D, Park MS, Yuen T, Sealfon SC, Garcia-Sastre A, Moran TM. 2006. Influenza virus evades innate and adaptive immunity via the NS1 protein. J. Virol. 80:6295–6304. 10.1128/JVI.02381-05 [DOI] [PMC free article] [PubMed] [Google Scholar]
- 77.Baigent SJ, McCauley JW. 2003. Influenza type A in humans, mammals and birds: determinants of virus virulence, host-range and interspecies transmission. Bioessays 25:657–671. 10.1002/bies.10303 [DOI] [PubMed] [Google Scholar]
- 78.Chen R, Holmes EC. 2006. Avian influenza virus exhibits rapid evolutionary dynamics. Mol. Biol. Evol. 23:2336–2341. 10.1093/molbev/msl102 [DOI] [PubMed] [Google Scholar]
- 79.Chen R, Holmes EC. 2008. The evolutionary dynamics of human influenza B virus. J. Mol. Evol. 66:655–663. 10.1007/s00239-008-9119-z [DOI] [PMC free article] [PubMed] [Google Scholar]
- 80.Both GW, Sleigh MJ, Cox NJ, Kendal AP. 1983. Antigenic drift in influenza virus H3 hemagglutinin from 1968 to 1980: multiple evolutionary pathways and sequential amino acid changes at key antigenic sites. J. Virol. 48:52–60 [DOI] [PMC free article] [PubMed] [Google Scholar]
- 81.Laver WG, Air GM, Webster RG, Markoff LJ. 1982. Amino acid sequence changes in antigenic variants of type A influenza virus N2 neuraminidase. Virology 122:450–460. 10.1016/0042-6822(82)90244-6 [DOI] [PubMed] [Google Scholar]
- 82.Luther P, Bergmann KC, Oxford JS. 1984. An investigation of antigenic drift of neuraminidases of influenza A (H1N1) viruses. J. Hyg. (Lond.) 92:223–229. 10.1017/S002217240006424X [DOI] [PMC free article] [PubMed] [Google Scholar]
- 83.Boon AC, de Mutsert G, Graus YM, Fouchier RA, Sintnicolaas K, Osterhaus AD, Rimmelzwaan GF. 2002. Sequence variation in a newly identified HLA-B35-restricted epitope in the influenza A virus nucleoprotein associated with escape from cytotoxic T lymphocytes. J. Virol. 76:2567–2572. 10.1128/jvi.76.5.2567-2572.2002 [DOI] [PMC free article] [PubMed] [Google Scholar]
- 84.Rimmelzwaan GF, Boon AC, Voeten JT, Berkhoff EG, Fouchier RA, Osterhaus AD. 2004. Sequence variation in the influenza A virus nucleoprotein associated with escape from cytotoxic T lymphocytes. Virus Res. 103:97–100. 10.1016/j.virusres.2004.02.020 [DOI] [PubMed] [Google Scholar]
- 85.Voeten JT, Bestebroer TM, Nieuwkoop NJ, Fouchier RA, Osterhaus AD, Rimmelzwaan GF. 2000. Antigenic drift in the influenza A virus (H3N2) nucleoprotein and escape from recognition by cytotoxic T lymphocytes. J. Virol. 74:6800–6807. 10.1128/JVI.74.15.6800-6807.2000 [DOI] [PMC free article] [PubMed] [Google Scholar]
- 86.DiBrino M, Parker KC, Margulies DH, Shiloach J, Turner RV, Biddison WE, Coligan JE. 1994. The HLA-B14 peptide binding site can accommodate peptides with different combinations of anchor residues. J. Biol. Chem. 269:32426–32434 [PubMed] [Google Scholar]
- 87.Koelle K, Cobey S, Grenfell B, Pascual M. 2006. Epochal evolution shapes the phylodynamics of interpandemic influenza A (H3N2) in humans. Science 314:1898–1903. 10.1126/science.1132745 [DOI] [PubMed] [Google Scholar]
- 88.Koel BF, Burke DF, Bestebroer TM, van der Vliet S, Zondag GC, Vervaet G, Skepner E, Lewis NS, Spronken MI, Russell CA, Eropkin MY, Hurt AC, Barr IG, de Jong JC, Rimmelzwaan GF, Osterhaus AD, Fouchier RA, Smith DJ. 2013. Substitutions near the receptor binding site determine major antigenic change during influenza virus evolution. Science 342:976–979. 10.1126/science.1244730 [DOI] [PubMed] [Google Scholar]
- 89.Mitnaul LJ, Matrosovich MN, Castrucci MR, Tuzikov AB, Bovin NV, Kobasa D, Kawaoka Y. 2000. Balanced hemagglutinin and neuraminidase activities are critical for efficient replication of influenza A virus. J. Virol. 74:6015–6020. 10.1128/JVI.74.13.6015-6020.2000 [DOI] [PMC free article] [PubMed] [Google Scholar]
- 90.Sandbulte MR, Westgeest KB, Gao J, Xu X, Klimov AI, Russell CA, Burke DF, Smith DJ, Fouchier RA, Eichelberger MC. 2011. Discordant antigenic drift of neuraminidase and hemagglutinin in H1N1 and H3N2 influenza viruses. Proc. Natl. Acad. Sci. U. S. A. 108:20748–20753. 10.1073/pnas.1113801108 [DOI] [PMC free article] [PubMed] [Google Scholar]
Associated Data
This section collects any data citations, data availability statements, or supplementary materials included in this article.