

Abstract

Allostery can occur by way of subtle cooperation among protein residues (e.g., amino acids) even in the absence of large conformational shifts. Dynamical network analysis has been used to model this cooperation, helping to computationally explain how binding to an allosteric site can impact the behavior of a primary site many ångstroms away. Traditionally, computational efforts have focused on the most optimal path of correlated motions leading from the allosteric to the primary active site. We present a program called Weighted Implementation of Suboptimal Paths (WISP) capable of rapidly identifying additional suboptimal pathways that may also play important roles in the transmission of allosteric signals. Aside from providing signal redundancy, suboptimal paths traverse residues that, if disrupted through pharmacological or mutational means, could modulate the allosteric regulation of important drug targets. To demonstrate the utility of our program, we present a case study describing the allostery of HisH-HisF, an amidotransferase from T. maritima thermotiga. WISP and its VMD-based graphical user interface (GUI) can be downloaded from http://nbcr.ucsd.edu/wisp.
Introduction
Allosteric regulation is a key mechanism whereby proteins respond to environmental stimuli that modulate their activity.1−5 Classic models of allostery (e.g., the MWC6 and KNF7 models) suggest that a binding event at an allosteric site induces substantial conformational changes in the primary catalytic site. However, allostery has since been observed in the absence of large-scale conformational changes,8,9 suggesting that subtle alterations in protein dynamics can induce a population shift in the conformational ensemble without substantially changing the mean conformation of the protein. This subtle form of allosteric communication can be modeled by dynamical network analysis.
Recent advances in both correlated-residue clustering and dynamical network analysis have helped computationally quantify allosteric states.10−19 Dynamical network models of allostery often focus on the single most direct path of residues leading from the allosteric to the primary active site. However, few researchers have considered the state changes of slightly longer (suboptimal) allosteric pathways. The statistical distribution of these additional pathways may be useful for locating accessible residues that, if disrupted via pharmacological or mutational means, could modulate the allosteric regulation of important drug targets.
In this paper, we introduce Weighted Implementation of Suboptimal Paths (WISP), a tool that compliments current dynamical network models of allostery by rapidly calculating the primary communicating path between two residues as well as the slightly longer suboptimal paths. We illustrate the utility of the WISP method using the biological system HisH-HisF, a well-characterized glutamine amidotransferase enzyme.20 To facilitate the broader adoption of this method, we have also created a WISP plugin for the popular Visual Molecular Dynamics (VMD) package.21 WISP has been specifically tested on several operating systems, using several versions of Python, NumPy, SciPy, and NetworkX (Table 1).22−27 The program is open source and can be downloaded from http://nbcr.ucsd.edu/wisp.
Table 1. WISP Operating Specificationsa.
| operating system | Python | NumPy | SciPy | NetworkX |
|---|---|---|---|---|
| Scientific Linux 6.4 | 2.6 | 1.7 | 0.9.0 | 1.7 |
| Mac OSX 10.6 | 2.7.2 | 1.6.1 | 0.9.0 | 1.8.1 |
| Ubuntu 12.04 | 2.7.5 | 1.7.1 | 0.12.0 | 1.8.1 |
| Windows XP | 2.7.3 | 1.7.0rc1 | 0.11.0 | 1.8.1 |
WISP has been tested on a number of operating systems, using various versions of NumPy, SciPy, and NetworkX. We note that installation of necessary packages under Windows was difficult; however, the command-line version of the program was successfully executed after installing the appropriate dependencies using the ActivePython software package.
Materials and Methods
Molecular-Dynamics Trajectory Input
As input, WISP accepts an aligned molecular dynamics trajectory in the common multiframe PDB format.28 Trajectory postprocessing is necessary prior to WISP analysis, as most trajectories are not initially aligned or PDB formatted. The freely available Visual Molecular Dynamics (VMD) software package can be used to perform the necessary alignment and conversion.
Generating the Correlation Matrix
WISP, similar to other dynamical network analysis tools,29 is based on the dynamic interdependence among protein constituents (e.g., amino acids). A protein system is first simplified by representing each constituent as a single node. For example, depending on user-specified WISP parameters, an amino acid can be represented by a node positioned at the residue center of mass, the side-chain center of mass, the backbone center of mass, or the α carbon. As a default, the residue center of mass is used.
The interdependence among nodes is represented as a connecting edge with an associated numeric value that reflects its strength. There are numerous methods for describing the interdependence among nodes in a protein network. Typically, this interdependence is represented by a matrix C with values corresponding to the weights of each edge. By default, WISP generates an N2 matrix C by calculating the correlated motion among node–node pairs as shown in eqs 1 and 2:
| 1 |
| 2 |
where N is the number of nodes, i and j are indices corresponding to individual nodes, ri(t) is the location of node i at time t, and Cij is the matrix element at position (i, j).
The absolute value of Cij is larger when the motions of two nodes are highly correlated or anticorrelated. In order to compute signaling pathways, it is useful to construct a matrix where the opposite is true, i.e., where small values indicate highly correlated or anticorrelated motions. Consequently, the correlation matrix is functionalized according to eq 3, as outlined in previous works.12,13
| 3 |
As a point of clarification, each wij can be thought of as a “distance” in functionalized correlation space. Throughout the remainder of this paper, concepts like length and distance will refer to spans in this space, unless specifically described as “Cartesian” or “physical.” We further note that, while WISP’s default functionalized correlation matrix is generally useful, any user-specified matrix that defines signaling strength as inversely proportional to edge length can be used.
Reducing the Complexity of the Functionalized Correlation Matrix
In order to improve the speed of subsequent path-finding steps, the complexity of the functionalized correlation matrix W must be reduced. To this end, two techniques are used. First, a contact-map matrix Mcontact is used to separate entries in W that represent pairs of physically distant residues from those that represent adjacent residues. By default, Mcontact is constructed using pcutoff, a user-specified Cartesian cutoff distance that represents physical proximity.
The average location of each atom over the course of the aligned molecular dynamics trajectory is first calculated, followed by a pairwise Cartesian distance comparison. Two nodes are considered to be in physical contact if the average locations of any of their associated residue atoms come within pcutoff of one another. Mcontact entries are set to zero for all node–node pairs that are not in physical contact. A simplified, functionalized correlation matrix Wsimp is then constructed by multiplying W and Mcontact element-wise. The entries of Wsimp that equal zero represent node–node interactions that are subsequently ignored. Alternatively, users can provide their own Mcontact if desired.
Second, to further reduce the complexity of the functionalized correlation matrix W, a pruning algorithm identifies nodes that only participate in pathways having lengths in network space that are greater than another cutoff (dcutoff). As the ultimate goal is to identify suboptimal paths with lengths less than dcutoff, these nodes can be effectively discarded as well. To identify these nodes, we first generate the set of all forced-node paths (FNPs). An FNP is the optimal pathway between two user specified nodes na and nb that is forced to pass through a given third node ni. For any two fixed nodes na and nb, each third node ni is associated with a single FNP. The set of all FNPs can therefore be generated by iterating over all the nodes, ni, of the system.
To calculate an FNP, Dijkstra’s algorithm, included in NetworkX,22 is first used to identify the optimal paths between na → ni and nb → ni, respectively. The FNP has a length equal to the sum of these two constituent paths. Any path between na and nb that passes through ni must have a length equal to or greater than that of the associated FNP. Consequently, if the length of the FNP is greater than dcutoff, all entries in Wsimp associated with ni are set to zero, so that ni is effectively ignored.
Calculating Suboptimal Pathways
Having generated Wsimp, we are now ready to search for both the single optimal and multiple suboptimal paths between na and nb. The optimal path is fairly easy to identify using Dijkstra’s algorithm, mentioned above. In contrast, identifying all suboptimal paths is difficult because the number of possible pathways between na and nb grows rapidly as the total number of nodes increases.
To identify suboptimal paths, a recursive, bidirectional approach is employed. Simultaneous searches start from na and nb (Figure 1, in blue and red, respectively) and recursively traverse the nodes of the dynamical network. The recursive algorithm ignores the connections/correlations between nodes that are physically distant (Figure 1, gray lines). Additionally, nodes eliminated using the FNP technique described above are likewise ignored (Figure 1, gray circles), resulting in substantial speedups. As soon as any of the lengthening paths grows longer than dcutoff, that branch of the recursion is killed (Figure 1, red “X”).
Figure 1.

A schematic for path identification. Simultaneous searches start from na and nb (blue and red, respectively) and recursively traverse the nodes of the dynamical network. Connections/correlations between nodes that are physically distant are ignored (gray lines). Nodes eliminated using the FNP technique are also ignored (gray circles). As soon as any of the lengthening paths grows too long, that branch of the recursion is killed (red “X”). At each recursive step, all branches originating from na and nb are compared for common nodes (asterisk). If a common node exists, the two paths are joined. If the length of this composite path is sufficiently short, a suboptimal path has been identified.
At each recursive step, all branches originating from na and nb are compared for common nodes (Figure 1, the node marked with an asterisk). If a common node exists, the two paths are joined at this node. If the length of this composite path is less than dcutoff, a suboptimal path has been identified. As WISP has been developed to take advantage of multiple processors, running the program on a multicore system can lead to further speedups beyond the software optimizations described above.
Program Output
The program output is a directory containing multiple files, including the specific W and Mcontact matrices used. The primary output file is a Tcl script that, when loaded into VMD, draws three-dimensional splines representative of the optimal and suboptimal paths. User defined parameters control the relationship between spline thickness, color, opacity, and path length. Useful information is also given as comments in the Tcl file, including path lengths and participating protein residues.
Graphical User Interface
In addition to the command-line program, we have also developed a Visual Molecular Dynamics21 (VMD) plugin and Tcl-based GUI for easy preparation and visualization of WISP results. The plugin can be accessed through the VMD “Extensions” menu. The main window of the WISP GUI (Figure 2) allows the user to specify the molecular trajectory as well as the allosteric-signal source and sink residues. Several additional window interfaces allow the user to modify more advanced program options if needed. All options available through the WISP command-line interface are available to users of the GUI.
Figure 2.

WISP Graphical User Interface (GUI). In this demonstration, the GUI is used to visualize the allosteric pathways between Leu50:HisF and Glu180:HisH. In the main window (top left), the user selects the relevant molecule and which residues to use as the source and sink. The user may also select to load the visualization into VMD upon job completion. The setting option windows (left and bottom right) allow the user to specify additional WISP arguments.
Once satisfied with the run specifications, the user may click the “Run WISP” button at the bottom of the WISP main window to execute the job. The plugin loads the visualization of the allosteric pathways into the main VMD window, where the appearance can be further modified according to the user’s preferences.
HisH-HisF Details
The molecular dynamics simulations of HisH-HisF used in the current study have been described previously.13 In brief, a model of the HisH–HisF apo dimer was prepared from the 1GPW30 crystal structure (Thermotoga maritima). To generate the corresponding holo structure, the 1OX531 crystal structure (Saccharomyces cerevisiae), which contains a cocrystallized PRFAR allosteric effector molecule, was aligned to the apo model, effectively positioning PRFAR within the 1GPW:HisF allosteric site. The aligned 1OX5 PRFAR was then merged with the 1GPW-based apo model to yield the corresponding holo structure. Following solvation with TIP3P water molecules and 1 ns of harmonic constrained equilibration, 20 ns of production dynamics with a 2 fs time step were run for both the apo and holo systems using NAMD,32 the CHARMM27 force field,33 and the same PRFAR parametrization used previously.34
Results/Discussion
Allosteric regulation is crucial to many biological processes. Consequently, one natural strategy for rational drug design is to impede or agonize protein function via allosteric modulation. Classic views of allostery suggest that the binding of an effector molecule at an allosteric site induces large conformational shifts that alter the activity of the primary site. However, as allostery is not necessarily limited to large shifts, this reasoning does not explain some examples of regulation at a distance. For instance, Tsai et al.9 recently showed that significant backbone deformations are not required for an allosteric effect; rather, in the absence of large conformational changes, subtle shifts in local dynamics driven by entropic effects8 govern certain types of allostery.
Quasi-harmonic analysis (e.g., like that used by software packages such as CARMA35,36 to calculate entropy) is commonly used to build dynamical network models that quantify signaling pathways among protein constituents. Optimal and suboptimal pathways are calculated that connect protein constituents believed to be important for allostery (i.e., “sources” and “sinks”). An optimal pathway is the shortest distance traversed between source and sink along weighted edges (e.g., as determined by correlated motions), and suboptimal pathways are those closest in length to, but not including, the optimal path. Existing tools can compute optimal and suboptimal pathways between residues;37 however, these programs lack the speed required to compute more than 50 suboptimal pathways within a reasonable amount of time (several hours or days). As statistics related to suboptimal pathways may provide important insights that cannot be gleaned from the single optimal pathway, faster algorithmic advances must be made.
WISP is designed to facilitate the calculation of hundreds of suboptimal pathways in minutes, thereby permitting fast and robust statistical analysis of biological systems modeled as dynamical networks. For example, using a modern workstation with 24 cores, we recently used a 20 000-frame trajectory to identify 750 pathways. WISP loaded and analyzed the trajectory, generated the functionalized correlation matrix, and identified the 750 pathways in 21 min and 52 s. When the calculation was repeated using a copy of the functionalized correlation matrix saved from the first run, the 750 pathways were identified in only 5 min and 44 s.
To demonstrate the utility of the WISP algorithm, we used it to study HisH-HisF, a multidomain globular protein known to exhibit allostery. The activity of HisH-HisF, which regulates the fifth step of the histidine biosynthetic pathway in plants, fungi, and microbes, is substantially altered by the allosteric effector N1-[(5′-phosphoribulosyl)-formimino]-5-aminoimidazole-4-carboxamide ribonucleotide (PRFAR).20 Guided by previous work,13 we investigated the suboptimal pathways between residues Leu50:HisF and Glu180:HisH using 20 ns molecular dynamics simulations of both apo and holo HisH-HisF.
A total of 700 pathways (Figure 3) between Leu50:HisF and Glu180:HisH were calculated using WISP’s default correlation (eqs 1–3) and contact-map matrices, described in the Materials and Methods. Had only the two optimal pathways (apo vs holo) been considered, we would have concluded that communication between the allosteric and primary site is fundamentally different in the presence and absence of the PRFAR effector molecule (Figures 3 and 4). The optimal pathway between Leu50:HisF and Glu180:HisH in the apo state was LEU50:HisF → PHE49:HisF → PHE77:HisF → PRO76:HisF → LYS181:HisH → GLU180:HisH. In contrast, the optimal pathway with PRFAR bound was LEU50:HisF → GLY80:HisF → VAL79:HisF → LYS99:HisF → ASP98:HisF → LYS181:HisH → GLU180:HisH.
Figure 3.

WISP-generated signaling pathways. The 700 shortest paths between Leu50:HisF and Glu180:HisH, shown as red splines, derived from (A) the apo trajectory and (B) the holo trajectory. WISP allows the user to choose between a number of graphical settings to better visualize signaling among nodes.
Figure 4.
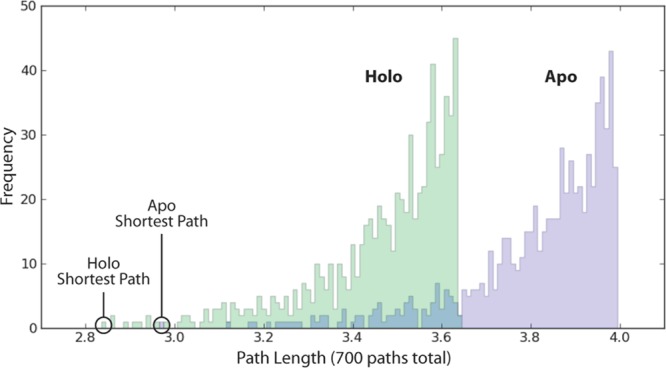
Statistical distribution of signaling pathways. A histogram of the 700 path lengths associated with the apo and holo trajectories is shown. The optimal paths are denoted “Shortest Path.” The path distribution is largely shifted to the left for the holo (allosteric) state. This shift likely results from a more coherent signal in the holo simulation, indicating a possible decrease in the entropy along the pathways due to PRFAR binding.
However, when we considered multiple suboptimal paths, it became apparent that allosteric signaling may be far more intricate. The optimal path in the apo simulation is the shortest suboptimal path in the holo simulation (top 0.3%), and the optimal path in the holo simulation is the 13th shortest suboptimal path in the apo simulation (top 2.0%). In light of this multipathway analysis, the idea that PRFAR binding fundamentally alters a solitary line of communication between the allosteric and primary site becomes less tenable. Rather, the binding of the effector molecule likely has small effects on multiple pathways, both optimal and suboptimal, that when taken together yield a substantial allosteric effect.
We subsequently sought to characterize the strength of this allosteric effect. The lengths of the two optimal pathways of the two systems did not differ substantially (apo, 2.97; holo, 2.84). Consequently, had only these two pathways been considered, some might have mistakenly concluded that the allosteric consequences of PRFAR binding are minor. In contrast, when hundreds of suboptimal paths were also considered, a large PRFAR-dependent shift in communication between the allosteric and primary site became apparent. To demonstrate this shift, we generated a histogram of all path lengths for both the holo and apo simulations (Figure 4). The distribution derived from the holo trajectory is substantially skewed toward shorter path lengths, suggesting that the motions of the residues connecting the allosteric and primary sites are more tightly correlated when PRFAR is bound. An overall “dynamical tightening” and loss of entropy along the pathways may therefore explain the allosteric signal.
To identify protein residues critical for allosteric transmission, we counted the number of times each residue appeared in any of the 700 paths associated with the apo and holo trajectories, respectively (i.e., the degeneracy of each node, Figure 5). Notably, a number of residues had large effector-molecule-dependent shifts in degeneracy, i.e., HisF: LEU47 (shifts down), VAL69 (shifts up), ALA70 (shifts up), ILE73 (shifts up), ASP74 (shifts up), PRO76 (shifts down), and ALA97 (shifts down) and HisH: LYS181 (slight shift down) (Table 2). Importantly, these residues, which may be crucial for the regulation of protein activity, did not all appear in the optimal apo and holo paths and so would not have been identified had the suboptimal paths been ignored. Previous studies in evolutionary conservation have shown that HisF: LEU47, VAL69, ALA70, and ILE73 are partially or strongly conserved and HisF: PRO76 and ALA97 and HisH: LYS181 are strictly conserved across the entire glutamine amidotransferase family of enzymes.38 HisF: ASP74 is not conserved, but this amino acid is still predicted to play a role in allostery.38 Compounds that target (i.e., selectively bind) these critical residues may serve as useful precursors to future allosteric-modulating small molecules.
Figure 5.

Node degeneracy in signaling pathways. The total number of times a given residue participates in any of the 700 paths (i.e., node degeneracy) is shown for (A) HisF and (B) HisH. Green indicates the holo state, blue indicates the apo state, and cyan indicates an overlap. Note that Leu50:HisF and Glu180:HisH are present in all 700 paths.
Table 2. Node Degeneracya.
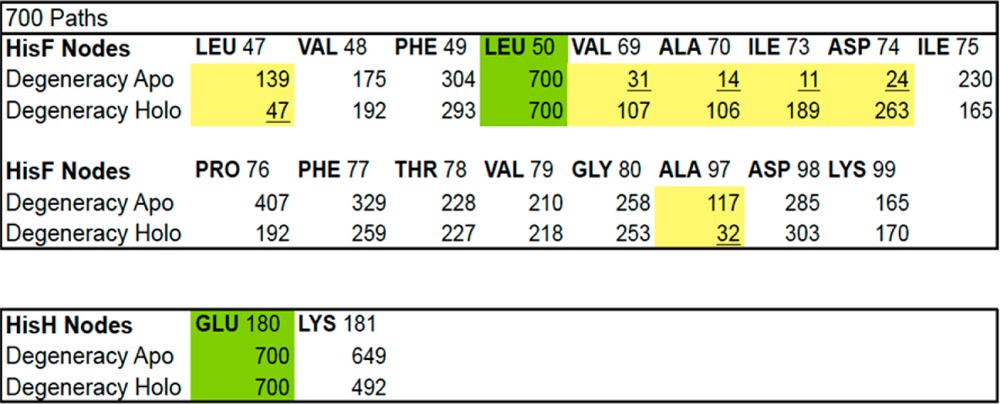
A numerical representation of the same data from Figure 5. The comparison between the apo and holo states suggests that certain residues are more sensitive to the allosteric effector PRFAR than others (shaded columns).
We note that our decision to specifically analyze the 700 shortest paths between Leu50:HisF and Glu180:HisH was arbitrary. In order to better assess the minimum number of paths required to reliably predict node degeneracy, we analyzed the holo trajectory by varying the number of paths considered and calculating the degeneracy of selected residues/nodes implicated in the allosteric mechanism (Figure 6). We note that the degeneracy of these nodes had largely converged by 350 paths. A similar result was obtained when the apo simulation was analyzed (data not shown). Given that the relative importance of suboptimal paths in determining the competency of an allosteric signal is likely highly system dependent, we do not necessarily recommend this exact number of paths for all analyses. However, we are hopeful that this general benchmark will help guide future researchers in their efforts.
Figure 6.

Normalized node degeneracy as a function of the number of suboptimal paths calculated (holo simulation). The degeneracy of selected residues/nodes as a function of paths searched was calculated and normalized by dividing by the total number of paths. The normalized degeneracy of these nodes largely converged by 350 paths. Similar results were obtained when the apo simulation was analyzed (data not shown).
Conclusion
We present WISP, a program that rapidly calculates both optimal and suboptimal communication pathways between distinct protein residues. The program is available as a VMD plugin or a standalone command-line script. WISP outputs path members and lengths that can be subsequently used in the analysis of path distributions, node degeneracy, and other metrics of interest to scientists studying the molecular mechanisms of allostery
The utility of our program was presented by performing a dynamical analysis of the HisH-HisF protein. In our test case, allosteric modulation was likely the result of subtle changes in multiple suboptimal pathways rather than large changes in a single optimal path. Additionally, we showed that PRFAR binding causes a large shift toward shorter path lengths (i.e., more correlated motions) in 700 communication pathways between residues HisF:Leu50 and HisH:Glu180. This shift explains the strong allosteric effects of the PRFAR modulator (Figure 4). Remarkably, the significant shift in collective correlated dynamics occurred even at relatively short (tens of nanoseconds) time scales, suggesting that the allosteric signal is rapidly transmitted. The multiple suboptimal pathways are dominated by a few select residues, as indicated by the shift in node degeneracy between the apo and holo states (Figure 5 and Table 2).
WISP has been successfully tested on a number of platforms (Table 1). We are hopeful that the program will be a useful tool for the computational-biology community.
Acknowledgments
This work was funded by the National Institutes of Health through the NIH Director’s New Innovator Award Program DP2-OD007237 and the NSF XSEDE Supercomputer resources grant RAC CHE060073N to R.E.A. Funding and support from the National Biomedical Computation Resource is provided through NIH P41 GM103426. Additional resources from the Center for Theoretical Biological Physics and the Keck II Computing and Visualization facility are gratefully acknowledged. We would also like to thank Dr. Robert Swift and Dr. John Eargle for their helpful discussions.
The authors declare no competing financial interest.
Author Contributions
† These authors contributed equally to this work.
Funding Statement
National Institutes of Health, United States
References
- Nussinov R.; Tsai C. J.; Ma B. Y. The Underappreciated Role of Allostery in the Cellular Network. Annu. Rev. Biophys. 2013, 42, 169–189. [DOI] [PMC free article] [PubMed] [Google Scholar]
- Cui Q.; Karplus M. Allostery and cooperativity revisited. Protein Sci. 2008, 17, 1295–1307. [DOI] [PMC free article] [PubMed] [Google Scholar]
- Berezovsky I. N. Thermodynamics of allostery paves a way to allosteric drugs. Biochim. Biophys. Acta, Proteins Proteomics 2013, 1834, 830–835. [DOI] [PubMed] [Google Scholar]
- Nussinov R.; Tsai C. J. Allostery in Disease and in Drug Discovery. Cell 2013, 153, 293–305. [DOI] [PubMed] [Google Scholar]
- Laine E.; Martinez L.; Ladant D.; Malliavin T.; Blondel A. Molecular Motions as a Drug Target: Mechanistic Simulations of Anthrax Toxin Edema Factor Function Led to the Discovery of Novel Allosteric Inhibitors. Toxins 2012, 4, 580–604. [DOI] [PMC free article] [PubMed] [Google Scholar]
- Monod J.; Wyman J.; Changeux J. P. On the Nature of Allosteric Transitions: A Plausible Model. J. Mol. Biol. 1965, 12, 88–118. [DOI] [PubMed] [Google Scholar]
- Koshland D. E. Jr.; Nemethy G.; Filmer D. Comparison of experimental binding data and theoretical models in proteins containing subunits. Biochemistry 1966, 5, 365–385. [DOI] [PubMed] [Google Scholar]
- Cooper A.; Dryden D. T. F. Allostery without Conformational Change - a Plausible Model. Eur. Biophys. J. Biophys. Lett. 1984, 11, 103–109. [DOI] [PubMed] [Google Scholar]
- Tsai C. J.; del Sol A.; Nussinov R. Allostery: absence of a change in shape does not imply that allostery is not at play. J. Mol. Biol. 2008, 378, 1–11. [DOI] [PMC free article] [PubMed] [Google Scholar]
- Atilgan A. R.; Atilgan C. Local motifs in proteins combine to generate global functional moves. Briefings Funct. Genomics 2012, 11, 479–488. [DOI] [PubMed] [Google Scholar]
- Gasper P. M.; Fuglestad B.; Komives E. A.; Markwick P. R.; McCammon J. A. Allosteric networks in thrombin distinguish procoagulant vs. anticoagulant activities. Proc. Natl. Acad. Sci. U. S. A. 2012, 109, 21216–21222. [DOI] [PMC free article] [PubMed] [Google Scholar]
- Sethi A.; Eargle J.; Black A. A.; Luthey-Schulten Z. Dynamical networks in tRNA:protein complexes. Proc. Natl. Acad. Sci. U. S. A. 2009, 106, 6620–6625. [DOI] [PMC free article] [PubMed] [Google Scholar]
- VanWart A. T.; Eargle J.; Luthey-Schulten Z.; Amaro R. E. Exploring Residue Component Contributions to Dynamical Network Models of Allostery. J. Chem. Theory Comput. 2012, 8, 2949–2961. [DOI] [PMC free article] [PubMed] [Google Scholar]
- Miao Y.; Nichols S. E.; Gasper P. M.; Metzger V. T.; McCammon J. A. Activation and dynamic network of the M2 muscarinic receptor. Proc. Natl. Acad. Sci. U. S. A. 2013, 110, 10982–10987. [DOI] [PMC free article] [PubMed] [Google Scholar]
- Rivalta I.; Sultan M. M.; Lee N. S.; Manley G. A.; Loria J. P.; Batista V. S. Allosteric pathways in imidazole glycerol phosphate synthase. Proc. Natl. Acad. Sci. U. S. A. 2012, 109, E1428–1436. [DOI] [PMC free article] [PubMed] [Google Scholar]
- Ghosh A.; Sakaguchi R.; Liu C.; Vishveshwara S.; Hou Y. M. Allosteric communication in cysteinyl tRNA synthetase: a network of direct and indirect readout. J. Biol. Chem. 2011, 286, 37721–37731. [DOI] [PMC free article] [PubMed] [Google Scholar]
- Boehr D. D.; Schnell J. R.; McElheny D.; Bae S. H.; Duggan B. M.; Benkovic S. J.; Dyson H. J.; Wright P. E. A Distal Mutation Perturbs Dynamic Amino Acid Networks in Dihydrofolate Reductase. Biochemistry 2013, 52, 4605–4619. [DOI] [PMC free article] [PubMed] [Google Scholar]
- Long D.; Bruschweiler R. Structural and Entropic Allosteric Signal Transduction Strength via Correlated Motions. J. Phys. Chem. Lett. 2012, 3, 1722–1726. [DOI] [PubMed] [Google Scholar]
- Liu M. S.; Todd B. D.; Sadus R. J. Allosteric Conformational Transition in Adenylate Kinase: Dynamic Correlations and Implication for Allostery. Aust. J. Chem. 2010, 63, 405–412. [Google Scholar]
- Alifano P.; Fani R.; Lio P.; Lazcano A.; Bazzicalupo M.; Carlomagno M. S.; Bruni C. B. Histidine biosynthetic pathway and genes: structure, regulation, and evolution. Microbiol. Rev. 1996, 60, 44–69. [DOI] [PMC free article] [PubMed] [Google Scholar]
- Humphrey W.; Dalke A.; Schulten K. VMD: Visual molecular dynamics. J. Mol. Graphics Modell. 1996, 14, 33–38. [DOI] [PubMed] [Google Scholar]
- Hagberg A. A.; Schult D. A.; Swart P. J.. Exploring network structure, dynamics, and function using NetworkX. Proceedings of the 7th Python in Science Conference (SciPy2008); Pasadena, CA, August 19–24, 2008.
- Dubois P. F.; Yang T. Y. Extending Python with Fortran. Comput. Sci. Eng. 1999, 1, 66–73. [Google Scholar]
- Peterson P. F2PY: a tool for connecting Fortran and Python programs. Int. J. Comput. Mater. Sci. Eng. 2009, 4, 296–305. [Google Scholar]
- Jones E.; Oliphant T.; Peterson P.. SciPy: Open Source Scientific Tools for Python. http://www.scipy.org/.
- Ascher D.; Dubois P. F.; Hinsen K.; Hugunin J. J.; Oliphant T.. Numerical Python; Lawrence Livermore National Laboratory: Livermore, CA, 1999. [Google Scholar]
- Oliphant T. E.Guide to NumPy; Brigham Young University: Provo, UT, 2006. [Google Scholar]
- Couch G. S.; Pettersen E. F.; Huang C. C.; Ferrin T. E. Annotating Pdb Files with Scene Information. J. Mol. Graphics 1995, 13, 153–158. [DOI] [PubMed] [Google Scholar]
- Eargle J.; Luthey-Schulten Z. NetworkView: 3D display and analysis of protein.RNA interaction networks. Bioinformatics 2012, 28, 3000–3001. [DOI] [PMC free article] [PubMed] [Google Scholar]
- Douangamath A.; Walker M.; Beismann-Driemeyer S.; Vega-Fernandez M. C.; Sterner R.; Wilmanns M. Structural evidence for ammonia tunneling across the (beta alpha)(8) barrel of the imidazole glycerol phosphate synthase bienzyme complex. Structure 2002, 10, 185–193. [DOI] [PubMed] [Google Scholar]
- Chaudhuri B. N.; Lange S. C.; Myers R. S.; Davisson V. J.; Smith J. L. Toward understanding the mechanism of the complex cyclization reaction catalyzed by imidazole glycerolphosphate synthase: Crystal structures of a ternary complex and the free enzyme. Biochemistry 2003, 42, 7003–7012. [DOI] [PubMed] [Google Scholar]
- Phillips J. C.; Braun R.; Wang W.; Gumbart J.; Tajkhorshid E.; Villa E.; Chipot C.; Skeel R. D.; Kale L.; Schulten K. Scalable molecular dynamics with NAMD. J. Comput. Chem. 2005, 26, 1781–1802. [DOI] [PMC free article] [PubMed] [Google Scholar]
- Brooks B. R.; Brooks C. L. III; Mackerell A. D. Jr.; Nilsson L.; Petrella R. J.; Roux B.; Won Y.; Archontis G.; Bartels C.; Boresch S.; Caflisch A.; Caves L.; Cui Q.; Dinner A. R.; Feig M.; Fischer S.; Gao J.; Hodoscek M.; Im W.; Kuczera K.; Lazaridis T.; Ma J.; Ovchinnikov V.; Paci E.; Pastor R. W.; Post C. B.; Pu J. Z.; Schaefer M.; Tidor B.; Venable R. M.; Woodcock H. L.; Wu X.; Yang W.; York D. M.; Karplus M. CHARMM: the biomolecular simulation program. J. Comput. Chem. 2009, 30, 1545–1614. [DOI] [PMC free article] [PubMed] [Google Scholar]
- Amaro R.; Luthey-Schulten Z. Molecular dynamics simulations of substrate channeling through an α–β barrel protein. Chem. Phys. 2004, 307, 147–155. [Google Scholar]
- Andricioaei I.; Karplus M. On the calculation of entropy from covariance matrices of the atomic fluctuations. J. Chem. Phys. 2001, 115, 6289–6292. [Google Scholar]
- Glykos N. M. Software news and updates. Carma: a molecular dynamics analysis program. J. Comput. Chem. 2006, 27, 1765–1768. [DOI] [PubMed] [Google Scholar]
- Floyd R. W. Algorithm-97 - Shortest Path. Commun. ACM 1962, 5, 345–345. [Google Scholar]
- Amaro R. E.; Sethi A.; Myers R. S.; Davisson V. J.; Luthey-Schulten Z. A. A network of conserved interactions regulates the allosteric signal in a glutamine amidotransferase. Biochemistry 2007, 46, 2156–2173. [DOI] [PubMed] [Google Scholar]