Abstract
Among the native yeasts found in alcoholic fermentation, rough colonies associated with pseudohyphal morphology belonging to the species Saccharomyces cerevisiae are very common and undesirable during the process. The aim of this work was to perform morphological and physiological characterisations of S. cerevisiae strains that exhibited rough and smooth colonies in an attempt to identify alternatives that could contribute to the management of rough colony yeasts in alcoholic fermentation. Characterisation tests for invasiveness in Agar medium, killer activity, flocculation and fermentative capacity were performed on 22 strains (11 rough and 11 smooth colonies). The effects of acid treatment at different pH values on the growth of two strains (“52” - rough and “PE-02” - smooth) as well as batch fermentation tests with cell recycling and acid treatment of the cells were also evaluated. Invasiveness in YPD Agar medium occurred at low frequency; ten of eleven rough yeasts exhibited flocculation; none of the strains showed killer activity; and the rough strains presented lower and slower fermentative capacities compared to the smooth strains in a 48-h cycle in a batch system with sugar cane juice. The growth of the rough strain was severely affected by the acid treatment at pH values of 1.0 and 1.5; however, the growth of the smooth strain was not affected. The fermentative efficiency in mixed fermentation (smooth and rough strains in the same cell mass proportion) did not differ from the efficiency obtained with the smooth strain alone, most likely because the acid treatment was conducted at pH 1.5 in a batch cell-recycle test. A fermentative efficiency as low as 60% was observed with the rough colony alone.
Keywords: S. cerevisiae, ethanol, fermentation, indigenous yeasts
Introduction
Despite efforts to search for new microorganisms, the yeast Saccharomyces cerevisiae remains the most utilised for ethanol production in Brazil. It is a robust yeast that is capable of withstanding stressful conditions and has a high fermentation efficiency, rapid growth, effective sugar use, the ability to produce and consume ethanol, tolerance of high ethanol concentrations and low levels of oxygen, osmotolerance, thermotolerance, and cell activity in acidic environments, which are fundamental to its industrial usefulness (Andrietta et al., 2007).
In Brazil, a continuous sugar cane harvest for fuel ethanol production takes place over a seasonal period of approximately 200 days. Very high yeast cell concentrations producing alcohol concentrations of 6–11% (v/v) with short fermentations lasting 6 to 10 h are the main conditions used by Brazilian distilleries. Another peculiarity is the separation of yeast cells from the fermented broth by centrifugation and continuous recycling. The concentrated yeast is treated with diluted sulphuric acid for 1–2 h at pH 2.0–2.5 to kill contaminant bacteria and is then reintroduced into fermentation tanks. The fermented broth is distilled to obtain anhydrous ethanol for fuel (Amorim et al., 2009).
One of the main concerns in the sugar and ethanol industry is how to avoid and remove the contaminant microorganisms, mainly bacteria and wild yeasts (Saccharomyces and non-Saccharomyces), both of which compete with the selected yeast strains to for survival in the fermentors (Cabrini and Gallo, 1999). The peculiarities of the Brazilian fermentation process for ethanol production, specifically, the successive recycling of yeast cells during the sugar cane harvest season and difficulties in sterilising large volumes of juice and water, allow the contaminant microorganisms to enter the process (Amorim et al., 2011).
Contamination by non-Saccharomyces yeasts may be controlled more easily than contamination by indigenous (wild) strains of Saccharomyces because, in the latter case, the strategies used to circumvent the contamination may also affect the industrial yeast strain, as their metabolisms are very similar. In addition, non-Saccharomyces strains are normally eliminated from the process. However, the indigenous Saccharomyces sometimes dominate the process, replacing the intended strain, but this is not always harmful because the fermentative performances of these two strains are often similar (Andrietta et al., 2011). Additionally, Saccharomyces yeasts possess a range of responses to enable survival in deleterious circumstances, including filamentation, invasive growth, flocculation, and biofilm development (Fidalgo et al., 2006), which are undesirable characteristics for the industry. However, there are many reports concerning the successful application of flocculating yeast in the fermentation industry, especially for beer, wine and distilled beverages (Bauer et al., 2010), but for ethanol production, the use of flocculating strains is still limited (Zhao and Bhai, 2009). In any case, the definition of yeast flocculation must be revisited to distinguish between the different flocculent yeast types.
Yeast flocculation is defined as an asexual, homotypic, reversible and multivariate process of cell aggregation to form multicellular masses called flocs, with subsequent rapid sedimentation from the medium in which they are suspended (Stewart 2009; Soares 2010). This process has gained special interest for its biotechnological relevance, and many aspects of this process have recently been reviewed (Zhao and Bhai, 2009; Bauer et al., 2010; Soares 2010). In S. cerevisiae cells, aggregation in the form of sexual aggregation, co-flocculation and cell chain formation should not be confused with flocculation. Of particular interest to the present work, cell chain formation is derived from the failure of a younger bud to separate from its mother cell, resulting in an aggregate formation of approximately 30–50 cells that are covalently linked and present no re-aggregation after mechanical dispersion (Stewart 2009; Soares 2010). This is why the rough variant of S. cerevisiae, which produces chain of cells, will not be referred to as flocculent in this study, although its known property of rapid sedimentation is often termed flocculation.
The colony and cellular morphologies of natural and industrial populations of S. cerevisiae strains vary in response to different environmental stimuli. Variants of smooth colonies exhibiting rough colonies are common in this species. Among one thousand strains grown on YPD medium in a previous study, 2.5% exhibited a rough colony phenotype (Casalone et al., 2005). In Candida albicans, the colony morphology is known to be related to the cell type: smooth colonies contain only blastopores, while rough colonies consist of different proportions of true hyphae and pseudohyphae (Novak et al., 2003). In fact, the formation of pseudohyphae influences the colony morphology, which then appears as a central body from which numerous branches extend (Casalone et al., 2005).
S. cerevisiae strains exhibiting rough colonies and pseudohyphal morphology have been frequently associated with disturbances in the fermentation process, depending on the fermentation system and other operational conditions. However, little is known about their competitive status relative to typical strains of S. cerevisiae (smooth and bright colonies and dispersed cells).
In this context, this work aimed to evaluate strains of S. cerevisiae exhibiting rough colonies and pseudohyphal morphology in comparison to typical strains of this species, with respect to their morphological and physiological characteristics. In particular, their fermentative performance in a batch system with sugar cane juice and exposure to cell recycling and acid treatment, which are conditions similar to industrial conditions, was evaluated. Although these yeast strains are quite common in the alcoholic fermentation environment and the problems resulting from their introduction into the system are well known, the present work is the first scientific contribution to the understanding of their role in the fermentation process. Hopefully, the results of this study may identify possible ways to manage these S. cerevisiae strains during the fermentation when necessary.
Material and Methods
Microorganisms
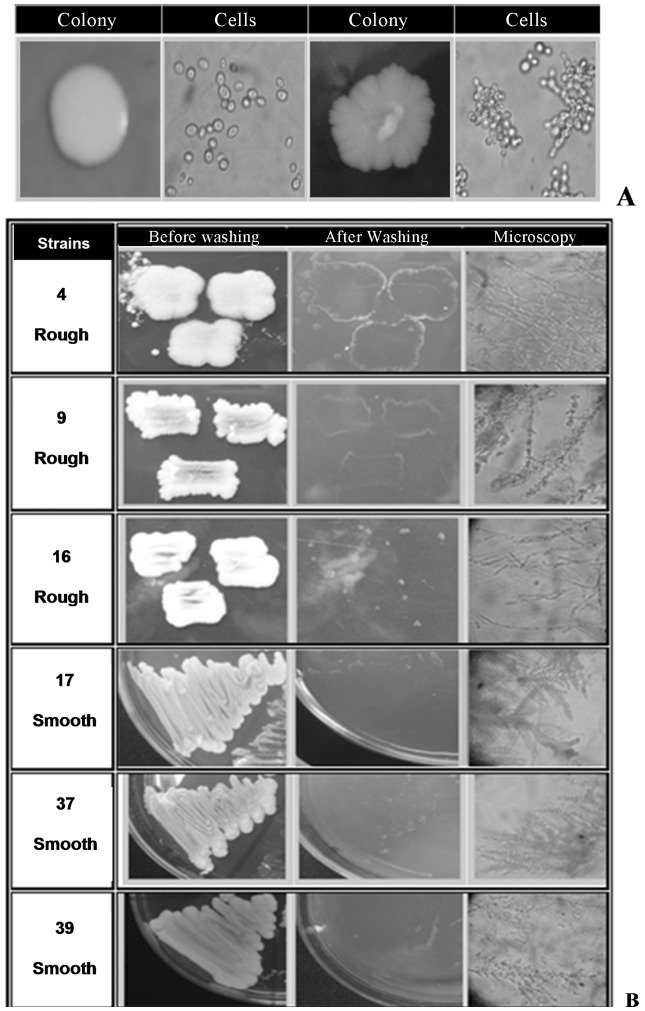
Yeast cultures exhibiting smooth and rough colonies were collected from different ethanol-producing units and submitted to PCR and sequencing of the ITS region using the rDNA primers ITS-1 and ITS-4 (White et al., 1994) to confirm the species as S. cerevisiae, following a previously studied protocol (Reis 2011). The sequences were assembled and compared with sequences at GenBank using the BLAST algorithm. After confirmation, eleven strains exhibiting smooth colonies and dispersed cells (numbers 2, 3, 12, 15, 17, 18, 33, 37, 38, 39 and 47) and eleven strains exhibiting rough colonies and pseudohyphal morphology (numbers 4, 6, 7, 8, 9, 10, 16, 19, 35, 36 and 52) were chosen for the experiments, as illustrated in Figure 1. Intraspecific variation was verified by the amplification of microsatellite loci, confirming that the strains were different (data not shown).
Figure 1.
A. Colony (grown on YPD medium) and cells (400× magnification by optical microscopy) of a smooth colony (left) and a rough colony (right) of S. cerevisiae. B. Strains of S. cerevisiae grown on YPD medium after 3 days at 30 °C and 2 days at room temperature. Aspects of the colonies before washing; after washing, showing the “spots” on agar medium (invasive growth); and a transverse cut of the agar medium after washing, showing cells growing into the agar (100× magnification).
Morphological and physiological characterisation
Invasive growth
The yeast strains were cultivated on YPD medium (10 g/L yeast extract; 20 g/L peptone; 20 g/L glucose; 20 g/L agar) at 30 °C for 3 days, followed by incubation at room temperature for 2 days. The Petri dishes were photographed, and afterwards, the agar surface was washed with distilled water to remove colonies. The dishes were photographed again to verify the presence of colony spots in the agar (a sign of invasive growth into the culture medium). Spots were excised from the agar, placed on slides with water, and coverslipped, and filamentous structures were visualized with an optical microscope at 100× magnification.
Flocculation
The flocculation assay was performed according to Wang et al. (2008), with some modifications. After growth in the multiplication medium (sugar cane juice with around 4% of reducing sugars), the cells were collected by centrifugation, washed twice with sodium citrate buffer (50 mM; pH 3.0) containing 5 mM EDTA and washed again with water at 4 °C. The cells were resuspended in cold distilled water and diluted or concentrated until an OD (600 nm) of 2.0 was reached (Thermo Biomate® spectrophotometer). Flocculation (sedimentation) of the cells was determined in the absence or presence of calcium chloride (10 mM). After vigorous shaking, samples from the upper portion of the tube were taken at 0 and after 10 min, and the OD was determined. The flocculation percentage (%) was calculated as follows: Flocculation (%) = [(OD0min − OD10min) × 100] / OD0min.
Killer character
The yeast strains were tested for production of killer toxins in buffered methylene blue-YPD (citrate-phosphate buffer, pH 4.5–4.7, 3% methylene blue) at 30 °C. The strains to be tested were inoculated by touching sterile toothpicks that had previously been inoculated with the sensitive strains S. cerevisiae NCYC1006 and Torulopsis glabrata ATCC15126 to the surface of the medium. Killer activity was detected when an inhibition zone and/or a blue zone was observed surrounding the test yeast colony.
Fermentative tests in a batch system without cell recycling
The inoculum was prepared in 50-mL Falcon tubes containing 20 mL of multiplication medium inoculated with two loops of the yeast strain. The tubes were incubated at 30 °C, with shaking at 160 rpm, for 12 h. Subsequently, the medium was centrifuged for 5 min at 3,400 rpm, the supernatant discarded, and the cells were resuspended in 5 mL of the multiplication medium, which were inoculated into 125-mL Erlenmeyer flasks containing 45 mL of the same medium and incubated at 30 °C and 160 rpm for 12 h. Subsequently, the entire volume was transferred to 50-mL Falcon tubes (previously sterilised and weighed) and centrifuged under the same conditions. The cells were washed twice with distilled water. After the last wash, the tubes were weighed to estimate the wet mass in grams. A concentration of 10 g of wet mass/Litre of fermentation medium was utilised in a proportion of 20% (v/v) as an inoculum. The inoculum was then suspended in the fermentation medium (constituting of sugar cane juice with approximately 16% w/v of total reducing sugars). The fermentation flasks (500-mL Erlenmeyers containing 200 mL final volume of fermentation medium) were maintained at 30 °C for 48 h. Samples were removed at 12 h intervals and centrifuged. In the supernatant, soluble solids (ºBrix) were determined using a refractometer; the pH was determined using a digital pH-meter; and the alcohol content (g/100 mL) was evaluated in the hydroalcoholic solution using a DMA-45 Anton Paar densitometer after the sample distillation.
Effect of acid treatment on yeast growth
For this test, the yeast strains PE-02 (referred to as 17 in this study) and 52 were selected, representing the smooth and rough colony types of S. cerevisiae, respectively. Cells of each phenotype were cultivated overnight in multiplication medium, followed by centrifugation and transfer of the cell masses to tubes containing diluted sulphuric acid at pH 1.0, 1.5 and 2.0, in triplicate. The tubes were incubated at 30 °C, with shaking at 160 rpm, for 2 h. After the acid treatment, the cells were washed twice with sterile distilled water, inoculated into Erlenmeyer flasks containing multiplication medium and incubated at 30 °C, with shaking at 160 rpm, for 36 h. Samples were taken before the acid treatment, after the acid treatment, and after 18 and 36 h of cultivation in the multiplication medium and inoculated onto Petri dishes with YPD medium. All samples were taken when the yeast cells were suspended in the multiplication medium. After incubation at 30 °C for 72 h, the colonies were counted, and the results were expressed as colony forming units/mL.
Fermentative tests in a batch system with cell recycling
For this test, the yeast strains PE-02 and 52 were selected, representing the smooth and rough colony types of S. cerevisiae, respectively. The strains were utilised in single-strain (pure) and mixed fermentations, using 10 g/L or 1:1 (5 g/L: 5 g/L) cell mass inocula, respectively. The fermentation tests were similar to those described in the section titled “Fermentative tests in a batch system without cell recycling.” However, after the completion of each fermentative cycle (12 h), the cells were recovered by centrifugation (3,400 rpm, 5 min) and treated with sulphuric acid solution, pH 1.5, at 30 °C, with shaking at 160 rpm for 2 h. The cell mass was then washed twice with sterile distilled water and resuspended in fermentation medium to initiate a new fermentative cycle. Six 12-hfermentative cycles were performed, with analysis of the supernatant after each fermentative cycle. Soluble solids (ºBrix) were determined using a refractometer; the pH was determined using a digital pH-meter; and the alcohol content (g/100 mL) was evaluated in the hydroalcoholic solution using a DMA-45 Anton Paar densitometer after the sample distillation. The total amount of reducing sugar was determined by the 3,5-dinitrosalicylic acid method after hydrolysis of the samples. The fermentative efficiency was calculated based on the alcohol content of the fermented medium and the consumption of the total reducing sugar, in relation to the theoretical efficiency of Gay-Lussac (51.11 g ethanol/100 g glucose). Before centrifugation, the fermented broth was plated onto YPD medium (incubation at 30 °C for 72 h) to evaluate the number of smooth and rough colonies.
Statistical analysis
The results were analysed by an analysis of variance and Tukeys test to compare the averages (p < 0.05).
Results and Discussion
Invasive growth
All the selected yeast strains were tested for their ability to grow invasively into YPD medium. Only 6 strains (3 smooth, 3 rough) showed invasive growth, and this feature was not correlated with a particular colony phenotype (Figure 1).
Carbon limitation induces a developmental switch, allowing the cells to penetrate the surface of an agar medium. This is called invasiveness. In response to long incubation periods in rich medium, the concentration of glucose or other fermentable carbon source decreases, and haploid cells of S. cerevisiae elongate and invade the agar to forage for nutrients (Roberts and Fink, 1994; Banuett 1998; Madhani and Fink, 1998; Cullen and Sprague, 2000). Both haploid and diploid industrial strains of S. cerevisiae exhibit invasive growth (Soares, 2010). In the present work, the rough colonies were expected to express invasiveness due to their pseudohyphal morphology, but this result was not found. Casalone et al. (2005) have also observed invasive growth regardless of colony phenotype.
Flocculation
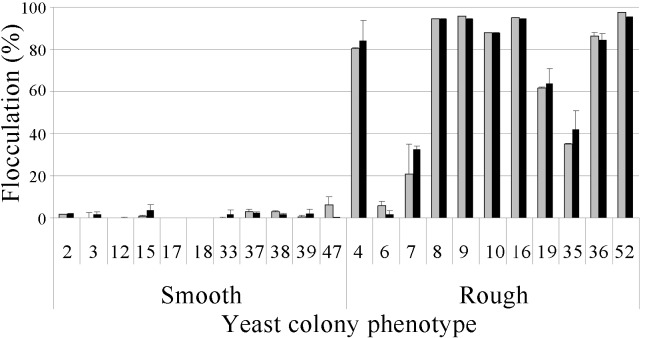
All the yeast strains were grown in multiplication medium (diluted sugar cane juice), and cell flocculation was quantified in the presence or absence of Ca2+ ions. A number of 8 rough strains (4, 8, 9, 10, 16, 19, 36 and 52) showed a high flocculation rate (> 50%) both with and without calcium, and 7 of these strains had a flocculation rate above 80% under these conditions (exception for the strain 19). Another group (strains 6, 7 and 35) showed low flocculation rates (2 to 40%). The smooth colony strains had little or no flocculation (0–6%) regardless of the presence of calcium ions (Figure 2).
Figure 2.
Flocculation (%) of the smooth and rough colony strains of S. cerevisiae in the presence (grey bar) or absence (black bar) of calcium ions.
This characteristic - flocculation - is not desirable for the alcoholic fermentation process because it increases the difficulty of the conversion of sugar to ethanol. To achieve maximum conversion, yeasts must be suspended in the fermentation broth, and the absence of flocculation is essential (Ludwig et al., 2001). Yeast flocculation is one of the worst problems for a fermentation process with cell recycling by centrifugation. This phenomenon causes a loss of cells in the centrifugation step, and consequently, the growth substrate is diverted to cell regrowth, causing a decrease in the alcohol yield (Amorim et al., 2011).
This type of yeast strain (rough colony, pseudohyphal morphology) is sometimes called flocculent yeast. However, this does not follow the definition of flocculation, despite the sedimentation of cells to the bottoms of the flasks. These cell aggregates result from the inability of the buds to separate from the mother cell after cell division. This is different from the flocculation caused by environmental conditions and their interactions with the yeast cell wall. The presence of adhesins decorating the cell wall is a major requirement for true flocculation at the end of fermentation by brewing yeasts (van Mulders et al., 2010). An extreme variation in the pH of the medium (Soares 2010) or the addition of special enzymes such as papain causes the release of the cells clustered in aggregates. These treatments do not affect the condition of cell aggregates formed by the strains studied here. There is a multiplicity of factors that affect flocculation, including cations, pH, temperature, oxygen, sugars, ethanol, genealogical and cultural age, cell density and mechanical agitation (Soares 2010), which do not affect the rough colonies that exhibit pseudohyphal morphology. The addition of calcium ions was not relevant to promote increased flocculation in the rough colonies, as it is required for the ‘true’ flocculent yeasts, over a broad range of pH (Stratford 1989). Interestingly, the yeasts with the phenotype of rough colonies can also float at the top of fermentors, constituting a scum, which results in the entrapment of CO2 inside the tank and the possibility of medium release with loss of sugar and ethanol. Indeed, Saccharomyces “flor” (Spanish and Portuguese for “flower”) yeasts are among the most tolerant organisms to ethanol and are able to produce a biofilm (velum) that has acquired the ability to float, which is probably an adaptation to the extreme selective pressures imposed by the conditions inside sherry wine barrels. These yeast cells are strongly aggregated, showing a flocculation phenotype (Fidalgo et al., 2006).
Killer phenotype
The yeasts were also evaluated for production of killer toxins, but none of the strains, regardless of whether they formed smooth or rough colonies, produced killer toxins that inhibited the sensitive yeast strains under the conditions utilised in this study (data not shown). Two strains of S. cerevisiae isolated from an ethanol fermentation plant and exhibiting rough colonies and pseudohyphal morphology similarly displayed a neutral reaction to a group of standard killer strains at several pH values (Ceccato-Antonini et al., 1999). A study of 165 flocculent yeasts found that only 3% were killer toxin producers (Steckelberg and Andrietta, 2011). These authors credited this result to the harsh conditions found in their fermentation tanks (high acidity and alcohol content), which could impair toxin activity. However, Ceccato-Antonini et al. (2004) described a strain isolated from the fermentative process that possessed high killer activity against other yeasts and exhibited killer activity throughout the fermentative cycle, regardless of unfavourable conditions.
Fermentative tests in a batch system without cell recycling
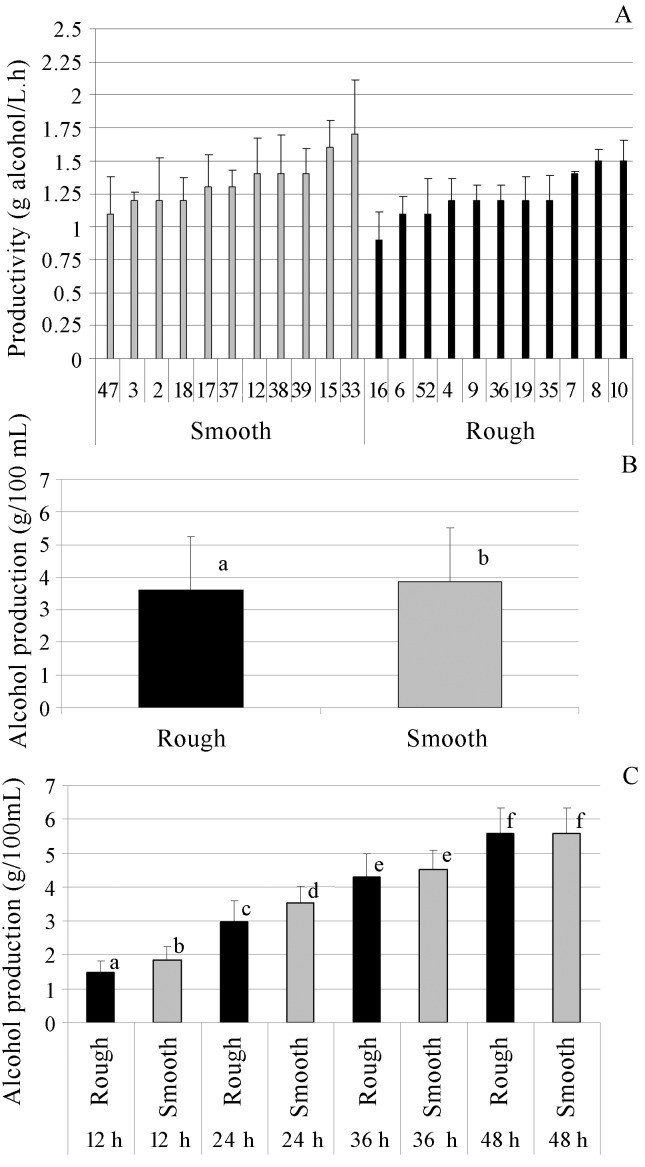
The fermentative capabilities of the rough and smooth colonies of S. cerevisiae were analysed in a batch system without cell recycling. The data for ethanol productivity shown in Figure 3 illustrate the average productivity displayed by each strain during the 48-hfermentation test. The range in the ethanol productivity for the smooth colonies was 1.1–1.7 g/L.h, while that for the rough colonies was 0.9–1.5 g/L.h, showing similar variability within each particular colony phenotype and an overall superiority in ethanol productivity displayed by smooth colonies. Values of ethanol productivity ranging from 2.22 to 2.84 g/L.h were found for 19 yeast strains isolated from Brazilian distilleries belonging to the Saccharomyces sensu stricto group, with high variability in the kinetics among the strains (Andrietta et al., 2007).
Figure 3.
A. Average productivity (g alcohol/L.h); B, C. Average alcohol production (g/100 mL) by rough and smooth colonies (total of 22 strains) of S. cerevisiae, over the entire period of fermentation (48 h) and throughout the course of fermentation, respectively. The experiments were carried out in sugar cane juice, 16ºBrix, pH 4.3, during 48 h of fermentation at 30 °C. Different letters above the bars denote significant differences at 5% by Tukeys test.
An overall view of ethanol production by the two colony phenotypes of S. cerevisiae showed that the smooth colonies yielded a significantly higher alcohol content in the fermented must compared with the rough colonies. Indeed, it was observed that the alcohol content was higher for the smooth colonies than for the rough colonies after 12 and 24 h of fermentation. However, at 36 and 48 h of fermentation, there was no significant difference between the two colony phenotypes. A slower rate of fermentation was observed for rough colonies of S. cerevisiae compared to the smooth colonies.
Effect of acid treatment on yeast growth
To reduce bacterial contamination when fermentation ceases, yeast cells are centrifuged to produce a yeast “cream,” consisting of 60–70% (wet weight basis/v) cells. This yeast suspension is diluted with water (1:1) and treated with sulphuric acid at pH 1.8–2.5 for 2 h with agitation. The yeast cream is ready to be re-used as a starter for a subsequent fermentation cycle. This recycling is a peculiar trait of the Brazilian process over a production season that lasts for 200–250 days (Basso et al., 2008).
Despite yeasts’ relative tolerance to low pH, the acid treatment can cause physiological disturbances in yeast cells, with mineral leakage and decreasing levels of intracellular trehalose, resulting in decreased cell viability (Ferreira et al., 1999). Of particular interest is the evaluation of whether a differential sensitivity to low pH can be found between the rough and smooth colony types of S. cerevisiae in order to manage the contaminant strains with rough colonies during the acid treatment step. A previous study (Reis 2011) using the same group of yeasts utilised here has shown that only one rough strain (strain 36) is able to grow in YPD Agar medium with pH values of 1.25 and 1.5, while ten other strains did not display any growth under these conditions. On the other hand, three smooth colony strains were able to grown in this range of pH values, including the industrial strain PE-02. This result led to the study of the effect of a harsher acid treatment to control the growth of the rough colony strain.
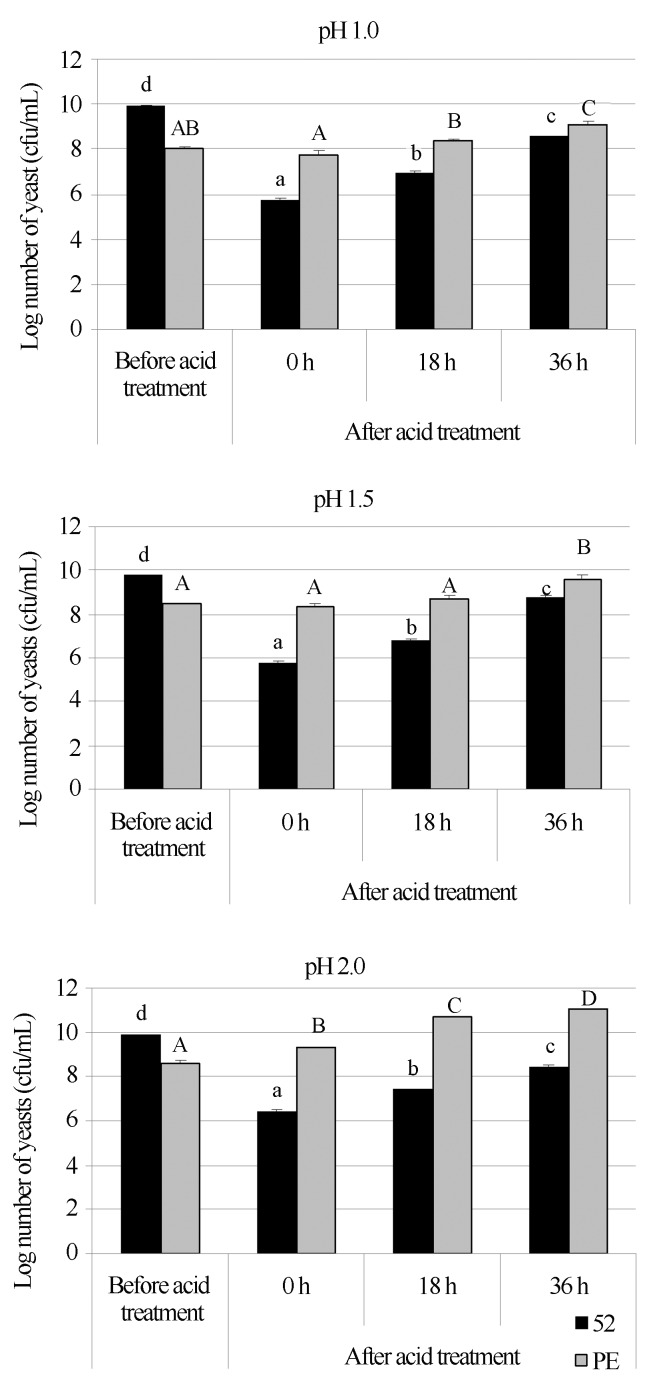
For this test, the strains 17 (smooth) and 52 (rough) were chosen to verify the effect of acid treatment on their growth. The first strain (PE-02), is a yeast strain selected for its dominance and persistence throughout the entire harvest season (Basso et al., 2008) and for its high resistance to low pH (Reis 2011); the second strain was chosen because it has a high flocculation rate, as described above, and had resistance to high sugar concentrations and sensitivity to low pH (Reis 2011). The results showed that the rough strain was severely affected by pH values as low as 1.0 and 1.5, with significant decrease in the number of colony forming units. There was a recovery in growth when the yeast was transferred to multiplication medium (sugar cane juice) after the acid treatment. However, the initial number of colonies before the treatment was not reached (Figure 4).
Figure 4.
Growth (cfu/mL) of two yeast strains of S. cerevisiae (52, in black, rough colony; PE-02, in grey, smooth colony), submitted to acid treatment with sulphuric acid at different pH values (1.0, 1.5 and 2.0) at 30 °C for 2 h at 160 rpm. The determination of cfu numbers (in YPD medium) was performed before the acid treatment, immediately after the acid treatment (0 h) and after 18 and 36 h of incubation of the treated cells in multiplication medium (sugar cane juice), at 30 °C and 160 rpm. Different capital and lowercase letters indicate significant differences (p < 0.05) among the treatments for the smooth colony and rough colony, respectively.
Different results were obtained for the smooth strain (PE-02). This yeast strain did not show significant decrease in the growth after the acid treatment, but in pH 1.0; however, a significant increase in the number of colonies was observed after the acid treatment in pH 2.0. After 36 h of incubation in multiplication medium, the cells treated with sulphuric acid produced an increased number of colonies relative to the initial value (before the treatment), as shown in Figure 4.
These results suggest a satisfactory strategy to control contamination by a rough strain of S. cerevisiae. Lowering the pH value from 2.0 (which is commonly utilised in industrial conditions (Amorim et al., 2011) to 1.5, for example, would result in low numbers of this contaminant yeast inside the fermentation tanks without impairing the primary yeast (here represented by PE-02). The growth recovery of the rough strain after treatment occurred over a longer period of time than that which elapses in a typical fermentative cycle (normally between 8–10 h).
Fermentative tests in a batch system with cell recycling
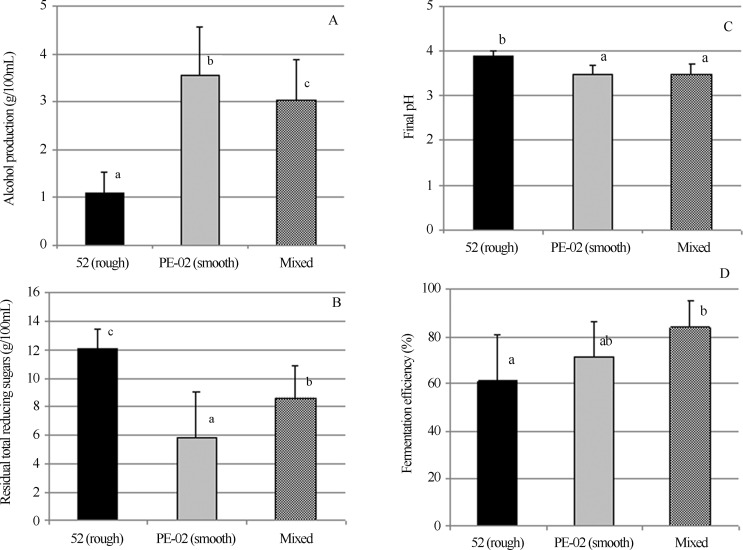
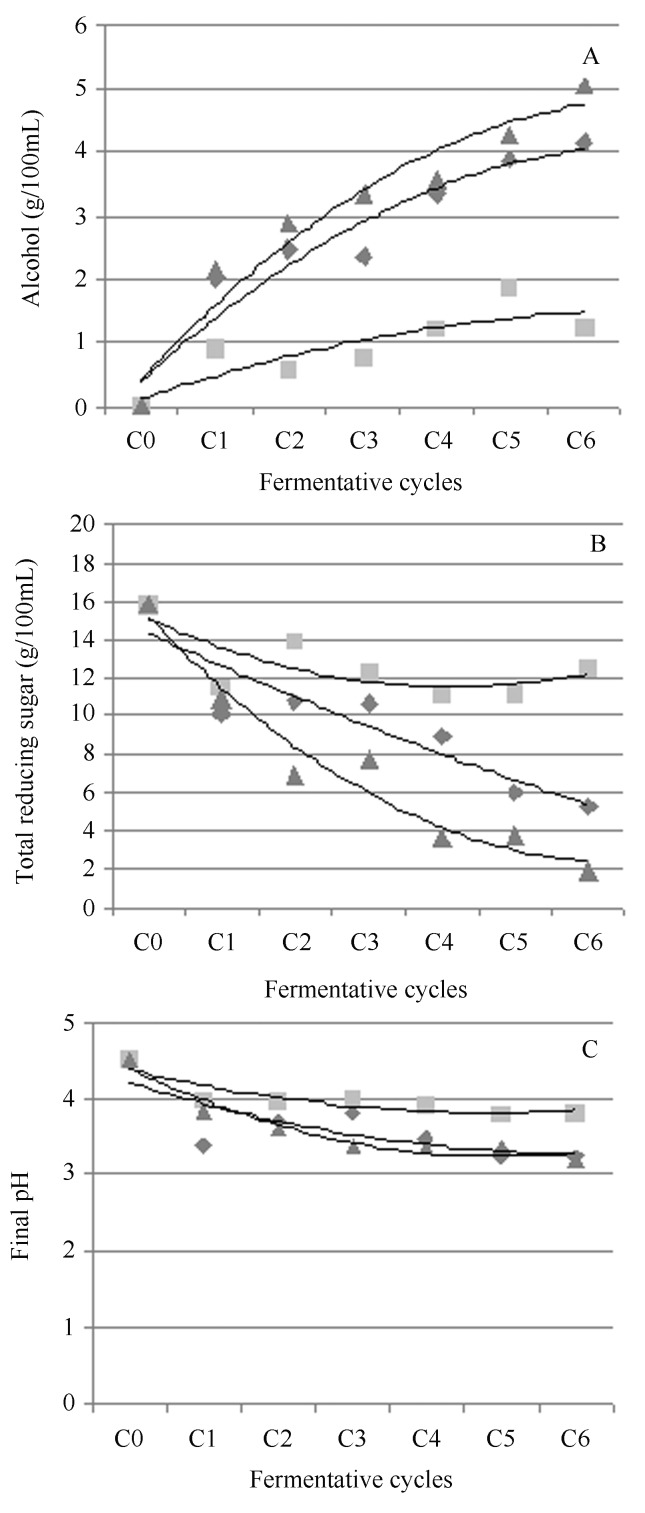
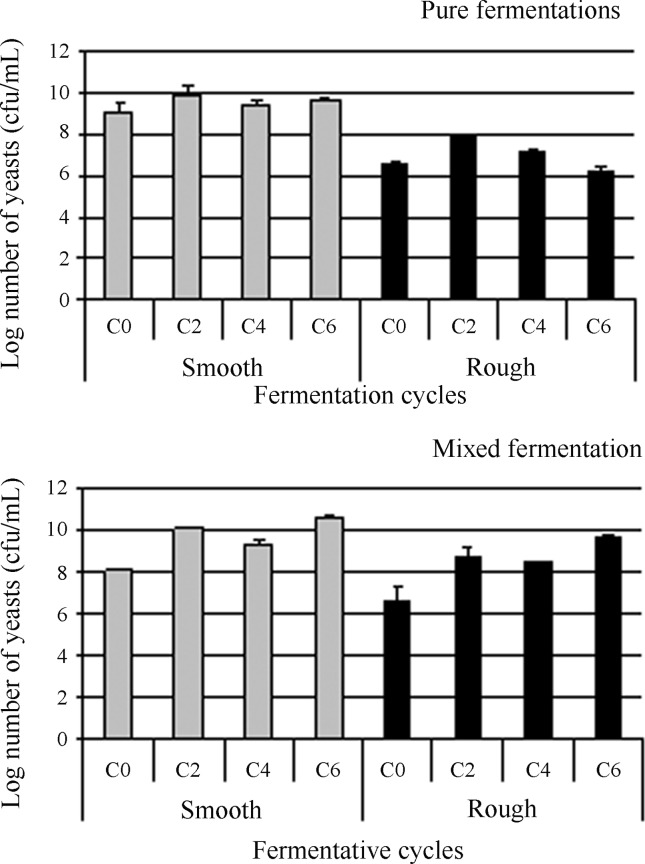
The same yeast strains as above were utilised in this experiment, which was conducted in a batch system with cell recycling and acid treatment of the yeast cells. The results are depicted in Figures 5, 6 and 7.
Figure 5.
Effect of the yeast strain (52, rough; PE-02, smooth; and mixed) on alcohol content (A), total reducing sugars (B), final pH (C) and fermentative efficiency (D) in fermentations carried out in sugar cane juice, 16% (w/v) total reducing sugars, pH 4.3, at 30 °C, over six 12-hfermentative cycles, with acid treatment of the yeast cells (at pH 1.5). Different letters above the bars denote significant differences at 5% by Tukeys test. The values are the means of six fermentative cycles.
Figure 6.
Alcohol content (A), total reducing sugars (B) and final pH (C) in fermentations with strains of S. cerevisiae (52, rough strain n; PE-02, smooth strain ▲; and mixed ◆) in sugar cane juice, 16% (w/v) of total reducing sugars, pH 4.3, at 30 °C, over six 12-h fermentative cycles, with acid treatment of the ferment (at pH 1.5). “C0” signifies the start of the fermentation cycles. Other samples were taken at the end of the fermentation cycles.
Figure 7.
Concentration of yeasts (cfu/mL) during fermentations conducted in sugar cane juice inoculated with the S. cerevisiae strains 52 (rough colony, in black) and PE-02 (smooth colony, in grey), in pure (A) and mixed fermentations (B), over six 12-h fermentative cycles, 16% (w/v) of total reducing sugars, pH 4.3, at 30 °C, with acid treatment of the ferment (at pH 1.5). The yeast counts were performed on YPD medium. “C0” signifies the start of the fermentation cycles. Other samples were taken at the end of the fermentation cycles.
The fermentation with the rough strain showed a lower ethanol production, a higher concentration of residual sugar and a fermentative efficiency of approximately 60%. In the mixed fermentation with rough and smooth strains (equal amounts of cell mass of each strain in the initial fermentation cycle), a significantly higher production of ethanol was observed relative to the rough strain alone. However, this ethanol production was lower than that found with the smooth strain alone. The fermentative efficiency of the mixed fermentation was similar to the fermentation with PE-02 alone, but different from that of the rough strain alone. These results corroborate those obtained for fermentation over a single 48-hcycle, in which the rough strain showed a fermentative behaviour similar to that of the smooth strain, but only after 36 h of fermentation. In a batch system with cell recycling at every 12 h of fermentation, the rough yeast was not able to complete the fermentation and consume all the available sugars (Figure 5).
The profile displayed by the rough strain, including slow fermentation, high residual sugar concentrations and lower fermentative efficiency has been frequently correlated with contamination by this type of S. cerevisiae colony phenotype (data not shown). The cell morphology, with clusters or flocs, becomes the contact cell - nutrients more difficult, which in turns affects the fermentation. A floc, when suspended in a liquid medium, presents a negative gradient of nutrients from the periphery to the centre. Nutrient limitation and waste product accumulation are problems suffered by the cells in the centre of the floc (Soares, 2010).
The protection guaranteed to the cells within flocs, which increase survival rates, must also be considered (Smukalla et al., 2008). This protection is a particularly important characteristic conferring additional adaptability to the rough colonies in the fermentation system.
Indigenous Saccharomyces species are more difficult to control than non-Saccharomyces species during fermentation because the metabolism of the former is very similar to that displayed by the selected yeast strain, although they carry undesirable features such as flocculation, low fermentation yield and incomplete sugar consumption (Basso et al., 2008), as observed in this work for rough S. cerevisiae strains. At present, there is no product or process that can be utilised to avoid or reduce contaminations by indigenous Saccharomyces without affecting the selected yeast strain (Amorim et al., 2011). In this regard, a particular sensitivity towards a specific condition could be employed to manage the growth of these contaminants, and as shown in this work, a differential sensitivity to lower pH may prove useful for the fermentation industry.
The final pH of the fermentation broth was statistically similar to or significantly lower than that when the mixed culture of both yeasts or the pure culture of the smooth strain was utilised, respectively, and both were significantly different from the pH obtained with the pure culture of the rough strain. The lower pH reflects a more efficient fermentation (Figure 6).
Concerning yeast growth during the fermentation process, the smooth strain showed the same growth performance both in a pure culture and in a mixed culture with the rough strain. However, the rough strain displayed a different growth profile comparing pure and mixed fermentations. The initial number of colonies was approximately similar in pure and mixed fermentations for each strain. However, for the pure fermentation with the rough colony, there was an increase in growth only until the second fermentative cycle. In the mixed culture, an increase in the colony number was not only until the second fermentation cycle, but also further (Figure 7). An important point should be emphasised concerning the growth monitoring of rough colonies. Equal proportions of cell mass for each colony phenotype were added to the fermentation medium at the start of the fermentation. However, the number of colonies is different between the strains because, for the rough colonies, a group of cells (pseudohyphae) will generate only one colony, so that the number of colonies will always be lower than the number of yeast cells.
In the mixed fermentation, the sugar consumption was lower and slower than the pure culture of the smooth strain, indicating the effect of contamination by the rough strain. The latter may have utilised the sugar for biomass production, as its growth increased along the fermentative cycles, resulting in lower alcohol production. This growth behaviour was not observed in the pure culture of the rough strain, which may indicate that the smooth strain was more efficient in sucrose hydrolysis, releasing reducing sugars as glucose and fructose, which are readily utilised by the rough strain at a slower rate. This point requires more investigation. In pure and mixed cultures, the growth of the smooth strain had approximately the same profile (Figure 7).
The question that arises is whether and to what extent the acid treatment at pH 1.5 was effective in controlling the rough strain’s growth. The results described in the last paragraph showed that growth of the rough strain was effectively inhibited by treatment at pH 1.5, which did not occur with the smooth strain. In view of this result, greater rough strain growth would be expected if the acid treatment were not performed or if a less stressful condition was adopted. In fact, the overall fermentative efficiency was not affected by contamination with the rough strain (in equal amounts of cell mass of rough and smooth strains at the initial step), despite the significantly greater residual sugar concentration in the mixed fermentation.
Metabolic functions associated with this type of colony variant have been seldom studied. Comparisons among strain M28 (a natural isolate from Tuscany, Italy) and its colony variants (filigreed, rough and smooth), which segregated from a single tetrad, showed that all of the segregants were vigorous; however, there were differences in the gene expression patterns among them. The ammonia permease MEP2 had the greatest affinity for ammonia and was most prominently overexpressed in the rough segregants, while amino acid transporters were abundantly expressed in the smooth strains (Cavalieri et al., 2000). However, there was no detectable difference among growth rates of any progeny. Given the different metabolic profiles observed, their fitness may differ under other, non-nutrient-rich conditions that require further investigation (Landry et al., 2006).
Shorter fermentation time and an increased number of cell recycles must also be considered because although alcoholic fermentation is a well-known process, little is known about the response of yeasts to the stress conditions adopted by Brazilian distilleries, which do not occur in other fermentation processes (Amorim et al., 2011). An understanding of how the stress factors affect the contaminant yeasts without affecting the primary strain remains a challenge, but the use of stress factors is undoubtedly a way to manage yeast contamination during the process. In this context, the contribution of the present work is to show that the wild S. cerevisiae yeast strain that displays rough colonies, pseudohyphal morphology and a high flocculation rate is a slow-fermenting strain, causing low yields of alcohol in the fermentation system adopted by Brazilian industries, which utilises cell recycling after a short fermentation period of less than 8–12 h (Basso et al., 2011). Contamination with this yeast strain results in lower ethanol production and higher residual sugar concentration, but a more drastic acid treatment between the cell recycling periods (pH 1.5) could avoid the more harmful effects of the contamination. Other levels of contamination should be tested to verify the acceptable number of rough strain cells that result in little or no effect upon the fermentation yield.
Acknowledgments
This study was supported by FAPESP (fellowship grants to A.P.G. Bassi and J.C.G. Silva and research support 2009/14617-4) and CAPES (fellowship grant to V.R. Reis).
References
- Amorim HV, Lopes ML, Oliveira JVC, Buckeridge MS, Goldman GH. Scientific challenges of bioethanol production in Brazil. Appl Bioch Biotech. 2011;91:1267–1275. doi: 10.1007/s00253-011-3437-6. [DOI] [PubMed] [Google Scholar]
- Amorim Neto HB, Yohannan BK, Bringhurst TA, Brosnan JM, Pearson SY, Walker JW, Walker GM. Evaluation of a Brazilian fuel alcohol yeast strain for scotch whisky fermentations. J Inst Brew. 2009;115:198–207. [Google Scholar]
- Andrietta MGS, Andrietta SR, Steckelberg C, Stupiello ENA. Bioethanol - 30 years of Proálcool. Int Sugar J. 2007;109:195–200. [Google Scholar]
- Andrietta MGS, Andrietta SR, Stupiello ENA. Bioethanol - what has Brazil learned about yeasts inhabiting the ethanol production processes from sugar cane? In: Bernardes MAS, editor. Biofuel production - recent developments and prospects. InTech; Rijeka: 2011. pp. 67–84. [Google Scholar]
- Banuett F. Signalling in the yeast: an informational cascade with links to the filamentous fungi. Microbiol Mol Biol. 1998;62:249–274. doi: 10.1128/mmbr.62.2.249-274.1998. [DOI] [PMC free article] [PubMed] [Google Scholar]
- Basso LC, Amorim HV, Oliveira AJ, Lopes ML. Yeast selection for fuel ethanol production in Brazil. FEMS Yeast Res. 2008;8:1155–1163. doi: 10.1111/j.1567-1364.2008.00428.x. [DOI] [PubMed] [Google Scholar]
- Basso LC, Basso TO, Rocha SN. Ethanol production in Brazil: the industrial process and its impact on yeast fermentation. In: Bernardes MAS, editor. Biofuel production - recent developments and prospects. InTech; Rijeka: 2011. pp. 85–100. [Google Scholar]
- Bauer FF, Govender P, Bester MC. Yeast flocculation and its biotechnological relevance. Appl Microbiol Biotechnol. 2010;88:31–39. doi: 10.1007/s00253-010-2783-0. [DOI] [PubMed] [Google Scholar]
- Cabrini KT, Gallo CR. Identificação de leveduras no processo de fermentação alcoólica em usina do estado de São Paulo, Brasil. Sci Agric. 1999;56:207–216. [Google Scholar]
- Casalone E, Barberio C, Cappellini L, Polsinelli M. Characterization of Saccharomyces cerevisiae natural populations for pseudohyphal growth and colony morphology. Res Microbiol. 2005;156:191–200. doi: 10.1016/j.resmic.2004.09.008. [DOI] [PubMed] [Google Scholar]
- Cavalieri D, Townsend JP, Hartl DL. Manifold anomalies in gene expression in a vineyard isolate of Saccharomyces cerevisiae revealed by DNA microarray analysis. PNAS. 2000;97:12369–12374. doi: 10.1073/pnas.210395297. [DOI] [PMC free article] [PubMed] [Google Scholar]
- Ceccato-Antonini SR, Cremonini LCM, Regenfuss C. Killer character of yeast isolated from ethanolic fermentations. Sci Agric. 1999;56:631–635. [Google Scholar]
- Ceccato-Antonini SR, Tosta CD, Silva AC. Determination of yeast killer activity in fermenting sugarcane juice using selected ethanol-making strains. Braz Arch Biol Technol. 2004;47:13–23. [Google Scholar]
- Cullen PJ, Sprague GF., Jr Glucose depletion causes haploid invasive growth in yeast. PNAS. 2000;97:13619–13624. doi: 10.1073/pnas.240345197. [DOI] [PMC free article] [PubMed] [Google Scholar]
- Ferreira LV, Amorim HV, Basso LC. Fermentação de trealose e glicogênio endógenos em Saccharomyces cerevisiae. Cienc Tecnol Aliment. 1999;19:29–32. [Google Scholar]
- Fidalgo M, Barrales RR, Ibeas JI, Jimenez J. Adaptive evolution by mutations in the FLO11 gene. PNAS. 2006;103:11228–11233. doi: 10.1073/pnas.0601713103. [DOI] [PMC free article] [PubMed] [Google Scholar]
- Landry CR, Townsend JP, Hartl DL, Cavalieri D. Ecological and evolutionary genomics of Saccharomyces cerevisiae. Mol Ecol. 2006;15:575–591. doi: 10.1111/j.1365-294X.2006.02778.x. [DOI] [PubMed] [Google Scholar]
- Ludwig KM, Oliva-Neto P, Angelis DF. Quantificação da floculação de S. cerevisiae por bactérias contaminantes da fermentação alcoólica. Cienc Tecnol Aliment. 2001;21:63–68. [Google Scholar]
- Madhani HD, Fink GR. The control of filamentous differentiation and virulence in fungi. Trends Cell Biol. 1998;8:348–353. doi: 10.1016/s0962-8924(98)01298-7. [DOI] [PubMed] [Google Scholar]
- Novak A, Vágvolgyi C, Pesti M. Characterization of Candida albicans colony-morphology mutants and their hybrids. Folia Microbiol. 2003;48:203–209. doi: 10.1007/BF02930957. [DOI] [PubMed] [Google Scholar]
- Reis VR. M.Sc. Dissertation. ESALQ/USP; 2011. Caracterização de linhagens selvagens de Saccharomyces cerevisiae isoladas de processos fermentativos para produção de etanol. Piracicaba-SP, Brasil; p. 89. [Google Scholar]
- Roberts RL, Fink GR. Elements of a single MAP kinase cascade in Saccharomyces cerevisiae mediate two developmental programs in the same cell type: mating and invasive growth. Genes Dev. 1994;8:2974–2985. doi: 10.1101/gad.8.24.2974. [DOI] [PubMed] [Google Scholar]
- Silva PC, Horii J, Miranda VS, Brunetto HG, Ceccato-Antonini SR. Characterization of industrial strains of Saccharomyces cerevisiae exhibiting filamentous growth induced by alcohols and nutrient deprivation. World J Microbiol Biotechnol. 2006;23:697–704. [Google Scholar]
- Smukalla S, Caldara M, Pochet N, Beauvais A, Guadagnini S, Yan C, Vinces MD, Jansen A, Prevost MC, Latge JP, Fink GR, Foster KR, Verstrepen KJ. FLO1 is a variable green beard gene that drives biofilm-like cooperation in budding yeast. Cell. 2008;135:726–737. doi: 10.1016/j.cell.2008.09.037. [DOI] [PMC free article] [PubMed] [Google Scholar]
- Soares EV. Flocculation in Saccharomyces cerevisiae: a review. J Appl Microbiol. 2010;110:1–18. doi: 10.1111/j.1365-2672.2010.04897.x. [DOI] [PubMed] [Google Scholar]
- Steckelberg C, Andrietta MGS. Caracterização do fator killer para linhagens floculantes de Saccharomyces sensu stricto isoladas de processos brasileiros de produção de etanol. XVIII Simpósio Nacional de Bioprocessos; Caxias do Sul, RS, Brazil. 2011. [Google Scholar]
- Stewart GG. The Horace Brown Medal lecture: forty years of brewing research. J Inst Brew. 2009;115:3–29. [Google Scholar]
- Stratford M. Yeast flocculation: calcium specificity. Yeast. 1989;5:487–496. [Google Scholar]
- van Mulders S, Ghequire M, Daenen L, Verbelen PJ, Verstrepen KJ, Delvaux FR. Flocculation gene variability in industrial brewers yeast strains. Appl Microbiol Biotechnol. 2010;88:1321–1331. doi: 10.1007/s00253-010-2843-5. [DOI] [PubMed] [Google Scholar]
- Wang FZ, Shen W, Rao ZM, Fang HY, Zhan XB, Zhuge J. Construction of a flocculating yeast for fuel ethanol production. Biotechnol Lett. 2008;37:97–102. doi: 10.1007/s10529-007-9503-6. [DOI] [PubMed] [Google Scholar]
- White TJ, Bruns T, Lee S, Taylor J. Amplification and direct sequencing of fungal ribosomal RNA genes for phylogenetics. In: Innis MA, Gelfand DH, Sninsky JJ, White TJ, editors. PCR protocols: a guide to methods and applications. Academic Press; New York: 1994. pp. 315–321. [Google Scholar]
- Zhao XQ, Bhai FW. Yeast flocculation: new story in fuel ethanol production. Biotechnol Adv. 2009;27:849–856. doi: 10.1016/j.biotechadv.2009.06.006. [DOI] [PubMed] [Google Scholar]


