Abstract
High failure rates of cobalt-chromium-molybdenum (Co-Cr-Mo) metal-on-metal hip prosthesis were reported by various authors, probably due to the alloy's limited hardness and tribological properties. This thus caused the popularity of the alloy in metal-on-metal hip replacements to decrease due to its poor wear properties when compared with other systems such as ceramic-on-ceramic. S-phase surface engineering has become an industry standard when citing surface hardening of austenitic stainless steels. This hardening process allows the austenitic stainless steel to retain its corrosion resistance, while at the same time also improving its hardness and wear resistance. By coupling S-phase surface engineering, using the proprietary Kolsterising® treatment from Bodycote Hardiff GmbH, that is currently being used mainly on stainless steel, with Co-Cr-Mo alloys, an improvement in hardness and tribological characteristics is predicted. The objective of this paper is to analyze the biocompatibility of a Kolsterised® Co-Cr-Mo alloy, and to characterize the material surface in order to show the advantages gained by using the Kolsterised® material relative to the original untreated alloy, and other materials. This work has been performed on 3 fronts including; Material characterization, “In-vitro” corrosion testing, and Biological testing conforming to BS EN ISO 10993–18:2009 - Biological evaluation of medical devices. Using these techniques, the Kolsterised® cobalt-chromium-molybdenum alloys were found to have good biocompatibility and an augmented corrosion resistance when compared with the untreated alloy. The Kolsterised® samples also showed a 150% increase in surface hardness over the untreated material thus predicting better wear properties.
Keywords: Co-Cr-Mo alloys, Cytocompatibility, Expanded Austenite, Kolsterising®, S-phase, XTT, biocompatibility, corrosion, nano-indentation
Introduction
Orthopedic applications to material science is increasingly becoming one of the most important areas of research, especially during the past 50 years “where materials intended for biomedical purposes have evolved through three different generations.”1 Materials used for making load-bearing implants must be mechanically strong and have a high impact resistance.2 They must possess high resistance to corrosion and wear to prevent weakening of the mechanical strength and the release of potentially dangerous metallic ions or debris in the human body. Importantly, implantable materials must exhibit natural biocompatibility to minimize allergic immune reactions, which could eventually compromise fixation of the implant and reduce its load-bearing capacity.3 Smith et al.4 prove that current metal-on-metal total hip replacements (THR) have poorer implant survival in the medium term than other bearing surfaces. Other authors5 have also commented regarding the problems associated with ion release from Co-Cr-Mo implants. Our hypothesis suggests that by increasing the surface hardness of the alloy, mimicking the properties of ceramic-on-ceramic systems, a lower number of failures of metal-on-metal (MoM) hip replacements will be reported.
Cobalt based MoM bearings were first used in 1938 and then re-introduced in the 1950s and 1960s.6 The implants during this time period had very unstable survivability, but those which survived showed very low wear. The second generation of Co alloy MoM prosthesis were re-introduced in the early 1990s. These prosthesis performed well and had lower wear than the previous generation implants. The final, third generation implants, were then designed with larger acetabular cups and femoral heads, and word of their early success was widely accepted.6 These days however, Smith et al.4 shed doubt on the actual survivability of these third generation MoM implants. Pandit et al.7 along with other authors8 claim that the wear particles from the bearing surfaces of the implants lead to bone necrosis and bone loss. The reason cited is because particles released from the hip joint are absorbed into the cell through the cell membrane, and are addressed by lysosomes as cell debris. On contact with these acidic lysosomes, particles corrode releasing high levels of ions and toxic products, such as IL-6. IL-6 itself stimulates osteoclast formation which then destroys the bone by removing its mineralized matrix, thus leading to bone decay and eventual loss.6,9
By introducing a carbon diffusion layer into the surface of the untreated sample while using parameters such that sensitization does not occur; an increase surface hardness is obtained while retaining/improving the corrosion resistance and biocompatibility. This diffusion layer is often termed S-phase or expanded austenite phase. It seems that only three studies exist on the in-vitro biocompatibility of S-phase. Buhagiar et al.10 and Bordji et al.11 use osteoblasts and test the biocompatibility of S-phase produced on austenitic stainless steels. Martinesi et al.12 use human umbilical vein endothelial cell (HUVEC) and peripheral blood mononuclear cells (PBMC) to carry out in-vitro biocompatibility on S-phase produced on an austenitic stainless steel. Marinesi et al.12 have shown that a significant decrease in proliferation and an increase in apoptosis only in the case when evaluating nitrided and oxidised (sequential) samples. This was observed both on the HUVEC and PBMC cell lines.12
Buhagiar et al.10 used the MC3T3-E1 cell line while Bordji et al.11 used primary human cells (osteoblasts and fibroblasts) derived directly from patients during prosthetic operations. Buhagiar et al.10 show excellent in-vitro biocompatibility of S-phase formed by low temperature plasma-nitriding, -carburising and -carbonitriding. They also manage to prove that cell attachment on the treated samples is better than cell attachment on the untreated samples. Reasons for this were speculated to be the concentration of interstitial elements present in the S-phase, which were therefore not present in the untreated material.
On the other hand, Bordji et al.11 comment that both the osteoblast and fibroblast cells were shown to have given good results, as regards to cell proliferation on nitrogen implanted and carbon doped stainless steel surfaces. This is contrary to what the same authors11 observed when the surface of the stainless steel was plasma nitrided at 410 °C. This treatment seemed to be cytoincompatible to the cells being tested, especially when considering (1) lack of cell attachment, which was evaluated by considering the production of collagen I and (2) the decrease in cell viability after day 6.11
In general all three studies have shown encouraging results as to the cytocompatibility of S-phase produced on austenitic stainless steel. The biocompatibility of Co-Cr and Co-Cr-Mo alloys was often evaluated by other authors, and this was found to be satisfactory.13,14 However, the biocompatibility and cytocompatibility of S-phase on Co-Cr-Mo alloys has never been investigated and for this reason forms part of the aim of the present work.
Kolsterising® is a surface treatment process which induces S-phase in stainless steel parts. This paper aims to apply Kolsterising® to Co-Cr-Mo alloys, in order to induce a similar S-phase layer. This layer would then be analyzed in order to characterize the: surface hardness, thickness, composition, phase, corrosion resistance and cytocompatibility.
Results
Mechanical properties
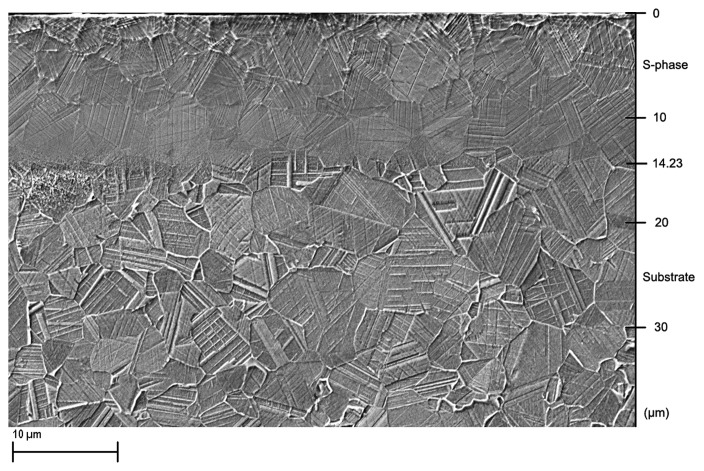
Figure 1 shows scanning electron microscope (SEM) images of the etched cross section, of the Kolsterised® ESR (Electro Slag Remelted) sample. An S-phase layer is present, where an un-etched region is present in the first 14 µm from the surface. The failure of the grains to etch in this region gives a good indication of the high corrosion resistance of the S-phase. In Figure 1 dark areas are present toward the surface of the S-phase, i.e., within the first 5 µm. The S-phase in this region can be seen to have etched more than the rest of the remaining S-phase.
Figure 1. In-lens SEM image of etched S-phase layer, showing mild etching close to the surface in the first 14 µm of the sample cross section, below which resides the etched substrate Co-Cr-Mo alloy.
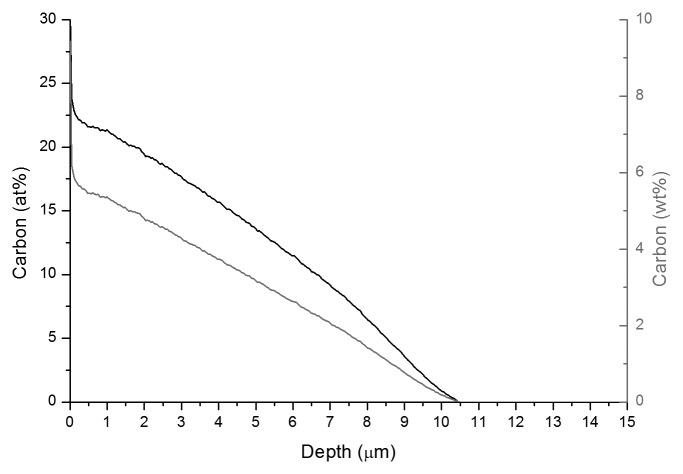
A glow discharge optical emission spectroscopy (GDOES) profile, can be seen in Figure 2. The depth of the S-phase layer, as produced by cross-sectional imaging, is approximately 39% greater than that which is suggested by the carbon depth profile in Figure 2, which shows that beyond 10 µm below the surface, the amount of carbon is reduced to 0%. The maximum carbon lies at 25 at% (6 wt%) at the surface, and the total amount of carbon dissolved in the material is 2.6 g/m2.
Figure 2. GDOES result showing the carbon at% (left axis) and the carbon wt% (right axis) against depth from the surface (depth = 0 µm) through the S-phase and the substrate.
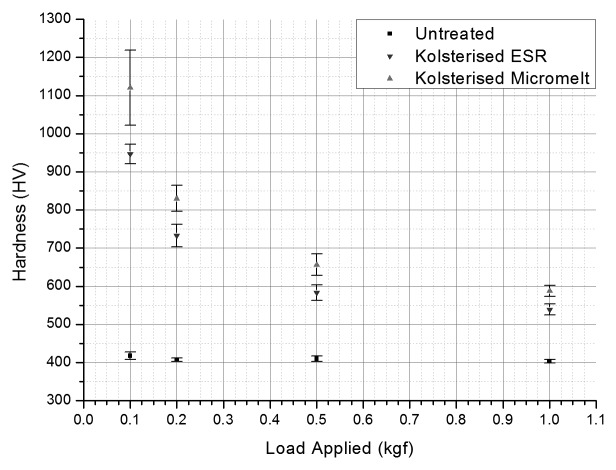
Figure 3 shows that the micro hardness of the untreated material remains nearly constant. On the other hand, on the Kolsterised® samples; as the load increases the hardness decreases. For the Kolsterised® samples, at 0.2 kgf the hardness decreased drastically, and continued to do so till a load of 1 kgf was applied. The hardness of the Kolsterised® samples however never reached the level of the untreated sample, meaning that the Kolsterised® sample always remained harder, regardless at what force the surface was indented.
Figure 3. Surface hardness of the untreated ESR sample, the treated ESR sample and the treated micromelt sample when indented using a microhardness tester at different loads ranging from 0.1 kgf to 1 kgf. (n = 10, P = 0.99).
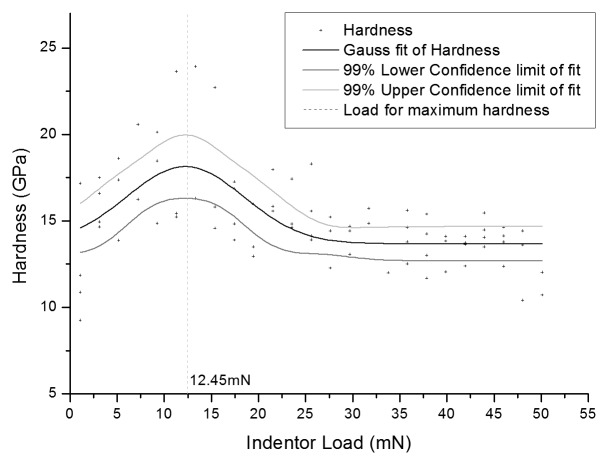
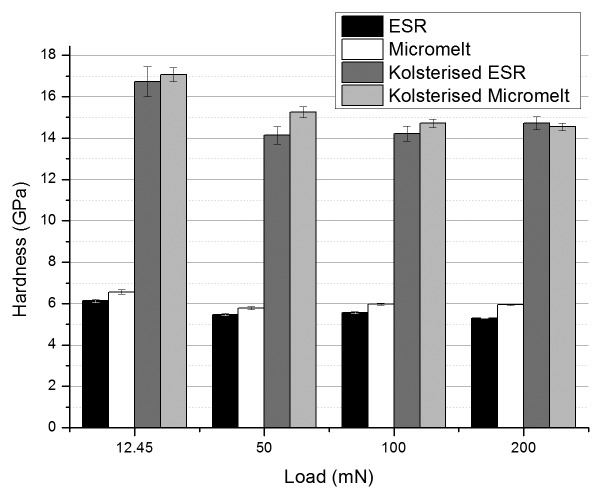
Surface nano indentation at loads from 1 mN to 50 mN are presented in Figure 4. As can be seen, the maximum value of hardness obtained from BS EN ISO 14577–4:2007: Metallic materials—Instrumented indentation test for hardness and materials parameters was achieved at a load of 12.45 mN indentation force, where the graph produces a hardness peak. Figure 5 shows the nano hardness results when the samples were indented at the surface. The hardness of the Kolsterised® alloy at each load is significantly higher than the hardness of the untreated alloy at the same load. At each load, the micromelt sample is always significantly harder than the ESR sample. This difference is also reflected in the treated samples when indented at a load below 200 mN. When the samples are indented at a load of 12.45 mN, the average hardness is significantly larger than the hardness reported at any other load. This result was expected, since as can be seen in Figure 4 at a load of 12.45 mN, a peak is given for the hardness obtained from nano indentation.
Figure 4. Plot showing variation in nanohardness with indenter load and a maximum hardness at a load of 12.45 mN for a Kolsterised® ESR sample.
Figure 5. Hardness of samples when indented using a nano-hardness tester from the surface at 12.45 mN, 50 mN, 100 mN and 200 mN (n = 100, P = 0.99). Graph shows that at an indentation load of 12.45 mN, the value obtained for hardness is greatest. This decreases to an approximate constant when surface is indented at a load 50 mN and above.
Preliminary tribocorrosion testing has given promising results with regards to corrosion-wear. These results, which are not within the scope of this paper, correlate very well with the hardness and corrosion results presented in this paper.
XRD analysis (Fig. 6) shows that all the peaks have shifted toward lower angles, showing a lattice expansion has taken place in accordance with Bragg's Law. It can be observed that the Hexagonal Close Packed (HCP) phase has completely been replaced by FCC phase in the Kolsterised® material XRD plots. This can be deduced from the absence of HCP peaks. Several peaks, most probably associated with carbides, can be also seen between 2θ of 42° and 47°.
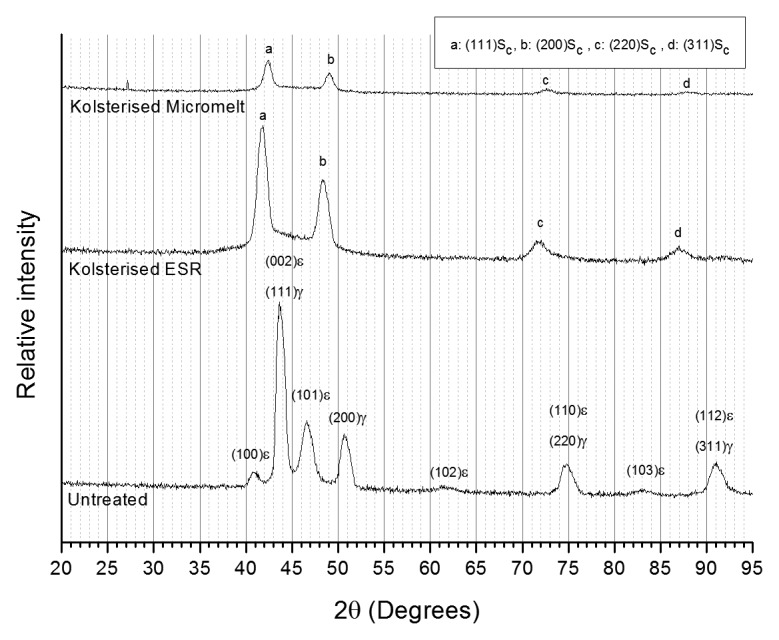
Figure 6. Grazing angle XRD scans of untreated ESR and Kolsterised® ESR and Micromelt samples. Cu-Kα radiation (λ = 0.154 nm).
Corrosion behavior
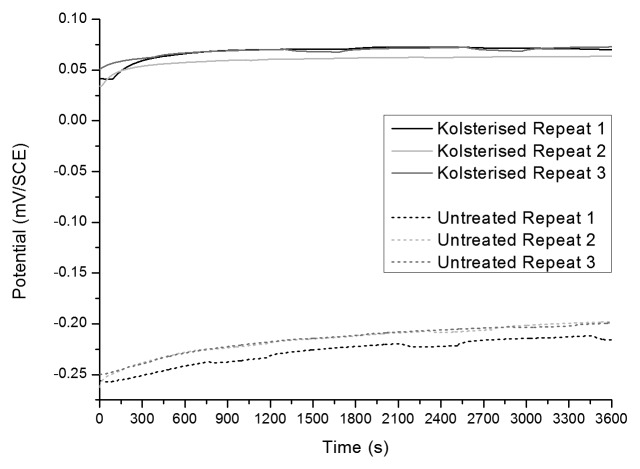
Figure 7 shows the OCP plots of the Kolsterised® and untreated samples. In the latter mentioned figure, it can be seen that in both plots the OCP rises gently and then retains a quasi constant value. At certain points, the voltage dips and then is restored to the “voltage trend.”
Figure 7. OCP plots of Kolsterised® and untreated ESR material. Three repeatable plots are shown for each sample.
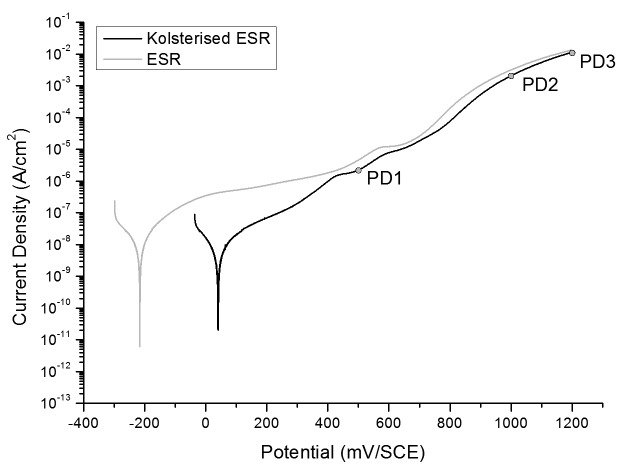
The potentiodynamic curves for the ESR and Kolsterised® ESR samples, when exposed to Ringer's Solution, were plotted and can be seen in Figure 8. The current then continues to rise gently in the passive region till it reaches a potential of 750 mV, when abruptly, the current increases drastically and the material enters the transpassive region. Interestingly, the material never attains a stable current value in the passive region, but rises at a quasi constant gradient throughout the region. No metastable pits could be observed in the Kolsterised® material, even though 3 metastable pitting events were noticed in one repeat of the potentiodynamic scan on the ESR untreated sample. Once again the current in the passive region rises gently but with a steeper gradient compared with the untreated material. At a potential of 750 to 800 mV, a change in the gradient of the slope can be observed, as the material once again passes from the passive to the transpassive region. The change in gradient is however less pronounced than in the untreated material.
Figure 8. Potentiodynamic plots representative of the untreated and Kolsterised® ESR samples. These plots are the most representative from three repeatable plots for each sample.
Figure 8 shows the most representative plots of the untreated and Kolsterised® samples plotted on the same axis. From Figure 8 it can immediately be deduced that throughout the scanning potential, the current density of the Kolsterised® material is significantly lower than that of the untreated material. This is especially true within the passive region up to a voltage of approximately 400 mV/SCE. At this point, the current of the treated material becomes nearly equivalent to that of the untreated material, although at every point this remains slightly lower.
Another difference which can be noticed, is the open circuit potential (OCP) of the Kolsterised® and untreated Co-Cr-Mo alloy. The Kolsterised® Co-Cr-Mo has a much higher OCP than the untreated material. This can be confirmed by the OCP plots for the same two materials shown in Figure 7.
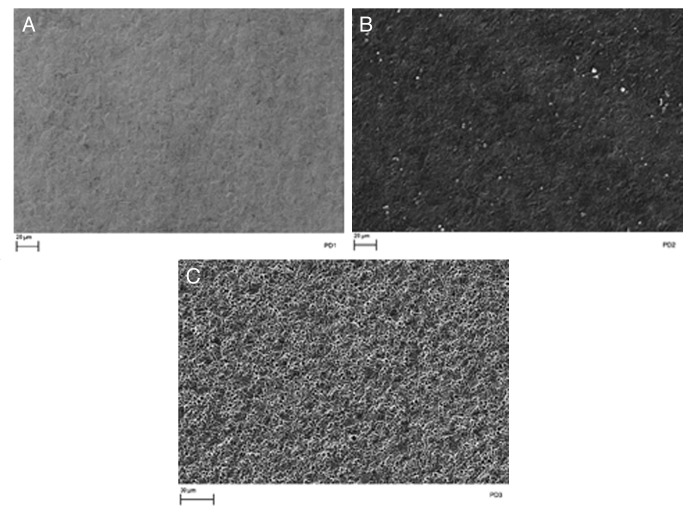
A number of interesting features were observed in the potentiodynamic scan plot for the Kolsterised® sample shown in Figure 8. When the potentiodynamic scan was stopped at each of these features, and the sample surface examined, it was noticed that; as the potential increased, the sample surface became etched to higher degrees. This can be represented graphically as shown in Figure 9.
Figure 9. SEM images of Kolsterised® ESR sample stopped at (A) PD1 +500 mV, (B) PD2 +750 mV and (C) PD3 +1200 mV during potentiodynamic testing showing etching to different degrees.
Plotting the current against the potential over a very small range ± 5.5 × 10⁻⁹ A/cm2 about the 0 A/cm2 current density, produces a linear plot, the gradient of which is known as the polarization resistance. The polarization resistance of the untreated and Kolsterised® plots are shown in Table 1. One can immediately notice that the polarization resistance for the untreated ESR sample is significantly lower than the polarization resistance for the Kolsterised® ESR sample.
Table 1. Comparison of polarization resistance and corrosion current for the Untreated and Kolsterised® samples.
| Material | Polarization Resistance (Rp) | Error in Rp | Corrosion Current (Icorr) | Error in Icorr |
|---|---|---|---|---|
| (mΩcm2) | (mΩcm2) | (A/cm2) | (A/cm2) | |
| Untreated | 1.57 x 10⁹ | 5.57 x 10⁶ | 14.49 x 10⁻⁹ | 5.14 x 10⁻¹¹ |
| Kolsterised® | 2.79 x 10⁹ | 8.94 x 10⁶ | 8.55 x 10⁻⁹ | 2.74 x 10⁻¹¹ |
The polarization resistance along with the gradient of the tafel slopes can then be used to determine the actual corrosion current (icorr). The corrosion current was then calculated using Equation 1 as per standard: ASTM G102–89: Standard Practice for Calculation of Corrosion Rates and Related Information from electrochemical measurements.
Equation 1
where: Rp is the Polarization Resistance, ba and bc are the gradients of the anodic and cathodic tafel slopes respectively.
This current is equivalent to the current achieved in Ringer's solution when no potential is applied to the material. The current signifies the number of metal ions being released into the solution when the material is exposed to full strength Ringer's solution at 37 °C. Thus a higher current would reflect a higher corrosion rate. The corrosion current was determined for the untreated and Kolsterised® ESR sample which can be seen stated in Table 1. The Kolsterised® ESR sample has a much lower icorr when compared with the untreated material and therefore loses approximately half as much ions per unit time when exposed to Ringer's solution at 37 °C.
Cytocompatibility using a human fetal osteoblast cell line
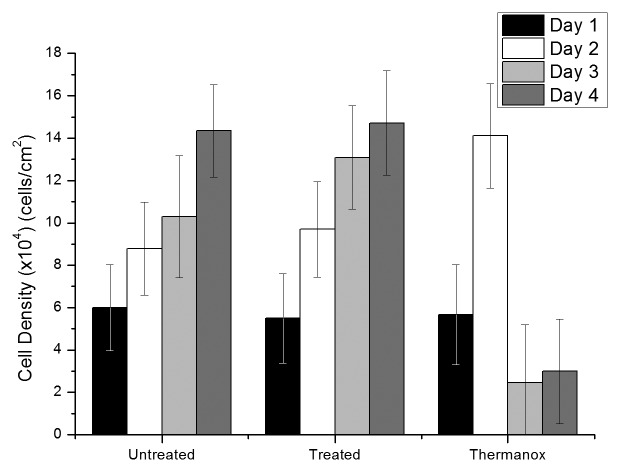
The results from XTT testing in Figure 10, shows that the number of cells increases with incubation time with all the materials tested. The only exception to the rule is the Thermanox® coverslips on the third and fourth days in which a drop in “cell count” can be seen.
Figure 10. XTT results for human fetal osteoblast cell line on the Kolsterised® micromelt, untreated micromelt and Thermanox® samples. (Average of 10 samples, 90% confidence interval).
When testing using human fetal osteoblasts (Fig. 10), the number of cells increases in a very similar fashion in the Kolsterised® and untreated material. On the other hand the Thermanox® gives a spike on the second day and then, the cell metabolic rate decreases on the third and fourth day.
Discussion
Effect of Kolsterising® on the mechanical aspects of a Co-Cr-Mo alloy
Both the SEM cross-sectional image in Figure 1 and the GDOES plot in Figure 2 show that the thickness of the S-phase layer produced is thinner than 15 µm. This thickness is quite thin when compared with other carbon S-phase layers produced by low temperature plasma carburising on stainless steels. On stainless steels, conventional low temperature plasma carburising techniques give a maximum S-phase thickness of up to 50 µm15 while Kolsterising® (K33) guarantees a diffusion depth of 33 µm when applied on 316LVM stainless steel. This implies that the S-phase produced on the ASTM F1537 alloy makes up for less than half that produced on the stainless steel. However, this result was expected, since the low temperature plasma carburising treatment performed by Li et al.16 on a similar Co-Cr-Mo alloy only yielded an 8 µm thickness of S-phase. This difference in response can be attributed to the two main differences in composition: Cobalt and Nickel. Cobalt-based alloys as their name suggest have a matrix composed of Cobalt and this could be a primary reason for this difference. The lack of Ni in the ASTM F1537 alloy may also have played an important role in determining the thickness of the S-phase produced, since as observed by Buhagiar et al.17 and Formosa et al.,18 Ni-free stainless steels tend to produce a thinner S-phase layer than their Ni-containing counterparts.
The carbon depth profile shown in Figure 2 resembles that obtained by Li et al.16 in that; it has no plateau toward the surface and that it is a quasi linear plot to a carbon concentration equivalent to that found in the alloy. This profile is similar to models by Galdikas et al.19 who model the diffusion of nitrogen into the S-phase layer under the influence of internal stresses, and thus considering a non-Fickian model. This may thus suggest that even in the S-phase produced in Co-Cr-Mo alloys by Kolsterising®, the method by which the carbon diffuses through the S-phase, in order to occupy the interstitial sites20 is determined by a non-Fickian law, and is helped by internal residual stresses in the Co-Cr-Mo alloy created by the S-phase itself. The initial carbon concentration is shown to be approximately 4 wt% for the S-phase produced by Li et al.,16 and this therefore differs from the 7 wt% carbon for the S-phase produced by Kolsterising® in Figure 2. In comparison, stainless steels have a surface carbon atomic percentage of approximately 12 at%,21 whereas the Kolsterised Co-Cr-Mo has shown a surface carbon concentration of close to 25 at%. Both values are above the equilibrium carbon content which could be taken up by their respective substrate material16,21,22 as expected in the formation of S-phase. The interstitial carbon uptake lies at 2.6 g/m2 which is very close to the interstitial carbon uptake for Ni-free stainless steels (3 g/m2) reported by Buhagiar et al.17
Glancing angle XRD is a final confirmation that the S-phase is in-fact present on the sample. The peak shift signifies an expansion of the FCC matrix, which is brought about through diffusion of the carbon atom into the surface during the Kolsterising® process. As with low temperature plasma carburising of stainless steels, the (200)γ peak has shifted more than the (111)γ peak.23 This once again suggests that the diffusion of carbon into a grain which has its [100] direction parallel to the surface is greater than any other orientation.24-27 As suggested by Borgioli et al.,28 the abnormal (200)γ peak shift may also be due to a high stacking fault density. The HCP ε peaks present in the untreated XRD data plot are not further present in the XRD data plots for the Kolsterised® ESR and micromelt samples. This was expected since the carbon introduced into the S-phase acts as a FCC stabilizer.29
Figure 5 shows the major benefit which is gained when a Co-Cr-Mo alloy is Kolsterised®, i.e., the gain in surface hardness, which can be seen to rise from a mere 5.5 GPa to 14.2 GPa for the ESR sample and from 5.8 GPa to 15.2 GPa for the micromelt sample at an indentation load of 50 mN. A rise in hardness is also recorded for low temperature plasma carburised stainless steels by Garcia Molleja et al.30 using similar nano testing equipment.
Effect of Kolsterising® on the corrosion resistance of the Co-Cr-Mo alloy
As described in Figure 7 and 8; the OCP of the Kolsterised® sample is higher than the OCP of the untreated sample, and the current density of the Kolsterised® sample is constantly lower than that of the untreated sample as shown in Figure 8. Having a higher OCP shows that the Kolsterised® sample is more noble than the untreated sample making it the more corrosion resistant alloy, in agreement with similar results on low temperature plasma carburised austenitic stainless steels.15,31
The lower current throughout the potentiodynamic plot is also significant, since this indicates a lower number of ions being released into the solution per second, which thus implies a lower corrosion rate. The “bumps” in the quasi-passive region are referred to by Pound32 and are related to two solid state oxidation reactions namely; Cr(III) to Cr(IV) and Co(II) to Co(III), which release electrons into the system, thus increasing the current artificially. This is then followed by transpassive dissolution.32
The effects observed in Figure 9 are probably due to the etching of the S-phase layer. Due to the fact that Co-Cr-Mo does not form pits, but is rather characterized by transpassive dissolution,32 it is probable that the grains are revealed by means of etching through the potential applied along with the testing solution. The untreated sample was seen to be unaffected by the potentiodynamic corrosion testing, and no visible signs of corrosion or etching could be seen on the surface. From Figure 9, one can also notice that no pitting has occurred even when the biasing potential reached 1200 mV/SCE.
The polarization resistance for the Kolsterised® material plotted in Table 1 is higher for the Kolsterised® material than for the untreated material. This means that the rise in current for the Kolsterised® material is lower than the rise in current for the untreated material for the same potential change. One can also notice that the Kolsterised® alloy shows an OCP corrosion current which is equal to half that of the untreated material. Thus, at OCP, in Ringer's solution, the number of ions released by the Kolsterised® alloy is half that which is released by the untreated alloy.
Effect of Kolsterising® on the biocompatibility of the Co-Cr-Mo alloy
The rising trend in cell count numbers on all three materials shown in Figure 10 shows that the materials being tested are in fact cytocompatible. The Kolsterised® micromelt samples behave very much like the untreated micromelt samples, which thus shows that the Kolsterised® samples are as cytocompatible as the untreated samples. By reason, this implies that the Kolsterised® samples, and thus the S-phase, have and has retained the excellent cytocompatibility of the untreated Co-Cr-Mo alloy.13,14
The trend on the Thermanox® positive control displays extremely good biocompatibility during the first two days. On the third and fourth day, the cell numbers drop abruptly. This phenomenon is probably due to over confluency of the cells within the same well. Between day 2 to day 3, and then further on into day 4, the cells multiplied in excess of what could be supported by the medium, thus some cells moved into the dormant state while others entered into a necrotic/apoptotic state.
The methodological problems faced by Borji et al.,11 in which the author recorded good proliferation but low cell viability, have been rectified by the current methods being used. Rather than using a haemocytometer, as in the case with Borji et al.11 to count the cells present on the surface, the XTT method is based on cell metabolism. This implies that the reading obtained from XTT for the number of cells actually represents the number of live, metabolically functioning cells.33 It is for this reason that the researcher can confirm that from these preliminary results, the biocompatibility of the Kolsterised® Co-Cr-Mo alloy is remarkably good.
Conclusions to the Discussion
Kolsterising® has enhanced the surface properties of the untreated Co-Cr-Mo alloys by inducing a carbon S-phase layer, which is thicker than carbon S-phase layers developed by other methods on similar Co-Cr-Mo alloys. The amount of carbon uptake, as in other S-phase systems is much greater than the equilibrium carbon content allowed to dissolve naturally in the Co-Cr-Mo alloy. The Co-Cr-Mo S-phase was seen to be made up predominantly from an expanded austenite structure with the HCP grains in the untreated material being transformed into FCC. The main advantages of Kolsterising® on Co-Cr-Mo include a very high hardness at the surface of the material. This is nearly a 150% increase in the surface hardness of the untreated material.
Improved corrosion resistance was obtained due to increased nobility of the alloy, decreased corrosion current (icorr), decreased passivation current and increased polarization resistance.
Kolsterised® Co-Cr-Mo alloys have also retained the cytocompatibility of the untreated alloy, thus providing for good cytotoxicity.
Materials and Methods
Two Co-Cr-Mo bars of different diameter were purchased from L. Klein SA (http://www.kleinmetals.ch/steel/cobalt-bc-cobalt-chrome.htm). The rods were specified as being in conformity to standard ASTM F1537:2000 - Standard Specification for Wrought Cobalt - 28Chromium - 6Molybdenum Alloys for Surgical Implants (UNS R31537, UNS R31538, and UNS R31539). The composition of the Ø = 9.52 mm micromelt rod was 0.04C-27.36Cr-0.03Ni-5.52Mo-0.18N-Bal.Co (wt%), while that of the Ø = 25.4 mm rod was 0.05C-27.64Cr-0.07Ni-5.46Mo-0.17N-Bal.Co (wt%). These samples will be referred to as the micromelt sample and the ESR (electro slag remelted) sample respectively throughout this paper. Flat disks were wire cut from two rods of diameter Ø = 25.4 mm and Ø = 9.52 mm to a thickness of 7 mm and 3 mm respectively. The micromelt and ESR disks were surface ground, to remove the heat affected zone which developed due to the wire cutting procedure, to a thickness of 2 mm and 6 mm respectively by removing 0.5 mm of material from each surface. Surface grinding was performed using a grade 60 silicon carbide disk submerged in coolant (Mac Dermid, Relubro GP10, http://industrial.macdermid.com/ebooks/RelubroCoolants_MetalWorkingFluids/data/search.xml). The disks were then ground using 800 and 1200 grit silicon carbide paper (Metprep, 139913 and 139915) and polished to a final finish of 3 µm polycrystalline diamond paste (Metprep, 154243) and a roughness (Ra) of 0.01 µm. The samples were then Kolsterised® at Bodycote Hardiff GmbH. Kolsterising® is an S-phase forming, low temperature diffusion process performed at a temperature below 500 °C for several days at a very high carbon potential.18
A cross section of the sample was etched using an electroetching procedure with a stainless steel (AISI316) cathode. The etchant used contained 100 mL, 37% HCl(aq) (Sigma Aldrich) with 0.5 mL, 30% H2O2(aq) (Sigma Aldrich). A voltage of 4V with a limiting current of 0.75 A/cm2 for 4.5 to 5 s were then used to etch the sample. Composition depth profiling analysis was performed using a LECO GDS-750 QDP Glow Discharge Optical Emission Spectroscopy (GDOES). This was performed to accurately measure the carbon content in the Kolsterised® ESR sample, with respect to depth (μm) in the surface of the sample. Phase data was then obtained using Grazing angle XRD analysis was performed using a X-ray diffractometer (Rigaku Ultima IV). The parameters used were a scan range between 20° and 95°, scan speed 0.8°/min and a step size of 0.05°.
Microhardness indentations were performed using a Multitoyo MVK-H2 (Japan) with a Vickers hardness indentor. Indentations were made on the surface at loads varying from 0.1 kgf to 1 kgf on an untreated ESR sample, a Kolsterised® ESR Sample and a Kolsterised® micromelt sample. Ten hardness readings were taken at each load on the different samples. Nano hardness indentations were performed using a Nano Hardness P3 platform (Micromaterials, UK) with a Berkovich indentor. Indentations were made on the surface of the material at loads varying from 1 mN to 50 mN, in order to determine the load at which the material gives maximum hardness in accordance with BS EN ISO 14577: 2007 - Metallic materials - Instrumented indentation test for hardness and materials parameters parts 1 to 4. This standard was adapted for use with diffusion coatings, by effectively treating the S-phase as a very thick coating layer. Indentations were then made at the load of 12.45 mN, which gave maximum hardness, and at loads of 50 mN, 100 mN and 200 mN respectively, which gave a quasi-plateau hardness value at each load.
Potentiodynamic testing was performed following BS EN ISO 17475:2008 - Corrosion of metals and alloys — Electrochemical test methods — Guidelines for conducting potentiostatic and potentiodynamic polarization measurements. The exposed working electrode area was adjusted to 177 mm2. Ringer's solution tablets (LabM, LAB100Z, http://www.labm.com/products/ringers-solution-(1-4-strength)-tablets/) were added to de-ionised water with a conductivity of 0.082 µS/cm in order to get a corrosion electrolyte of the following concentration: 9 g/L NaCl, 0.42 g/L KCl, 0.48 g/L CaCl and 0.2 g/L NaHCO3. A potentiostat (Gamry Reference 600, USA) was then used to carry out the measurement. The solution of degassed for 1 h using nitrogen gas at a flow rate of 2.5 L/min This was followed by the monitoring of the open circuit potential for another 1 h. At termination of the OCP test a potentiodynamic test which was performed between a voltage of -100 mV vs OCP and 1200 mV vs. VRef at a scan rate of 0.17 mV/s. The test was repeated until 3 overlapping plots were obtained for each of the Kolsterised® and untreated samples. After all the repeats had been obtained, certain features on the potentiodynamic scan were noted. The potentials at which these interesting features were recorded were then used in a subsequent experiment, where similar samples were tested and stopped at those particular potentials, namely 500 mV, 1000 mV and 1200 mV. These samples were subsequently transferred to a Scanning Electron Microscope (Zeiss Merlin) for imaging.
XTT testing was performed on hFOB 1.19 (LGC Ltd., UK, via ATCC, CRL-11372, http://www.lgcstandards-atcc.org/products/all/CRL-11372.aspx?geo_country=mt) human fetal osseoblasts. hFOB 1.19 cells were cultured in T75 flasks (Life Technologies, Greiner Bio One, http://us.gbo.com/bioscience/documents/flyers/243_cellcoat%20collagen%20type%20i.pdf) and grown to approximately 90% confluency. At this point the cells were tripsinised using Tyripsin with 10% EDTA (EDTA) (Life Technologies Gibco, http://www.lifetechnologies.com/order/catalog/product/15090046). The cells were then counted using a haemocytometer and diluted to a concentration of 70 000 cells per mL of medium.
The untreated and Kolsterised® micromelt disks were autoclaved to ensure sterility. The Nunc® Thermanox® coverslips (Thermo Scientific, 150067, http://www.thermoscientific.com/ecomm/servlet/productsdetail_11152_L10872_82235_11953124_-1), used as positive control samples in this experiment, were punched to a diameter of 9.52 mm and sterlised in 70% ethanol under UV light. Both the Thermanox® and the metal were then placed in 48 well plates (Life Technologies, Greiner Bio-One, 677180, http://www.greinerbioone.com/en/row/articles/catalogue/articles/36_11/) using sterile tweezers.
One milliliter of cell suspension (70 000 cells/mL) was added to each well, except the 'blank' wells. The remaining wells were filled with sterile water in order to reduce evaporation. The “blank” wells were filled with complete medium with no cells as a negative control. The well plates were then placed in the incubator, and incubated for 1, 2, 3, and 4 days respectively. After each time period, a well plate set was removed from the incubator, while the others were left to continue the incubation period. Five of the Thermanox® coverslips were then removed from the well plate and discarded. New complete medium was then added to each well vacated of the Thermanox® coverslips. At this point 2 mL of 2,3-Bis(2-methoxy-4-nitro-5-sulfophenyl)-2H-tetrazolium-5-carboxanilide inner salt (XTT) at a concentration of 1 mg XTT per mL of PBS (Sigma Aldrich, TOX2 SIGMA) was added to 35 µL of PMS (concentration: 1.55 mg of PMS per mL of PBS) and 8 mL of complete medium. 200 µL of this solution was then added to each well and the well plates incubated for 2 h. After incubation, the well plates were placed on a plate shaker (Eppendorf Thermomixer Comfort) and mixed for 5 min at 300 rpm and 21 °C. 300 µL from each well was then taken and transferred to a 96 well plate (Life Technologies, Greiner Bio-One, 650180, http://www.greinerbioone.com/en/row/articles/catalogue/articles/37_11/). The 96 well plate was then placed in an Elisa plate reader (Biotek Instruments), and absorbance was read at 450 to 630 nm wavelengths. The average absorbance of the well from which the Thermanox® coverslips were extracted was then computed and subtracted from the value of absorbance given by each well. This ensured that the number of cells, presented in the results graph, was reflective of those cells which adhered to the surface of the experimental article, and did not include those which attached to the walls of the well.
All research within this study has been done in-vitro. No section or portion of the work has yet been tested in vivo. This thus allows the work to conform to the ethical principles presented in the Helsinki Declaration of 1975, placing the patient's health in topmost priority, by performing initial testing on in-vitro specimen.
Disclosure of Potential Conflicts of Interest
No potential conflicts of interest were disclosed.
Acknowledgments
The authors are grateful for financial support received from Bodycote Hardiff GmbH, the Faculty of Engineering THINK10K grant and the University of Malta Research Fund. The authors would like to thank ERDF (Malta) for the financing of the testing equipment through the projects: “Developing an Interdisciplinary Material Testing and Rapid Prototyping R&D Facility (Ref.No. 012)” and “Enhancing Health Biotechnology Facilities at the University of Malta (Ref. No. 081).” One of the authors, Malcolm Caligari Conti, wants to thank the Malta Government Scholarship Scheme (MGSS) for funding his PhD. In addition, the authors wish to express their appreciation to Ing James Camilleri, Ms Christina Fiott and Ms Analisse Cassar for their technical support.
Footnotes
Previously published online: www.landesbioscience.com/journals/biomatter/article/27713
References
- 1.Navarro M, Michiardi A, Castaño O, Planell JA. Biomaterials in orthopaedics. J R Soc Interface. 2008;5:1137–58. doi: 10.1098/rsif.2008.0151. [DOI] [PMC free article] [PubMed] [Google Scholar]
- 2.Cawley J, Metcalf JEP, Jones AH, Band TJ, Skupien DS. A tribological study of cobalt chromium molybdenum alloys used in metal-on-metal resurfacing hip arthroplasty. Wear. 2003;255:999–1006. doi: 10.1016/S0043-1648(03)00046-2. [DOI] [Google Scholar]
- 3.Variola F, Vetrone F, Richert L, Jedrzejowski P, Yi JH, Zalzal S, Clair S, Sarkissian A, Perepichka DF, Wuest JD, et al. Improving biocompatibility of implantable metals by nanoscale modification of surfaces: an overview of strategies, fabrication methods, and challenges. Small. 2009;5:996–1006. doi: 10.1002/smll.200801186. [DOI] [PubMed] [Google Scholar]
- 4.Smith AJ, Dieppe P, Vernon K, Porter M, Blom AW, National Joint Registry of England and Wales Failure rates of stemmed metal-on-metal hip replacements: analysis of data from the National Joint Registry of England and Wales. Lancet. 2012;379:1199–204. doi: 10.1016/S0140-6736(12)60353-5. [DOI] [PubMed] [Google Scholar]
- 5.Delaunay C, Petit I, Learmonth ID, Oger P, Vendittoli PA. Metal-on-metal bearings total hip arthroplasty: the cobalt and chromium ions release concern. Orthop Traumatol Surg Res. 2010;96:894–904. doi: 10.1016/j.otsr.2010.05.008. [DOI] [PubMed] [Google Scholar]
- 6.Gill HS, Grammatopoulos G, Adshead S, Tsialogiannis E, Tsiridis E. Molecular and immune toxicity of CoCr nanoparticles in MoM hip arthroplasty. Trends Mol Med. 2012;18:145–55. doi: 10.1016/j.molmed.2011.12.002. [DOI] [PubMed] [Google Scholar]
- 7.Pandit H, Glyn-Jones S, McLardy-Smith P, Gundle R, Whitwell D, Gibbons CLM, Ostlere S, Athanasou N, Gill HS, Murray DW. Pseudotumours associated with metal-on-metal hip resurfacings. J Bone Joint Surg Br. 2008;90:847–51. doi: 10.1302/0301-620X.90B7.20213. [DOI] [PubMed] [Google Scholar]
- 8.Mellon SJ, Grammatopoulos G, Andersen MS, Pegg EC, Pandit HG, Murray DW, Gill HS. Individual motion patterns during gait and sit-to-stand contribute to edge-loading risk in metal-on-metal hip resurfacing. Proc Inst Mech Eng H. 2013;227:799–810. doi: 10.1177/0954411913483639. [DOI] [PubMed] [Google Scholar]
- 9.Roodman GD. Biology of osteoclast activation in cancer. J Clin Oncol. 2001;19:3562–71. doi: 10.1200/JCO.2001.19.15.3562. [DOI] [PubMed] [Google Scholar]
- 10.Buhagiar J, Bell T, Sammons R, Dong H. Evaluation of the biocompatibility of S-phase layers on medical grade austenitic stainless steels. J Mater Sci Mater Med. 2011;22:1269–78. doi: 10.1007/s10856-011-4298-3. [DOI] [PubMed] [Google Scholar]
- 11.Bordji K, Jouzeau J-Y, Mainard D, Payan E, Delagoutte J-P, Netter P. Evaluation of the effect of three surface treatments on the biocompatibility of 316L stainless steel using human differentiated cells. Biomaterials. 1996;17:491–500. doi: 10.1016/0142-9612(96)82723-2. [DOI] [PubMed] [Google Scholar]
- 12.Martinesi M, Bruni S, Stio M, Treves C, Bacci T, Borgioli F. Biocompatibility evaluation of surface-treated AISI 316L austenitic stainless steel in human cell cultures. J Biomed Mater Res A. 2007;80:131–45. doi: 10.1002/jbm.a.30846. [DOI] [PubMed] [Google Scholar]
- 13.Martínez R, Escobedo JC, Cortés DA, Alves GG, Linhares ABR, Granjeiro JM, Prado M, Ortiz JC, Almanza JM, Múzquiz-Ramos EM. In vitro bioactivity and biocompatibility of a Co–Cr–Mo alloy after heat treatment in contact with different bioactive systems. Ceram Int. 2013;39:2003–11. doi: 10.1016/j.ceramint.2012.08.052. [DOI] [Google Scholar]
- 14.Xin XZ, Xiang N, Chen J, Wei B. In vitro biocompatibility of Co–Cr alloy fabricated by selective laser melting or traditional casting techniques. Mater Lett. 2012;88:101–3. doi: 10.1016/j.matlet.2012.08.032. [DOI] [Google Scholar]
- 15.Sun Y, Li X, Bell T. Low temperature plasma carburising of austenitic stainless steels for improved wear and corrosion resisitance. Surf Eng. 1999;15:49–54. doi: 10.1179/026708499322911647. [DOI] [Google Scholar]
- 16.Li XY, Habibi N, Bell T. H. D. Microstructural characterisation of plasma carburised low carbon Co-Cr alloy. Surf Eng. 2007;23:45–51. doi: 10.1179/174329407X161564. [DOI] [Google Scholar]
- 17.Buhagiar J, Li X, Dong H. Formation and microstructural characterisation of S-phase layers in Ni-free austenitic stainless steels by low-temperature plasma surface alloying. Surf Coat Tech. 2009;204:330–5. doi: 10.1016/j.surfcoat.2009.07.030. [DOI] [Google Scholar]
- 18.Formosa D, Hunger R, Spiteri A, Dong H, Sinagra E, Buhagiar J. Corrosion behaviour of carbon S-phase created on Ni-free biomedical stainless steel. Surf Coat Tech. 2012;206:3479–87. doi: 10.1016/j.surfcoat.2012.02.020. [DOI] [Google Scholar]
- 19.Galdikas A, Moskalioviene T. Stress induced nitrogen diffusion during nitriding of austenitic stainless steel. Comput Mater Sci. 2010;50:796–9. doi: 10.1016/j.commatsci.2010.10.018. [DOI] [Google Scholar]
- 20.Qu J, Blau PJ, Jolly BC. Tribological properties of stainless steels treated by colossal carbon supersaturation. Wear. 2007;263:719–26. doi: 10.1016/j.wear.2006.12.049. [DOI] [Google Scholar]
- 21.Cao Y, Ernst F, Michal GM. Colossal carbon supersaturation in austenitic stainless steels carburized at low temperature. Acta Mater. 2003;51:4171–81. doi: 10.1016/S1359-6454(03)00235-0. [DOI] [Google Scholar]
- 22.Dong H. S-phase surface engineering of Fe-Cr, Co-Cr and Ni-Cr alloys. Int Mater Rev. 2010;55:65–98. doi: 10.1179/095066009X12572530170589. [DOI] [Google Scholar]
- 23.Blawert C, Kalvelage H, Mordike BL, Collins GA, Short KT, Jiraskova Y, Schneeweiss O. Nitrogen and carbon expanded austenite produced by PI3. Surf Coat Tech. 2001;136:181–7. doi: 10.1016/S0257-8972(00)01050-1. [DOI] [Google Scholar]
- 24.Ozturk O, Williamson DL. Phase and composition depth distribution analyses of low energy, high flux N implanted stainless steel. J Appl Phys. 1995;77:3839–50. doi: 10.1063/1.358561. [DOI] [Google Scholar]
- 25.He H, Czerwiec T, Dong C, Michel H. Effect of grain orientation on the nitriding rate of a nickel base alloy studied by electron backscatter diffraction. Surf Coat Tech. 2003;163–164:331–8. doi: 10.1016/S0257-8972(02)00611-4. [DOI] [Google Scholar]
- 26.Fewell MP, Mitchell DRG, Priest JM, Short KT, Collins GA. The nature of expanded austenite. Surf Coat Tech. 2000;131:300–6. doi: 10.1016/S0257-8972(00)00804-5. [DOI] [Google Scholar]
- 27.Xu X, Yu Z, Wang L, Qiang J, Hei Z. Phase depth distribution characteristics of the plasma nitrided layer on AISI 304 stainless steel. Surf Coat Tech. 2003;162:242–7. doi: 10.1016/S0257-8972(02)00670-9. [DOI] [Google Scholar]
- 28.Borgioli F, Fossati A, Galvanetto E, Bacci T. Glow-discharge nitriding of AISI 316L austenitic stainless steel: influence of treatment temperature. Surf Coat Tech. 2005;200:2474–80. doi: 10.1016/j.surfcoat.2004.07.110. [DOI] [Google Scholar]
- 29.Lee SH, Nomura N, Chiba A. Significant Improvement in Mechanical Properties of Biomedical Co-Cr-Mo Alloys with Combination of N addition and Cr-Enrichment. Mater Trans. 2008;49:260–4. doi: 10.2320/matertrans.MRA2007220. [DOI] [Google Scholar]
- 30.García Molleja J, Nosei L, Ferrón J, Bemporad E, Lesage J, Chicot D, Feugeas J. Characterization of expanded austenite developed on AISI 316L stainless steel by plasma carburization. Surf Coat Tech. 2010;204:3750–9. doi: 10.1016/j.surfcoat.2010.04.036. [DOI] [Google Scholar]
- 31.Li CX, Bell T. Corrosion properties of active screen plasma nitrided 316 austenitic stainless steel. Corros Sci. 2004;46:1527–47. doi: 10.1016/j.corsci.2003.09.015. [DOI] [Google Scholar]
- 32.Pound BG. Electrochemical behaviour of cobalt-chromium alloys in a simulated physiological solution. J Biomed Mater Res A. 2009;94A:93–102. doi: 10.1002/jbm.a.32684. [DOI] [PubMed] [Google Scholar]
- 33.Wyllie A, Bonahue V, Fischer B, Hill D, Keesey J, Manzow S. Cell Proliferation and Viability. In: Eisel D, Fertig G, Fischer B, Manzow S, Schmelig K, eds. Apoptosis and Cell Proliferation. Mannheim: Boehringer Mannheim GmbH, 1998:64-138. [Google Scholar]


