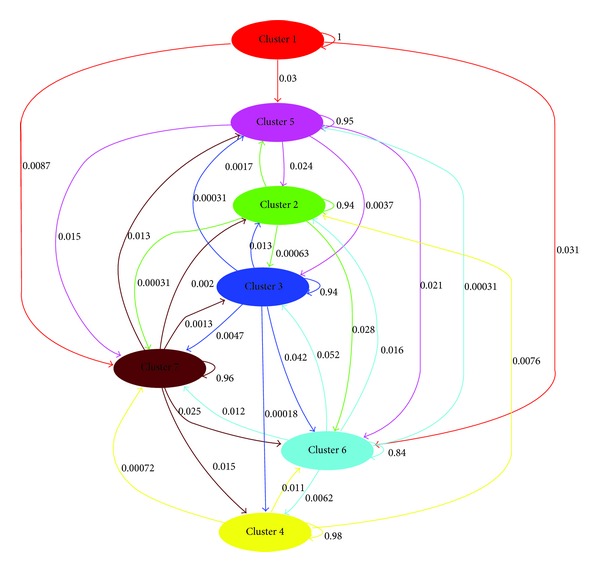
Figure 3.

Main gene flows between clusters identified in Italian olive germplasm collection of CRA-OLI. In the graph, gene flows were shown by weighted arrows, so that the weights relative amounts of ancestry in the source cluster were assigned to the target cluster.
