Abstract
Background
Human hepatocellular carcinoma (HCC) is one of the most common fatal cancers and an important health problem worldwide, but its mechanism is still unclear. Microtubule (MT) kinesin motor proteins orchestrate a variety of cellular processes (e.g. mitosis, motility and organelle transportation) and have been involved in human carcinogenesis. KIF3B, the kinesin superfamily of proteins (KIFs), plays an important role in the regulation of mitotic progression.
Aim
The expression of KIF3B and its involvement in HCC was investigated.
Methods
Western blot and immunohistochemistry were used to measure the expression of KIF3B protein in HCC and adjacent non-tumorous tissues in 57 patients and Cell Counting Kit-8 to analyze the effects of growth and interference of KIF3B in the cell cycle process.
Results
KIF3B protein level was increased in HCC tissues compared with the adjacent non-tumorous tissues. It was significantly associated with histological differentiation, tumor size, the level of alpha fetal protein (AFP) and proliferation marker Ki-67. Over-expression of KIF3B was correlated with poor survival. Following release of HepG2 cells from serum starvation, the expression of KIF3B was up-regulated. Furthermore, suppression of KIF3B not only decreased cancer cell growth but also induced apoptosis of cells.
Conclusions
Our results suggested that KIF3B expression was upregulated in HCC tumor tissues and proliferating HCC cells, and an increased KIF3B expression was associated with poor overall survival. KIF3B over-expression is involved in the pathogenesis of hepatocellular carcinoma and may serve as a potential therapeutic target for human HCC.
Keywords: Human hepatocellular carcinoma (HCC), KIF3B, Cell proliferation, Pathogenesis
Introduction
Hepatocellular carcinoma (HCC) is one of the most common fatal cancers and an important health problem worldwide, especially in Asia, where its incidence is increasing in many countries [1–3]. Also, the incidence has been rising in several Western low-incidence areas over the past decade [4, 5]. Although the clinical technology has been greatly improved, the prognosis of patients with HCC is still poor [1, 2]. The poor prognosis of HCC is also caused by its poorly differentiated phenotype, large type, portal venous invasion, and intrahepatic metastasis [6]. In order to improve the prognosis of patients, it is very important to find efficient new targets for early diagnosis and effective treatment of HCC [7]. Hepatocarcinogenesis is a complex and multistep process that implicates activating oncogenes and inactivating tumor suppressor genes in the different stages of HCC progression [8]. Thus, identification and investigation of new genes/pathways involved in HCC development will help our understanding of the mechanisms of hepatocarcinogenesis [9].
Kinesin superfamily proteins (KIFs) were found for the first time in 1985. KIFs are a conserved class of microtubule-dependent molecular motor proteins that transport intracellular cargo along microtubules using the energy derived from ATP hydrolysis [10, 11]. KIFs participate in several cellular processes, including mitosis, meiosis, and transport macromolecules. Of these, mitosis is a complex and highly regulated process of eukaryotic cell division. Any exception in the process of mitosis will result in cell death, gene deletion, chromosome translocation, duplication and even carcinogenesis [12, 13].
KIF3, one of the most ubiquitously expressed KIFs, is composed of a KIF3A/3B heterodimer and a kinesin-associated protein known as KAP3 [14]. This complex has been involved in the intracellular transport of membrane-bound organelles and protein complexes in various tissues (e.g. neurons, melanosomes and epithelial cells) [15–17]. As a member of the KIF3 subfamily of the kinesin superfamily, KIF3B consists of a family of molecular motors and shows function in vesicle transport and membrane expansion during mitosis through targeting of other molecules [18, 19]. Adenomatous polyposis coli (APC) protein is transported by the KIF complex, accumulates in the tips of membrane protrusions, and may thus regulate cell migration [17]. Lukong et al. [20] demonstrated that kinesin associated protein 3A (KAP3A) knockdown resulted in suppression of breast tumor kinase (BRK)-induced migration of breast cancer cells. These results indicated that KIF3B has been implicated in carcinogenesis.
The expression and clinical significance of KIF3B protein have not yet been investigated in human HCC. Therefore, in the present study, we compared the expression of KIF3B protein in HCC tissues with the adjacent non-tumorous tissues using immunohistochemical and immunoblotting methods. Then, we used anti-KIF3B small interfering RNA (siRNA) to elucidate the effects of KIF3B on HCC cell proliferation.
Materials and Methods
Patients and Tissue Samples
HCC tissues were obtained from 57 patients. All underwent hepatic surgical resection without postoperative systemic chemotherapy in the Surgery Department, at the Affiliated Hospital of Nantong University. The diagnosis criteria for all patients in this study were confirmed by experienced pathologists through histological examination of H&E-stained biopsy sections; and clinicopathologic and follow-up data were completely available. The main clinical and pathologic variables of the patients are shown in Table 1. Forty-four patients were men and 13 were women; their ages ranged from 21 to 65 (mean, 47.19 years). Forty patients were positive for HBV surface antigen, 43 were positive for cirrhosis. Histological grades were classified to well differentiated (grade I; n = 12), moderately differentiated (grade II; n = 27), and poorly differentiated (grade III; n = 18). The follow-up time was 5 years for 57 patients after surgery ranging from 1 to 80 months (median, 34 months). None of the patients received postoperative adjuvant therapy.
Table 1.
KIF3B Ki67 expression and clinicopathological parameters in 57 HCC specimens
| Parameters | Total | KIF3B | P | Ki67 | P | ||
|---|---|---|---|---|---|---|---|
| Low score <5 | High score ≥5 | Low score <5 | High score ≥5 | ||||
| Age (years) | |||||||
| ≤45 | 28 | 8 | 20 | 0.423 | 14 | 14 | 0.349 |
| >45 | 29 | 10 | 19 | 12 | 17 | ||
| Gender | |||||||
| Male | 44 | 15 | 29 | 0.349 | 19 | 25 | 0.358 |
| Female | 13 | 3 | 10 | 7 | 6 | ||
| Histological grade | |||||||
| Well | 12 | 8 | 4 | <0.01* | 10 | 2 | <0.01* |
| Mod | 27 | 9 | 18 | 15 | 12 | ||
| Poor | 18 | 1 | 17 | 1 | 17 | ||
| Metastasis | |||||||
| Positive | 15 | 7 | 8 | 0.128 | 9 | 6 | 0.158 |
| Negative | 42 | 11 | 31 | 17 | 25 | ||
| Vein invasion | |||||||
| Presence | 22 | 7 | 15 | 0.6 | 13 | 9 | 0.089 |
| Absence | 35 | 11 | 24 | 13 | 22 | ||
| Tumor size (cm) | |||||||
| ≤5 | 21 | 12 | 9 | 0.002* | 13 | 8 | 0.054 |
| >5 | 36 | 6 | 30 | 13 | 23 | ||
| No. of tumor nodes | |||||||
| Single | 29 | 11 | 18 | 0.223 | 11 | 18 | 0.179 |
| Multiple ≥2 | 28 | 7 | 21 | 15 | 13 | ||
| Capsular formation | |||||||
| Presence | 35 | 14 | 21 | 0.074 | 15 | 20 | 0.399 |
| Absence | 22 | 4 | 18 | 11 | 11 | ||
| HBsAg | |||||||
| (+) | 40 | 13 | 27 | 0.539 | 18 | 22 | 0.557 |
| (−) | 17 | 5 | 12 | 8 | 9 | ||
| Cirrhosis | |||||||
| Positive | 43 | 13 | 30 | 0.471 | 18 | 25 | 0.245 |
| Negative | 14 | 5 | 9 | 8 | 6 | ||
| AFP (ng/mL) | |||||||
| ≤50 | 30 | 13 | 17 | 0.041* | 18 | 12 | 0.021* |
| >50 | 27 | 5 | 22 | 8 | 19 | ||
Statistical analyses were performed by Pearson's χ² test
HCC human hepatocellular carcinoma, HBsAg hepatitis B surface antigen, AFP alphafeto protein
* P < 0.05 was considered significant
Tissue samples were immediately processed after surgical removal. For histological examination, all tumorous and surrounding non-tumorous tissue portions were processed in formalin and embedded in paraffin. Protein was analyzed in eight snap-frozen tumorous and adjacent non-tumorous tissue samples that were stored at −80 °C. Informed consent was obtained from all patients.
Immunohistochemistry
Tissue sections (1 μm) were cut, placed on APES-pretreated slides, deparaffinized, rehydrated through graded alcohol, and quenched in 3 % hydrogen peroxide. Antigen retrieval was performed by microwave heating at high power (750 W) in 10 mM sodium citrate buffer (pH 6.0) for three cycles of 5 min each. After blocking with normal serum for 1 h at room temperature, the sections were incubated overnight at 4 °C with anti-human KIF3B rabbit polyclonal antibody (diluted 1:200; R&D) and anti-Ki67 mouse monoclonal antibody (diluted 1:100; clone 7B11; Zymed Laboratories, San Francisco, CA, USA). Negative control slides were also processed in parallel using a nonspecific immunoglobulin IgG (Sigma Chemical Co., St. Louis, MO, USA) at the same concentration as the primary antibody. The positive immunostaining of reactive lymph node breast carcinoma specimens represented an internal-positive control for preservation of antigenicity in the sections examined. All slides were processed using the peroxidase-antiperoxidase method (Dako, Hamburg, Germany). Diaminobenzidine was used as the final chromogen, and Gills hematoxylin was used for counter-staining. For the assessment of KIF3B and Ki-67, five high-power fields were randomly chosen, and more than 500 cells were counted to determine the Labeling index (LI), which means the percentage of immunostained cells relative to the total number of cells [21]. The LI of KIF3B ranged from 8 to 90 %. The mean percentage of positive cells was 49 %. The LI of Ki-67 ranged from 3 to 67 %. The mean percentage of positive cells was 36 %. Tumors were scored as percentage of positive cells for each antigen. The KIF3B and Ki-67 immunostaining score were calculated as both the percentage of positively stained tumor cells and the staining intensity. The percent positivity of KIF3B was scored as follows: 0 (<10 % positive tumor cells); 1 (10–30 % positive tumor cells); 2 (30–50 % positive tumor cells); 3 (50–70 % positive tumor cells); and 4 (>70 % positive tumor cells). The percent positivity of Ki67 was scored as: 0 (5 % positive tumor cells); 1 (5–25 % positive tumor cells); 2 (25–45 % positive tumor cells); 3 (45–60 % positive tumor cells); 4 (>60 % positive tumor cells). Staining intensity was scored as “0” (no staining), “1” (weakly stained), “2” (moderately stained), or “3” (strongly stained). The immunostaining score was calculated as the percentage positive score × the staining intensity score and ranged from 0 to 12. A score of 0 was considered negative; 1–4 was considered weak; 5–9 was considered moderate; and 10–12 was considered strong. For statistical analysis, 0–4 were counted as low expression, while 5–12 were counted as overexpression [22].
Western Blot Analysis
Tissue and cell protein were promptly homogenized in a homogenization buffer containing 1 M Tris–HCl pH 7.5, 1 % Triton X-100,1 %NP40 (nonidet p-40), 10 % sodium dodecyl sulfate (SDS), 0.5 % sodium deoxycholate, 0.5 M EDTA, 10 μg/mL leupeptin, 10 μg/mL aprotinin, and 1 mM PMSF, then centrifuged at 10,000g for 30 min to collect the supernatant. Protein concentrations were determined with a Bio-Rad protein assay (Bio-Rad, Hercules, CA, USA). The supernatant was diluted in 2× SDS loading buffer and boiled. Proteins were separated with SDS-polyacrylamide gel electrophoresis (SDS-PAGE) and transferred to polyvinylidine difluoride filter (PVDF) membranes (Millipore, Bedford, MA, USA). The membranes were blocked with 5 % dried skim milk in TBST (20 mM Tris, 150 mM NaCl, 0.05 %Tween-20). After 2 h at room temperature, the membranes were incubated overnight with polyclonal antibody against using the primary antibodies. Antibodies used were as follows: anti-KIF3B (1:1,000; Santa Cruz Biotechnology); anti-p27Kip1 (1:500; Santa Cruz Biotechnology); anti-CDK2 (1:500; Santa Cruz Biotechnology); anti-cyclin A (1:500; Santa Cruz Biotechnology); anti-GAPDH (1:1,000; Sigma). Then horseradish peroxidase-linked IgG was used as the secondary antibody. Immunoreactive bands were visualized by chemiluminescence (NEN Life Science Products, Boston, MA, USA). After the chemiluminescence was exposed to X-ray films, the films were scanned using a Molecular Dynamics densitometer (Imaging Technology, Ontario, Canada). Values are responsible for at least three independent reactions.
Immunofluorescence
Cells were inoculated into the coverslip the day before synchronization. After synchronization, fixed with 3 % paraformaldehyde (1 h) and permeabilized with 0.1 % surfactant Triton X-100 (15 min). Nonspecific binding was blocked with 1 % BSA for 30 min. Next, the cells were incubated with rabbit anti-KIF3B antibody in 1 % BSA at 4 °C overnight. Cells were incubated in the dark with goat anti-rabbit IgG-fluorescein isothiocyanate (Santa Cruz, CA, USA) in 1 % BSA for 1 h at room temperature. The nuclei were counterstained with DAPI (Santa Cruz, CA, USA) for 10 min. Images were acquired using a Leica confocal microscope. Digital images of the fluorescent antibody-stained cells were acquired with software provided by Leica.
Cell Culture and Cell-Cycle Analysis
The Huh7, a HCC cell line, HepG2, a hepatoblastoma cell line and the LO2 normal liver cell line were obtained from our laboratory and were cultured in Dulbecco modified Eagle medium supplemented with 10 % fetal bovine serum (FBS), penicillin 100 U/mL, and streptomycin 100 μg/mL in 5 % CO2 at 37 °C. For cell-cycle analysis, specific experimental methods have been reported previously [23].
Cell Proliferation Assay
Cell proliferation was measured using the CCK-8 (cell counting Kit-8) assay following the manufacturer’s instructions. In brief, cells were seeded on a 96-well cell culture cluster (Corning Inc., Corning, NY, USA) at 2 × 10⁴/well in 100 μL medium and incubated overnight. Cell Counting Kit-8 (Dojindo, Kumamoto, Japan) reagents were added to a subset of wells under different treatments and incubated for 1 h at 37 °C, after which absorbance was measured at a test wavelength of 490 nm on an automated plate reader.
Plasmid Constructs siRNA and Transfection
The siRNAs species for the KIF3B knockdown were synthesized by Biomics (Nantong, China). The siRNA sequences were as follows: KIF3B-siRNA1, sense: 5′-GCAGAAACGUCGAGAAAGATT-3′; and antisense: 5′-UCUUUCUCGACGUUUCUGCTT-3′; KIF3B-siRNA2, sense = 5′-GAUCCCAGAAUCAACAAUATT-3′; and antisense = 5′-UAUUGUUGAUUCUGGGAUCTT-3′; KIF3B-siRNA3, sense: 5′-GGAGCUGAAACUCAAGCAUTT-3′; and antisense = 5′-AUGCUUGAGUUUCAGCUCCTT-3′; and negative control (NC), sense = 5′-UUCUCCGAACGUGUCACGUdTdT-3′; and antisense = 5′-ACGUGACACGUUCGGAGAAdTdT-3′. Cell transfection was performed with SuperFectin according to the manufacturer’s instructions.
Apoptosis Assay
The apoptosis assays were performed at 72 h after the cells were transfected with 20 mM siKIF3B or NC. The HepG2 cells transfected with siKIF3B or NC were washed three times in ice-cold PBS, resuspended in 100 μL of 1× Binding Buffer and incubated with Annexin V-FITC (Bestbio, China) for 15 min at 4°C in the dark, according to the manufacturer’s instructions. After staining, the cells were incubated with propidium iodide for 5 min at 4 °C in the dark and then analyzed using a flow cytometer (Beckman, USA).
Statistical Analysis
Statistical analysis was performed using the PASW statistics 18 software package. The association between Ki-67 and KIF3B expression and clinicopathological features was studied using the χ² test. Expression of Ki-67 and KIF3B were studied using the Spearman rank correlation test because the data were not normally distributed. Overall survival curves were calculated with the Kaplan–Meier method and were analyzed with the log-rank test. A Cox proportional-hazards analysis was used in univariate and multivariate analyses to explore the effects of KIF3B expression and HCC clinicopathological variables on survival. The results were expressed as mean ± SD and analyzed using the Mann–Whitney U test. Differences were considered significant at P < 0.05.
Result
KIF3B Protein Expression in Primary HCC Tissue Samples, Adjacent Non-tumor Tissue, and HCC Cell Lines
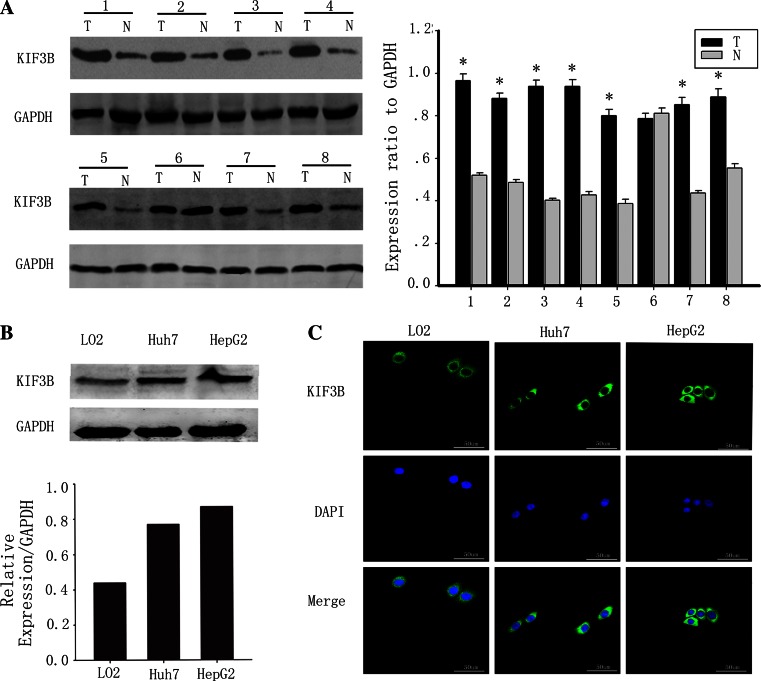
The expression of KIF3B was studied with immunoblotting in eight paired adjacent non-tumorous tissues and HCC biopsy samples. KIF3B was dramatically increased in the tumors as compared with the adjacent non-tumorous tissues (Fig. 1a). We next screened baseline KIF3B expression levels in the human HCC cells HepG2 and Huh7, the normal line LO2. The Huh7 and HepG2 HCC cell lines showed increased KIF3B protein levels relative to the LO2 normal liver cell line (Fig. 1b). The amount of GAPDH, a housekeeping protein, was demonstrated to be rather constant among the samples. We next found KIF3B expression was predominantly detected in the cytoplasm of the HCC cells HepG2 and Huh7, the normal line LO2 (Fig. 1c).
Fig. 1.
KIF3B is overexpressed in hepatocellular carcinoma but low or non existent in paired adjacent non-tumorous tissues. a Western blots of eight representative paired samples of hepatocellular carcinoma tissue (T) and adjacent non-tumorous tissues (N) immunoblotted against KIF3B. Whole-cell lysates were prepared from tissue specimens obtained from hepatocellular carcinoma and adjacent non-tumorous tissues. In all samples tested, KIF3B expression levels were significantly higher in hepatocellular carcinoma than in paired adjacent non-tumorous tissues. The bar chart demonstrates the ratio of KIF3B protein to GAPDH by densitometry. The data are mean ± SD of three independent experiments (*P < 0.01, tumor tissues compared with adjacent non-tumorous tissues). b The KIF3B protein expression was upregulated in the human hepatocellular carcinoma cell lines HepG2 and Huh7 cells, compared with the normal liver cell line LO2. c The KIF3B expression (green, mainly in the cytoplasm) in the LO2, Huh7 and HepG2 cells. The cell nuclei (blue) were stained with DAPI. Original magnification, ×400
Immunohistochemical Analysis of KIF3B Expression in HCC Clinical Samples and Its Relationship to Clinicopathological Parameters
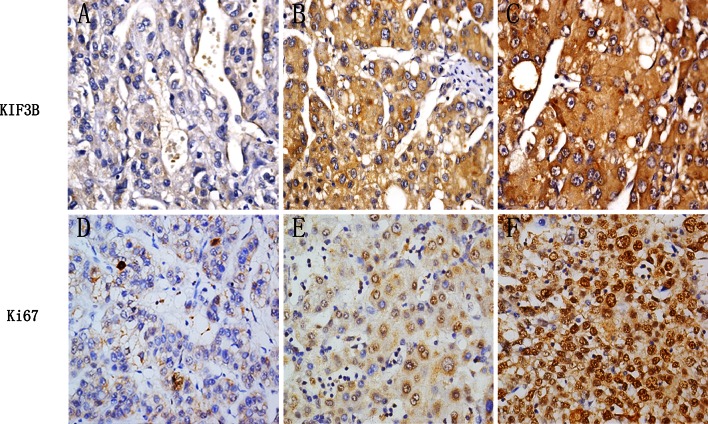
KIF3B expression was investigated in 57 samples from patients with HCC using immunohistochemical staining. Following the different histological grade, representative examples of reactivity for KIF3B and Ki-67 are shown in Fig. 2. In most specimens, the proportion of KIF3B-positive tumor cells was similar to the proportion of Ki-67-positive tumor cells. It was clear that poor histological grade examples had higher positive rates of all the two molecules than the well and moderate histological grade examples. KIF3B expression in HCC was scored as positive when expressing in the cytoplasm. Its LIs ranged from 8 to 90 %. The mean percentage of positive cell was 49 %. Ki-67 expression in HCC was scored as positive when expressing was strong in the nuclei. Its LIs ranged from 3 to 67 %. The mean percentage of positive cells was 36 %.
Fig. 2.
Immunohistochemical analysis of KIF3B and Ki-67 expression. Paraffin-embedded tissue sections were stained with antibodies against KIF3B and Ki-67 and counterstained with hematoxylin. The right row shows high expression of KIF3B and Ki-67 in poorly differentiated histological grade HCC tissues (SP × 400). The middle and the left rows are moderate and well differentiated histological grades, respectively. Details of the experiments are given in “Materials and methods”
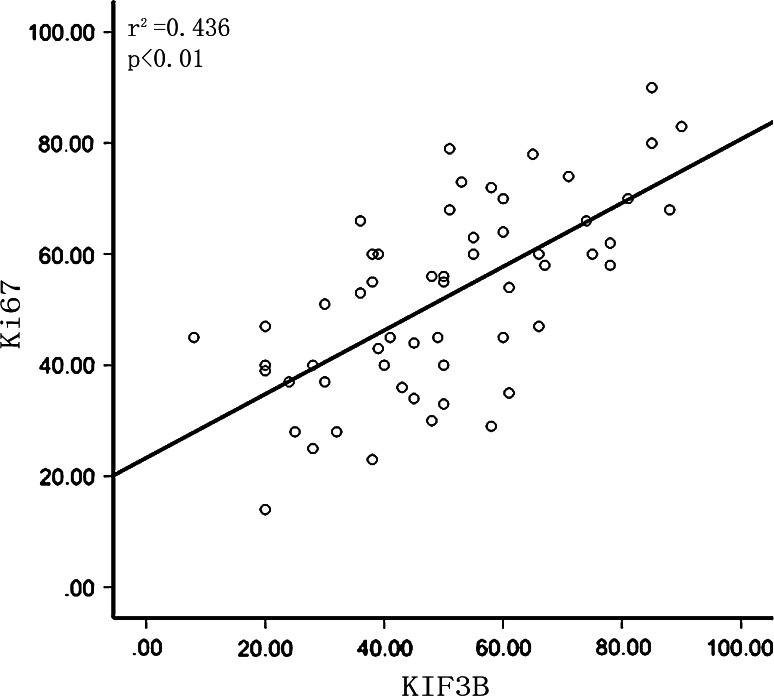
The clinicopathologic data of the patients are summarized in Table 1. We evaluated the relationship between KIF3B and Ki-67 expression with clinicopathologic variables. For statistical analysis of the expression of KIF3B and Ki-67, the carcinoma specimens were divided into high expressers and low expressers according to the score of KIF3B- and Ki-67-positive cells. Thus, KIF3B expression was significantly correlated with tumor size (P = 0.002), histological differentiation (P < 0.01) and the level of AFP (P = 0.041). There were no statistically significant differences in KIF3B expression and other prognostic factors (Table 1). Furthermore, in most specimens, tumors with high expression of KIF3B showed high expression of Ki-67. A positive correlation between KIF3B expression and Ki-67 on the basis of proliferative activity was found (P < 0.01; Fig. 3).
Fig. 3.
The relationship between Ki-67 and KIF3B expression in HCC. Scatterplot of Ki-67 versus KIF3B with regression line showing a correlation of them using the Spearman’s correlation coefficient (P < 0.01)
KIF3B Expression and Patient Survival
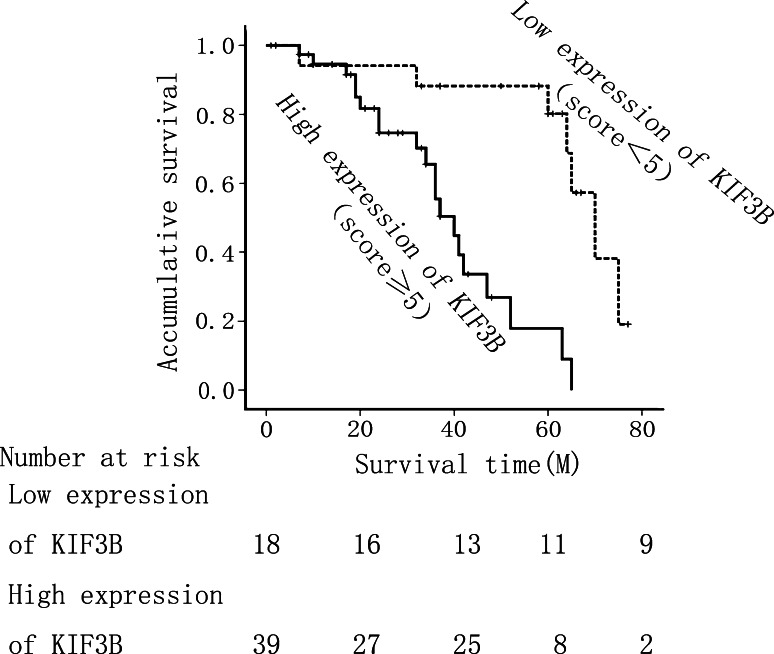
The prognostic value of KIF3B for overall survival in HCC patients was evaluated by comparing the patients with high and low KIF3B expression. According to the Kaplan–Meier survival analysis, high KIF3B expression was significantly associated with poor prognosis. The HCC patients with low KIF3B expression had obviously higher overall survival rates than did those with high KIF3B expression (Fig. 4, P < 0.010).
Fig. 4.
Kaplan–Meier survival curves for low KIF3B expression versus high KIF3B expression in 57 patients of HCC. On the basis of mean KIF3B percentages, patients were divided into high KIF3B expressers (score ≥5) and low KIF3B expressers (score ≤5). Patients in the high-expression KIF3B group had significantly shorter overall survival (P < 0.010)
Univariate and Multivariate Analyses of Prognostic Variables in HCC Patients
Further univariate and multivariate analyses were conducted using a Cox proportional-hazards model to examine the impact of KIF3B expression and other clinical pathological parameters in HCC patients. KIF3B expression and histological differentiation were significant prognostic factors in the univariate analysis (Table 2). Multivariate Cox regression analyses showed that KIF3B was an independent predictor. Thus, KIF3B expression may be useful for predicting the overall survival of HCC patients (P < 0.05, Table 2).
Table 2.
Univariate and multivariate analysis of overall survival in 57 HCC specimens
| Variables | Univariate analysis | Multivariate analysis | ||||
|---|---|---|---|---|---|---|
| HR | 95 % CI | P | HR | 95 % CI | P | |
| Age (years) | 0.60 | 0.211–1.728 | 0.25 | |||
| Gender | 1.02 | 0.297–3.559 | 0.60 | |||
| Histological grade | 2.14 | 1.411–3.249 | 0.02* | 1.38 | 0.823–2.333 | 0.22 |
| Metastasis | 2.61 | 0.710–9.655 | 0.12 | |||
| Vein invasion | 1.19 | 0.404–3.527 | 0.48 | |||
| Tumor size | 1.33 | 0.457–3.890 | 0.39 | |||
| No. of tumor nodes | 2.61 | 0.890–7.685 | 0.06 | |||
| Capsular formation | 0.86 | 0.298–2.502 | 0.50 | |||
| HBsAg | 1.79 | 0.582–5.549 | 0.23 | |||
| Cirrhosis | 1.52 | 0.466–4.980 | 0.34 | |||
| Serum AFP level | 1.24 | 0.438–3.536 | 0.44 | |||
| KIF3B | 4.26 | 2.14–10.84 | 0.006* | 6.736 | 2.249–19.315 | <0.01* |
| Ki67 | 2.28 | 1.41–4.82 | 0.03* | 2.354 | 1.017–5.452 | 0.04* |
Statistical analyses were performed by the Cox test analysis
HCC human hepatocellular carcinoma, HR hazard ratio, CI confidence interval, HBsAg hepatitis B surface antigen, AFP alphafeto protein
* P < 0.05 was considered significant
KIF3B Expression Is Elevated in Proliferating HCC Cells
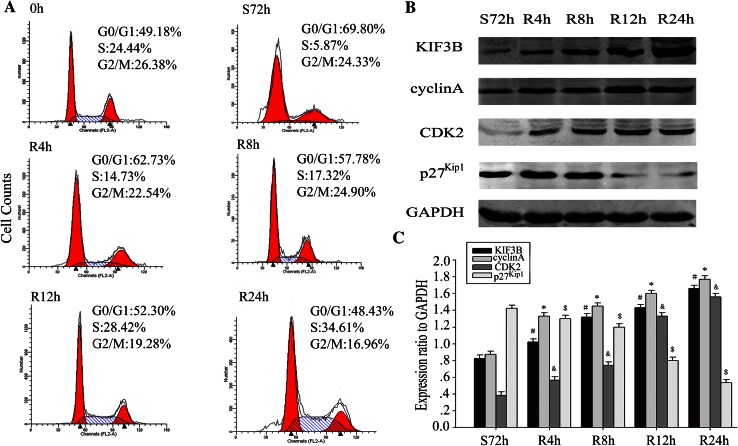
Based on the finding that KIF3B was associated with Ki-67 expression in HCC, we further detected the expression of KIF3B during cell cycle progression in HCC cells. HepG2 cells were arrested in G1 phase by serum deprivation for 72 h and the percentage of cells in the G1 phase was increased from 49.18 to 69.80 % (Fig. 5a). Then, the G1-arrested HepG2 cells were released through serum stimulation and harvested every 4 h for 24 h. Upon serum addition, the cells were reentered in the S phase (Fig. 5a). As expected, Western blots demonstrated that the expression of KIF3B was increased after serum stimulation in HepG2 cells. The expression of KIF3B was low in the G1 phase and high in the S phase. Meanwhile, the expression of cyclin A and CDK2 were upregulated, whereas the expression of p27Kip1 was inversely diminished in synchrony with the increase in the expression of KIF3B (Fig. 5b, c). These results indicated that KIF3B was upregulated during the progression of HCC cell proliferation.
Fig. 5.
Expression of KIF3B and cell cycle-related molecules in proliferating HCC cells. a Cells were synchronized at G1 phase then entered into the cell cycle by serum stimulation for 0, 4, 8, 12, or 24 h. Flow cytometry quantitation of cell cycle progress in HepG2. Following the cell cycle progression, most of the cells were in S phase. b HepG2 cells were serum-starved for 72 h and cell lysates were prepared at the indicated time points after serum refeeding, and analyzed by Western blot using antibodies directed against KIF3B, cyclin A, CDK2, p27Kip1 and GAPDH (a control for protein load and integrity). c The bar chart demonstrates the ratio of KIF3B, cyclin A, CDK2 and p27Kip1 protein to GAPDH for each time point by densitometry. The data are mean ± SEM (n = 3, # * & $, P < 0.01, compared with control: S72 h). S serum starvation, R serum release
Knockdown KIF3B Expression Suppressed Cell Proliferation in HCC Cell Lines
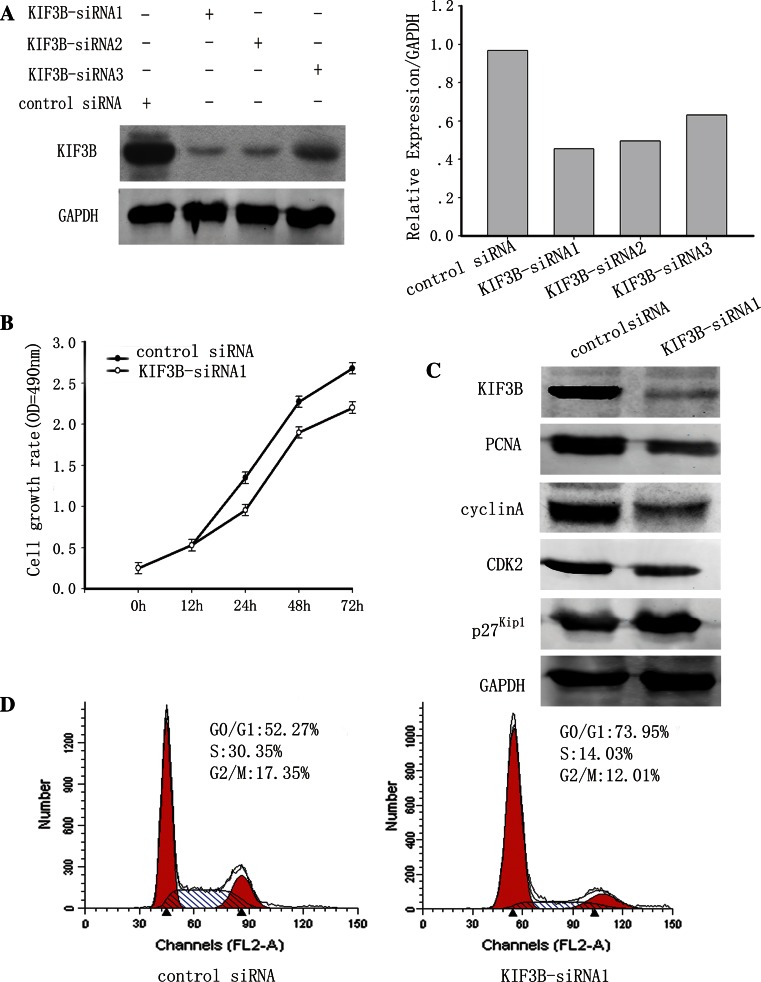
To further study the potential effects of KIF3B on HCC cell proliferation, we used siRNA to knockdown KIF3B expression in the HepG2 cells. HepG2 cells were transiently transfected with KIF3B-siRNA1-3 or control siRNA. After 72 h, KIF3B protein levels were substantially decreased in cells transfected with KIF3B siRNA compared to the control siRNA transfected cells (Fig. 6a). KIF3B-siRNA1 had the highest knockdown efficiency of the three siRNAs tested (Fig. 6a). Therefore, KIF3B-siRNA1 was used for all the subsequent experiments. To assess the effects of KIF3B knockdown on cell proliferation, anti-KIF3B-siRNA1 and control siRNA were transfected into HepG2 cells, and CCK-8 assay and Western blotting were performed. The CCK-8 assay of HepG2 cells treated with KIF3B-siRNA1 exhibited a significant decrease in the cell proliferation rate compared with the control siRNA (Fig. 6b). The expression of PCNA, a cell proliferation marker, was also downregulated (Fig. 6c). Besides, KIF3B knockdown also led to a downregulation of cyclin A and CDK2 in HepG2 cells, but the expression of p27Kip1 was upregulated (Fig. 6c). To determine whether the cell-cycle distribution changed after depletion of KIF3B in HCC cells, we performed flow cytometry 72 h after transient transfection of the KIF3B-siRNA1 expression vector. FACS analysis of cell cycle distribution discovered that KIF3B knockdown induced G0/G1 phase arrest, with a concomitant reduction in the number of cells in S phase compared with control siRNA (Fig. 6d), showing that KIF3B is required for G0/G1-S transition of cell cycle. These results demonstrated that KIF3B might participate in HCC cell proliferation.
Fig. 6.
Knockdown of KIF3B inhibited the HCC cells proliferation and M-phase entry. a KIF3B protein expression detected by Western blot 72 h after siRNA transfection of HepG2 cells. Western blotting showed that KIF3B-siRNA1 had the highest knockout efficiency of the three siRNAs tested. Therefore, KIF3B-siRNA1 was used for all the subsequent experiments. The bar chart below demonstrates the ratio of KIF3B protein to GAPDH by densitometry. The data are mean ± SEM (P < 0.01 compared with the control). b Cell proliferation was measured using the CCK-8 assay. Cell Counting Kit-8 reagents were added to the medium and incubated for an additional 2 h. Absorbance was measured to examine the siRNA-treated HepG2 cells. Data show mean ± SD of triplicates from one experiment representative of three experiments performed. *P < 0.05 versus control. c Western blot analysis of PCNA, cyclins A, CDK2 and p27Kip1 in KIF3B knockdown HepG2 cells. d 72-h post-transfection, cells transfected, as described above, were stained with PI for DNA content analysis by FACS. Details of the experiments are given in “Materials and methods”
Suppression of KIF3B Promotes Apoptosis via Inactivation of Akt Kinase
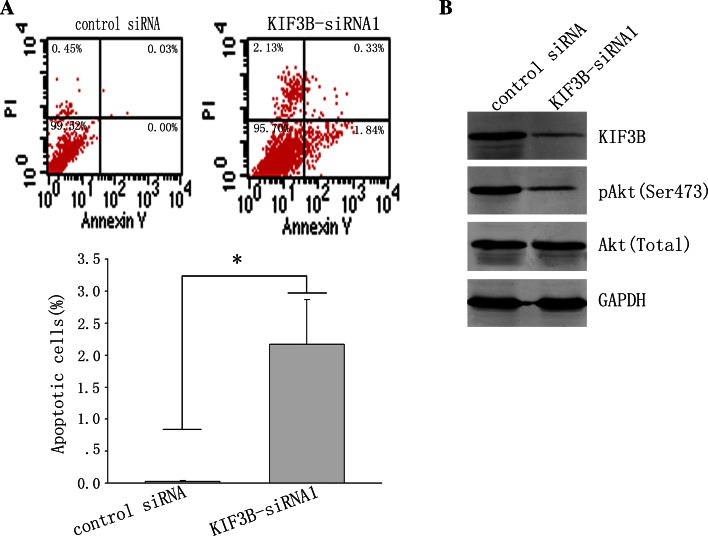
Finally, we detected the role of KIF3B in the apoptosis of HCC cells. Since suppression of KIF3B expression inhibited cancer cell growth, we monitored survival of KIF3B-siRNA1—transfected cells as well as control RNAi—transfected cells after detachment and replanting in dishes coated with polyhydroxyethylmethacrylate. Cell apoptosis assay revealed that, 72 h after transfection, silencing of KIF3B expression significantly increased cell apoptosis compared with control siRNA treatment (Fig. 7a). Therefore, these results suggest that inhibition of KIF3B in HepG2 cells decreases the growth and induces cell apoptosis. In order to further explore the mechanisms by which KIF3B inhibition induces apoptosis of HepG2 cells, we used Western blot to examine the potential effects of KIF3B inhibition on signaling pathways associated with apoptosis. As shown in Fig. 7b, inhibition of KIF3B expression led to downregulation of Akt Ser473 phosphorylation. These results suggest that inhibition of KIF3B disrupts cell survival via suppression of the phosphatidylinositol 3-kinase-Akt signaling pathway in HepG2 cells.
Fig. 7.
Downregulation of KIF3B in HepG2 cells promotes cell apoptosis. a HepG2 cells transfected with KIF3B siRNA1 or nonsense siRNA and cultured in a humidified (37 °C, 5 % CO2) incubator. After 72 h of growth, cells were harvested and measured for apoptosis using Annexin V-FITC apoptosis detection kit followed by flow cytometry analysis. b Cells were lysed and analyzed by Western blot. GAPDH was used as loading control.*P < 0.05
Discussion
Kinesin superfamily proteins have important roles in numerous cellular processes including intracellular transportation and cell division [11]. Studies have shown that the abnormal expression and function of kinesins play a key role in the development or progression of many kinds of human cancers. Takahashi et al. [24] suggested that downregulation of KIF23 inhibited glioma proliferation. Bie et al. [25] found that upregulation of KIF2C was associated with histopathological grades and poor prognosis of patients with glioma. Recently, Yang et al. [26] had found that KIF14 plays an important role in the pathogenesis of human HCC via affecting cell proliferation and invasion. The finding that polymorphism of the KIF1B gene may decrease the risk for HCC suggested that KIF1B may have a critical role in the development of HCC [27]. Therefore, we performed a detailed experimental analysis to investigate whether KIF3B has a novel role in hepatocarcinogenesis.
In the present study, we examined KIF3B protein expression in paired primary HCC samples and HCC cell lines using Western blotting. Our results suggested that KIF3B was overexpressed in most primary HCC tumor tissues. Compared with the normal liver cells, the expression of KIF3B was significantly increased in HCC cell lines. Consistent with these observations, immunohistochemical analyses also showed that KIF3B expression was increased in most HCC tumor tissues compared with the corresponding adjacent non-tumorous tissues. We also explored the correlation between KIF3B expression and Ki-67 immunoreactivity, a useful marker of tumor proliferative activity [28]. And expression of KIF3B and Ki-67 showed a positive correlation. Our study suggested that upregulated KIF3B expression might be closely associated with the pathogenesis of HCC.
In the immunohistochemical analysis, increased KIF3B expression in HCC was significantly related with tumor size, histological differentiation, serum AFP, Ki-67 and poor survival. The relationship between high KIF3B expression and larger tumor size suggested that the decline in KIF3B expression may not facilitate the rapid expansion of the tumor. Additionally, most of the poor histological grade HCC examples were positive for KIF3B expression, but KIF3B expression was profoundly weaker in the well and moderate histological grade tumor examples. Thus, decreased KIF3B expression is correlated with good differentiation in HCC cells and may further inhibit HCC progression.
Our Kaplan–Meier survival analysis showed that high expression of KIF3B was significantly linked to poor prognosis after surgical resection in the HCC patients (P < 0.01). In our study, patients with KIF3B overexpression were significantly correlated with poorer overall survival. Five-year overall survival rate of KIF3B expression-positive patients was 31.3 %, while that of KIF3B expression-negative patients was 56.8 %. In addition, multivariate analysis suggested that KIF3B protein was an independent prognostic factor for overall survival. These findings showed that KIF3B could be used as a new predictor of the prognosis of patients with HCC.
Further study confirmed the potential role of KIF3B in tumor cell proliferation. We detected the expression of KIF3B during cell-cycle progression in HCC cells, and found that the protein expression of KIF3B was upregulated during the G1- to S-phase transition. Furthermore, we discovered that the expression of cyclins A and CDK2 were increased during cell-cycle progression, whereas p27Kip1 was decreased. The p27Kip1 is one of the most important cell cycle inhibitors, and its expression has the character of a tumor suppressor gene. Loss of the p27Kip1 protein expression may result in tumor development and/or progression [29]. Many results demonstrated that the function of p27Kip1 is determined by its localization. Cytoplasmic mislocalization of p27Kip1 may ensure when its nuclear import is impaired or its export facilitated, and this is believed to affect the growth-inhibitory function of p27Kip1 [30]. KIF3B was located in the cytoplasm. P27Kip1 expression was throughout HepG2 cells, but mainly in the nucleus. After serum deprivation for 72 h, we found the transportation of KIF3B from the cytoplasm to the nucleus, p27Kip1 protein expression preferred to accumulate in the nucleus. After serum release for 12 h, KIF3B recovered its normal expression pattern as well as p27Kip1 (data not shown). From these results, we hypothesized that KIF3B affected the degradation of p27Kip1 in HCC cells by causing its accumulation in the cytoplasm. These results indicated that KIF3B has an oncogenic potential.
The CCK-8 assay showed that suppression of KIF3B expression by siRNA may inhibit cell proliferation. In addition, Western blotting indicated that PCNA, cyclins A and CDK2 expression were downregulated, while the expression of p27Kip1 was upregulated in KIF3B interference cells. Knockdown of KIF3B by siRNA significantly decelerated cell cycle progression of HepG2 cells. Our findings demonstrated that suppression of KIF3B may inhibit cell proliferation.
Apoptosis is a process of programmed cell death. As we know, normal cells use apoptosis to prevent abnormal cell proliferation, while cancer cells often overcome the process and migrate to new sites for their abnormal growth. Our results suggested that inhibition of KIF3B expression reduced the proliferation of hepatoma cells and induced apoptosis. Although the exact mechanism by which KIF3B is directly involved in the regulation of apoptosis remains to be clarified, our results indicate that suppression of KIF3B expression might inhibit the cell proliferation/survival via phosphatidylinositol 3-kinase-Akt signaling pathway, which is similar to the role of KIF18A during breast carcinogenesis [31]. Further research is required to determine how KIF3B activates the phosphatidylinositol 3-kinase-Akt signaling pathways.
In addition, it has been reported that HepG2 is a hepatoblastoma-derived cell line [32]. Our study showed that KIF3B expression had similar changes in HepG2 and HCC, and we hypothesized that KIF3B had a similar effect in HepG2 and HCC. However, further studies are necessary to elucidate the specific role of KIF3B in hepatoblastoma and HCC.
In conclusion, our study suggests that KIF3B plays an important role in HCC carcinogenesis, especially in tumor development, progression and proliferation. Cell culture studies confirmed that suppression of KIF3B expression by siRNA inhibited cell proliferation and induced cell cycle arrest and apoptosis in HCC cell lines. Our results provide evidence that KIF3B may serve as a novel prognostic biomarker and a new molecular therapy target for HCC.
Conflict of interest
None.
Footnotes
Xiaodong Huang and Fang Liu have contributed equally to this work.
Contributor Information
Yixin Zhang, Email: Zhangyix0513@163.com.
Tianyi Zhang, Email: pro_zty001@163.com.
References
- 1.Parkin DM, Pisani P, Ferlay J. Estimates of the worldwide incidence of 25 major cancers in 1990. Int J Cancer. 1999;80:827–841. doi: 10.1002/(SICI)1097-0215(19990315)80:6<827::AID-IJC6>3.0.CO;2-P. [DOI] [PubMed] [Google Scholar]
- 2.Parkin DM, Bray F, Ferlay J, Pisani P. Global cancer statistics, 2002. CA Cancer J Clin. 2005;55:74–108. doi: 10.3322/canjclin.55.2.74. [DOI] [PubMed] [Google Scholar]
- 3.Cancer incidence in five continents. Volume IX. IARC Sci Publ. 2008:1–837. [PubMed]
- 4.El-Serag HB, Mason AC. Rising incidence of hepatocellular carcinoma in the United States. N Engl J Med. 1999;340:745–750. doi: 10.1056/NEJM199903113401001. [DOI] [PubMed] [Google Scholar]
- 5.Schafer DF, Sorrell MF. Hepatocellular carcinoma. Lancet. 1999;353:1253–1257. doi: 10.1016/S0140-6736(98)09148-X. [DOI] [PubMed] [Google Scholar]
- 6.Itoh S, Maeda T, Shimada M, et al. Role of expression of focal adhesion kinase in progression of hepatocellular carcinoma. Clin Cancer Res. 2004;10:2812–2817. doi: 10.1158/1078-0432.CCR-1046-03. [DOI] [PubMed] [Google Scholar]
- 7.Frau M, Biasi F, Feo F, et al. Prognostic markers and putative therapeutic targets for hepatocellular carcinoma. Mol Aspects Med. 2010;31:179–193. doi: 10.1016/j.mam.2010.02.007. [DOI] [PubMed] [Google Scholar]
- 8.Hu TH, Huang CC, Lin PR, et al. Expression and prognostic role of tumor suppressor gene PTEN/MMAC1/TEP1 in hepatocellular carcinoma. Cancer. 2003;97:1929–1940. doi: 10.1002/cncr.11266. [DOI] [PubMed] [Google Scholar]
- 9.Okuda K. Hepatocellular carcinoma: clinicopathological aspects. J Gastroenterol Hepatol. 1997;12:S314–S318. doi: 10.1111/j.1440-1746.1997.tb00515.x. [DOI] [PubMed] [Google Scholar]
- 10.Vale RD, Reese TS, Sheetz MP. Identification of a novel force-generating protein, kinesin, involved in microtubule-based motility. Cell. 1985;42:39–50. doi: 10.1016/S0092-8674(85)80099-4. [DOI] [PMC free article] [PubMed] [Google Scholar]
- 11.Miki H, Okada Y, Hirokawa N. Analysis of the kinesin superfamily: insights into structure and function. Trends Cell Biol. 2005;15:467–476. doi: 10.1016/j.tcb.2005.07.006. [DOI] [PubMed] [Google Scholar]
- 12.Yu Y, Feng YM. The role of kinesin family proteins in tumorigenesis and progression: potential biomarkers and molecular targets for cancer therapy. Cancer. 2010;116:5150–5160. doi: 10.1002/cncr.25461. [DOI] [PubMed] [Google Scholar]
- 13.Wang Q, Wang L, Li D, et al. Kinesin family member 14 is a candidate prognostic marker for outcome of glioma patients. Cancer Epidemiol. 2013;37:79–84. doi: 10.1016/j.canep.2012.08.011. [DOI] [PubMed] [Google Scholar]
- 14.Yu X, Wen H, Cao J, et al. Temporal and spatial expression of KIF3B after acute spinal cord injury in adult rats. J Mol Neurosci. 2013;49:387–394. doi: 10.1007/s12031-012-9901-7. [DOI] [PubMed] [Google Scholar]
- 15.Tuma MC, Zill A, Le Bot N, et al. Heterotrimeric kinesin II is the microtubule motor protein responsible for pigment dispersion in Xenopus melanophores. J Cell Biol. 1998;143:1547–1558. doi: 10.1083/jcb.143.6.1547. [DOI] [PMC free article] [PubMed] [Google Scholar]
- 16.Takeda S, Yamazaki H, Seog DH, et al. Kinesin superfamily protein 3 (KIF3) motor transports fodrin-associating vesicles important for neurite building. J Cell Biol. 2000;148:1255–1265. doi: 10.1083/jcb.148.6.1255. [DOI] [PMC free article] [PubMed] [Google Scholar]
- 17.Jimbo T, Kawasaki Y, Koyama R, et al. Identification of a link between the tumour suppressor APC and the kinesin superfamily. Nat Cell Biol. 2002;4:323–327. doi: 10.1038/ncb779. [DOI] [PubMed] [Google Scholar]
- 18.Fan J, Beck KA. A role for the spectrin superfamily member Syne-1 and kinesin II in cytokinesis. J Cell Sci. 2004;117:619–629. doi: 10.1242/jcs.00892. [DOI] [PubMed] [Google Scholar]
- 19.Keil R, Kiessling C, Hatzfeld M. Targeting of p0071 to the midbody depends on KIF3. J Cell Sci. 2009;122:1174–1183. doi: 10.1242/jcs.045377. [DOI] [PubMed] [Google Scholar]
- 20.Lukong KE, Richard S. Breast tumor kinase BRK requires kinesin-2 subunit KAP3A in modulation of cell migration. Cell Signal. 2008;20:432–442. doi: 10.1016/j.cellsig.2007.11.003. [DOI] [PubMed] [Google Scholar]
- 21.Xu X, Yamamoto H, Sakon M, et al. Overexpression of CDC25A phosphatase is associated with hypergrowth activity and poor prognosis of human hepatocellular carcinomas. Clin Cancer Res. 2003;9:1764–1772. [PubMed] [Google Scholar]
- 22.Yu C, Chen K, Zheng H, et al. Overexpression of astrocyte elevated gene-1 (AEG-1) is associated with esophageal squamous cell carcinoma (ESCC) progression and pathogenesis. Carcinogenesis. 2009;30:894–901. doi: 10.1093/carcin/bgp064. [DOI] [PubMed] [Google Scholar]
- 23.Ke Q, Ji J, Cheng C, et al. Expression and prognostic role of Spy1 as a novel cell cycle protein in hepatocellular carcinoma. Exp Mol Pathol. 2009;87:167–172. doi: 10.1016/j.yexmp.2009.07.011. [DOI] [PubMed] [Google Scholar]
- 24.Takahashi S, Fusaki N, Ohta S, et al. Downregulation of KIF23 suppresses glioma proliferation. J Neurooncol. 2012;106:519–529. doi: 10.1007/s11060-011-0706-2. [DOI] [PubMed] [Google Scholar]
- 25.Bie L, Zhao G, Wang YP, et al. Kinesin family member 2C (KIF2C/MCAK) is a novel marker for prognosis in human gliomas. Clin Neurol Neurosurg. 2012;114:356–360. doi: 10.1016/j.clineuro.2011.11.005. [DOI] [PubMed] [Google Scholar]
- 26.Yang T, Zhang XB, Zheng ZM. Suppression of KIF14 expression inhibits hepatocellular carcinoma progression and predicts favorable outcome. Cancer Sci. 2013;104:552–557. doi: 10.1111/cas.12128. [DOI] [PMC free article] [PubMed] [Google Scholar]
- 27.Wang ZC, Gao Q, Shi JY, et al. Genetic polymorphism of the kinesin-like protein KIF1B gene and the risk of hepatocellular carcinoma. PLoS One. 2013;8:e62571. doi: 10.1371/journal.pone.0062571. [DOI] [PMC free article] [PubMed] [Google Scholar]
- 28.Mann CD, Neal CP, Garcea G, et al. Prognostic molecular markers in hepatocellular carcinoma: a systematic review. Eur J Cancer. 2007;43:979–992. doi: 10.1016/j.ejca.2007.01.004. [DOI] [PubMed] [Google Scholar]
- 29.Lloyd RV, Erickson LA, Jin L, et al. p27kip1: a multifunctional cyclin-dependent kinase inhibitor with prognostic significance in human cancers. Am J Pathol. 1999;154:313–323. doi: 10.1016/S0002-9440(10)65277-7. [DOI] [PMC free article] [PubMed] [Google Scholar]
- 30.Baldassarre G, Belletti B, Bruni P, et al. Overexpressed cyclin D3 contributes to retaining the growth inhibitor p27 in the cytoplasm of thyroid tumor cells. J Clin Invest. 1999;104:865–874. doi: 10.1172/JCI6443. [DOI] [PMC free article] [PubMed] [Google Scholar]
- 31.Zhang C, Zhu C, Chen H, et al. Kif18A is involved in human breast carcinogenesis. Carcinogenesis. 2010;31:1676–1684. doi: 10.1093/carcin/bgq134. [DOI] [PubMed] [Google Scholar]
- 32.Lopez-Terrada D, Cheung SW, Finegold MJ, et al. Hep G2 is a hepatoblastoma-derived cell line. Hum Pathol. 2009;40:1512–1515. doi: 10.1016/j.humpath.2009.07.003. [DOI] [PubMed] [Google Scholar]


