

Abstract
We prove an old conjecture on oscillation of functions that have a spectral gap at the origin. Suppose that the Fourier transform of a real measure f on the real line satisfies f̂(x) = 0 for x ∈ (–a, a). Then, when r → ∞, the asymptotic lower density of the sequence of sign changes of f on the intervals [0, r) is at least a/π. This still holds for some wider classes of measures characterized by their rate of growth at infinity, but if the growth is faster than a certain threshold, the above statement is no longer true.
We say that a real function on the real line has a spectral gap if its Fourier transform is zero in a neighborhood of the origin. In communication engineering, such functions are called high-pass signals. It is known that functions with a spectral gap oscillate. The simplest result of this sort goes back to Sturm (1): Every real trigonometric polynomial of the form
 |
has at least 2m sign changes on every period. Hurwitz extended this result to arbitrary periodic functions whose first m harmonics vanish. At least three different proofs of the Sturm–Hurwitz theorem can be found in ref. 2 (II-141, III-184, and VI-57), and yet another one in ref. 3.
In this article, we discuss generalizations of the Sturm–Hurwitz theorem to nonperiodic functions. We use the standard notation for the spaces of Schwartz's distributions,  (the dual to the space 𝒟 of smooth functions with compact support) and
  (tempered distributions) on the real line, and we identify
  with a subspace of
  as in ref. 4. A distribution f is called real if (f, φ) is real for every real test function φ. The number of sign changes of a real distribution f on an interval (0, r) is denoted by s(r, f). It is defined as the minimal degree of real polynomials p such that the restriction of pf on (0, r) is a nonnegative distribution (measure). For example, the distribution δ – 1 has two sign changes on any interval containing zero. It is clear that s(r, f) is an integer-valued increasing function. If s(r, f) < ∞ for every r, then the sequence of points of jump of s(r, f) tends to infinity. This sequence (rk), where each term is repeated according to the magnitude of the jump, will be called the sequence of sign changes of f.
The earliest generalization known to us of the Hurwitz theorem to nonperiodic case is due to M. G. Krein and B. Levin (ref. 5, Appendix II):
For real measures f of bounded variation on the real line, the condition f̂(x) = 0, x ∈ (–a, a) implies that S(r, f) ≥ 2ar/π + O(1), r → ∞, where
 |
[1] |
is the “average density function” of sign changes. Recently, this result was improved and extended by Ostrovskii and Ulanovskii (6); in particular, they showed that the Krein–Levin theorem remains valid under the weaker assumption that f(x)/(1 + x2) is of bounded variation. In particular, their result applies to all real bounded functions.
In 1965 B. Logan, in his thesis (7) on high-pass signals, conjectured that
 |
[2] |
for functions f with a spectral gap (–a, a). The example f(t) = cos t, which has a spectral gap (–1, 1) and s(r, f) = r/π + O(1), shows that this estimate is best possible.
Logan proved 2 under the additional assumption that f is a bounded function with bounded spectrum. The latter condition, meaning that supp f̂ is bounded, is crucial for his proof to work. Logan's conjecture was repeated in several places, including refs. 8 and 9. In the commentary to this conjecture, B. Kuksin (8) sketched a proof of 2 for almost all trajectories f of a Gaussian stationary process whose correlation function has a spectral gap (–a, a) (this implies that almost all trajectories have this spectral gap as well).
Our main result confirms Logan's conjecture for a class of measures which contains for example all locally integrable tempered distributions  . A positive even function on the real line, concave† on some ray [t0, +∞), will be called a weight.
Theorem 1. Let ω be a weight satisfying
 |
[3] |
and f = dF a real measure whose variation is bounded on every finite interval and
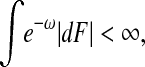 |
[4] |
where |dF| is the variation of f. If f has a spectral gap (–a, a), then 2 holds.
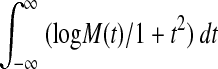
To discuss the role of the growth conditions 4 and 3, we recall a general definition of spectrum, which goes back to Carleman (11). Suppose that a distribution f ∈  satisfies
 |
[5] |
If f is a measure, then 5 is weaker than 4. Let η be a smooth function with the properties: supp η ⊂ [–1, ∞) and η(t) + η(–t) ≡ 1. Then the two halves of the Fourier transform of f
 |
are holomorphic in the upper and lower half-planes of the complex z-plane, respectively. The pair of functions F = (F+, F–) is called the Fourier–Carleman transform of f. If f ∈  , then the functions F± have boundary values in the sense
  , and f̂ is the difference of these boundary values. Moreover, if the restriction of f̂ is zero on some interval I on the real line, then F+ and F– are analytic continuations of each other across this interval I. This ensures that the following definition of the spectrum is consistent with the usual one as the support of the Fourier transform.
Definition 1: The spectrum of a distribution f that satisfies 5 is the complement of the maximal open set U ⊂ R ∪ {∞} such that F± are analytic continuations of each other through U. A spectral gap is an interval (–a, a) ⊂ U.
Changing η in the definition of F± adds an entire function to both F+ and F–, so the spectrum depends only on f. A theorem of Pólya characterizes the class of distributions satisfying 5 with spectrum on an interval [–b, b]: this class coincides with the class of entire functions of exponential type whose indicator diagrams are contained in the interval [–ib, ib] of the imaginary axis (5). Definition 1 relates our subject with the classical topic of analytic continuation (12).
It turns out that the growth conditions 4 and 3 are crucial for validity of Theorem 1, and in certain sense these conditions are best possible.
Theorem 2. Let ω be a weight with divergent integral 3. Given two positive numbers a < b, there exists a real function f ≠ 0 with the property |f| < exp ω, such that the spectrum of f is contained in [–b, –a] ⊂ [a, b], but 2 fails.
Convergence or divergence of the integral 3 is a fundamental dichotomy in Harmonic Analysis (13–16).
Thus 2 may fail for functions that satisfy only 5. However, developing the ingenious idea of Levin, one can estimate from below the average density function 1 of sign changes of such distributions.
Theorem 3. If a real distribution f ≠ 0 satisfies 5, and has a spectral gap (–a, a), then
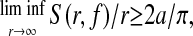 |
[6] |
where S(r, f) is defined in 1.
We notice that the spectrum of a function f satisfying 5 may consist of the single point ∞. This happens when F± are restrictions of an entire function F to the upper and lower half-planes. To obtain such example, take any entire function that satisfies F(z) = O(z–2) as z → ∞ on the sets {z: |Im z| ≥ ε}, for every ε > 0, and define f as the inverse Fourier–Carleman transform:
 |
where γ is the oriented boundary of the strip {z: |Im z| = ε}, and ε > 0. Our Theorem 3 implies that for such functions f, S(r, f)/r → ∞.
Sketch of the Proof of Theorem 1: The proof is quite technical, so we only describe the main steps.
First we reduce the problem to the case that f is real analytic, replacing f by the convolution ft = Kt * f with the heat kernel Kt = (πt)–1/2 exp(–x2/t), t > 0. This does not change the spectrum and does not increase the number of sign changes. The latter property, discovered by Sturm, was subject of a series of beautiful generalizations of Kellogg (17), Pólya (3), Shoenberg (18), and others. However, the existing results are not sufficient for our purposes because they apply only to functions with finitely many changes of sign on the whole real axis, whereas we need to control this number on every interval [0, r]. To prove what is needed, we extend the original approach of Sturm based on the qualitative theory of the heat equation.
The next step is representing f as the real part of a function h holomorphic in the upper half-plane, whose spectrum belongs to [a, ∞). Such representations were also used by Levin and Logan. To obtain them, one multiplies the Fourier transform of f by the Heaviside function and takes the inverse transform. After this, it is enough to estimate from below (a suitable continuous branch of) the argument arg h(t) as t → +∞. Indeed, assuming for simplicity that h(t) ≠ 0 for all real t, we notice that every turn of h(t) counterclockwise around zero forces f = Re h to change sign at least twice.
The growth restrictions 4 and 3 on f are used to prove that h ∈ N, the Nevanlinna class of functions of bounded characteristic in the upper half-plane (19). To show this, we use a multiplier, that is an entire function g of arbitrarily small exponential type, with only real zeros, and such that g exp ω is bounded on the real line. The existence of multipliers for nice weights was known to Paley and Wiener (13); the result in this direction with minimal assumptions about the weight is due to Beurling and Malliavin (10, 15, 16). Choosing a multiplier g, we arrange that gf is integrable on the real line. Then we represent gf as a real part of an analytic function h1 in the upper half-plane by using the Cauchy integral. This function h1 can be shown to belong to a Hardy space, and thus to the space N. As the multiplier belongs to N as well, and has only real zeros, we conclude that h = h1/g ∈ N.
Next we use the Nevanlinna representation of functions of the class N:
 |
[7] |
where a′ is a real number, B a Blaschke product in the upper half-plane, u the Poisson integral of log |h(x)|, and ν a harmonic conjugate of u. This function ν can be expressed by a formula that is called the Hilbert transform of u.
It is the number a′ in 7 that is responsible for the growth of arg h(x) on the real line. The information about the spectrum of h implies that a′ ≥ a, which gives 2, after an estimation of the contribution to arg h(x) of the rest of the terms in 7. The Blaschke product has increasing argument, which can only help, and the contribution of ν is estimated using the Kolmogorov's inequality for the Hilbert transform (15).
Acknowledgments
We thank A. Gabrielov, I. Ostrovskii, and M. Sodin for their remarks. A.E. was supported by National Science Foundation (NSF) Grant DMS 0100512 and by the Humboldt Foundation, and D.N. was supported by NSF Grant DMS 0200861 and by the McDonnell Foundation.
Footnotes
The assumption of concavity is made only to simplify the discussion. Each of our results holds under some weaker assumptions on the regularity of the weight, for example, Theorem 1 holds for those weights that satisfy the conditions of the Beurling–Malliavin Multiplier Theorem (10).
References
- 1.Sturm, Ch. (1836) J. Math. Pures Appl. 1, 373–444. [Google Scholar]
- 2.Pólya, G. & Szegö, G. (1925) Aufgaben and Lehrsätze aus der Analysis, B I–II (Springer, Berlin).
- 3.Pólya, G. (1933) Z. Angew. Math. Mech. 13, 125–128. [Google Scholar]
- 4.Hörmander, L. (1983) The Analysis of Linear Partial Differential Operators (Springer, Berlin), Vols. I and II.
- 5.Levin, B. (1980) Distribution of Zeros of Entire Functions (Am. Math. Soc., Providence, RI), revised edition.
- 6.Ostrovskii, I. & Ulanovskii, A. (2003) C. R. Acad. Sci. Paris 336, 325–330. [Google Scholar]
- 7.Logan, B. (1965) Ph.D. thesis (Columbia Univ., NY).
- 8.Arnold, V. I. (2000) Arnold's Problems (Fazis, Moscow); Russian, English translation in preparation.
- 9.Shapiro, H. (2001) in Twentieth Century Harmonic Analysis, ed. Byrnes, J. (Kluwer, Dordrecht, The Netherlands), pp. 383–384.
- 10.Beurling, A. & Malliavin, P. (1967) Acta Math. 118, 291–309. [Google Scholar]
- 11.Carleman, T. (1944) L'Intégrale de Fourier et Questions qui s'y Rattachent (Inst. Mittag-Leffler, Djurskolm, Sweden).
- 12.Bieberbach, L. (1955) Analytische Fortsetzung (Springer, Berlin).
- 13.Paley, R. & Wiener, N. (1934) Fourier Transform in the Complex Domain (Am. Math. Soc., Providence, RI).
- 14.Beurling, A. (1939) 9 Congr. Math. Scand. Helsinki, 345–366.
-
15.Koosis, P. (1988)
 . The Logarithmic Integral (Cambridge Univ. Press, Cambridge, U.K.).
- 16.Havin, V. & Joricke, B. (1994) The Uncertainty Principle in Harmonic Analysis (Springer, New York).
- 17.Kellogg, O. (1916) Am. J. Math. 38, 1–5. [Google Scholar]
- 18.Schoenberg, I. (1948) Proc. Natl. Acad. Sci. USA 34, 164–169. [DOI] [PMC free article] [PubMed] [Google Scholar]
- 19.Zygmund, A. (1959) Trigonometric Series (Cambridge Univ. Press, Cambridge, U.K.), Vol. I.