

Abstract
Multiple sclerosis (MS) is an inflammatory CNS disease with a substantial genetic component, originally mapped to only the human leukocyte antigen (HLA) region. In the last 5 years, a total of seven genome-wide association studies and one meta-analysis successfully identified 57 non-HLA susceptibility loci. Here, we merged nominal statistical evidence of association and physical evidence of interaction to conduct a protein-interaction-network-based pathway analysis (PINBPA) on two large genetic MS studies comprising a total of 15,317 cases and 29,529 controls. The distribution of nominally significant loci at the gene level matched the patterns of extended linkage disequilibrium in regions of interest. We found that products of genome-wide significantly associated genes are more likely to interact physically and belong to the same or related pathways. We next searched for subnetworks (modules) of genes (and their encoded proteins) enriched with nominally associated loci within each study and identified those modules in common between the two studies. We demonstrate that these modules are more likely to contain genes with bona fide susceptibility variants and, in addition, identify several high-confidence candidates (including BCL10, CD48, REL, TRAF3, and TEC). PINBPA is a powerful approach to gaining further insights into the biology of associated genes and to prioritizing candidates for subsequent genetic studies of complex traits.
Introduction
Genome-wide association studies (GWASs) are a powerful approach to examining the genetic components of complex diseases. A commonly utilized strategy in the analysis of GWASs involves the evaluation of individual markers with the use of a genome-wide significance cutoff p value of 5 × 10⁻⁸ under the assumption of independence among markers. This approach minimizes false discoveries and has indeed enjoyed remarkable success by uncovering multiple variants associated with complex diseases and traits.1 However, the very small fraction of both the heritable component and the population disease burden explained by the polymorphisms identified in most GWAS initiatives suggest that a sizable proportion of risk alleles are still being missed by this strategy.2,3 It is likely that alternative GWAS-data-analysis approaches that focus on the combined effects of many loci, each making a small contribution to overall disease susceptibility, might reveal insights into the genetic basis of common chronic disease. An interesting study by the International Schizophrenia Consortium proved that by the analysis of markers en masse with a significance threshold as modest as 0.1, important information can be obtained from a well-powered GWAS.4 More recently, a similar approach was applied to multiple sclerosis (MS [MIM 126200]) with the use of data from two independent GWASs and implicated thousands of markers with p < 0.2, suggesting a clear polygenic model of disease susceptibility.5
Furthermore, it is highly probable that results of univariate, single-locus analyses contain informative trends that, when viewed in the contexts of genetic networks and fundamental molecular pathways, can expose aspects of the polygenic basis of disease susceptibility. A number of efforts to study biologically meaningful combinations of genes and markers have been reported and have ranged from the simple computation of overrepresentation of associated loci in gene ontology (GO) or KEGG pathways6 up to more elaborated methods using enrichment of gene sets.7–10 An advanced modification of these methods incorporates the use of protein-interaction networks (PINs) and searches for subnetworks (modules) enriched with the associated genes. This approach increases the prior probability of an association by merging statistical evidence of marker-gene association and physical evidence of interaction among those gene products (proteins). Several versions of this approach have been reported in multiple complex traits, including autoimmune and neurological diseases.11–18
MS is a common inflammatory CNS disease with a well-documented genetic component.19,20 Seven moderately powered but independent GWASs and one meta-analysis were reported between 2007 and 2011 and all together identified 23 associated loci outside of the human leukocyte antigen (HLA) genomic region.21–27 Later, a meta-analysis (referred to as meta2.5 in this study) including most of these samples was carried out, and evidence of association for two additional loci was reported.28 In collaboration with the Wellcome Trust Case Control Consortium 2 (WTCCC2), the International MS Genetics Consortium (IMSGC) recently completed the largest MS GWAS (referred to as the WTCCC2 data set in this study) to date and raised the number of non-HLA genetic loci associated with this disease to 57.29
Despite this notable progress, our understanding of MS genetics remains incomplete. To further unravel the missing heritability in MS, we conducted a PIN-based pathway analysis (PINBPA) of these two largely independent GWAS MS data sets (meta2.5 and WTCCC2), which together contained a total of more than 15,000 cases and almost 30,000 controls. We found that proteins encoded by genes harboring risk variants are more likely to interact and take part in the same or related pathways. Furthermore, additional susceptibility variants were identified through this approach.
Subjects and Methods
Data Sets and Preprocessing
p values for all tested SNPs (summary-level data) were collected for two MS data sets (WTCCC2 and meta2.5) and, as controls, one data set each for type 1 diabetes (T1D [MIM 222100]), rheumatoid arthritis (RA [MIM 180300]), Crohn disease (CD [MIM 266600]), coronary artery disease (CAD [MIM 611139]), hypertension (HT [MIM 145500]), and type 2 diabetes (T2D [MIM 125853]) (all from WTCCC1).30 All data sets are composed of samples of European descent. The WTCCC2 MS data set29 consists of 9,772 cases and 17,376 controls analyzed with the Illumina Human 660-Quad and Illumina 1.2M platforms. The meta2.5 data set is an imputation-based meta-analysis with 2,529,394 unique SNPs28 and includes all previously published MS GWASs (5,545 cases and 12,153 controls in total) and minimum case overlap (less than 10%) with the WTCCC2 data set. Thus, these two data sets are considered independent in the context of the present study. Table S1, available online, summarizes details of each study used in this work. In order to enrich for potentially functional variants, we filtered each data set so as to keep only those SNPs that were nonsynonymous and potentially deleterious (classified as either probably or possibly damaging by PolyPhen-231) or located in 5′ or 3′ UTRs, transcription-factor binding sites (TFBSs), or histone binding sites. To further reduce the number of redundant SNPs, we eliminated those that were in close linkage disequilibrium (LD) (R2 > 0.9).
All data used in this manuscript were obtained according to procedures in agreement with the ethical standards of the responsible committees on human experimentation (institutional and national), and proper informed consent was obtained.
Computing Gene-Wise p Values and Association Blocks
Because this study examines the functional relationships of genes and proteins, we needed to consider gene-level significance. To that end, we used VEGAS, a previously described method of converting individual SNPs into gene-wise p values.32 VEGAS assigns SNPs to each of 17,787 autosomal genes according to positions on the UCSC Genome Browser (hg18 assembly). For the capture of regulatory regions and SNPs in LD, gene boundaries are defined as 50 kb beyond the 5′ and 3′ UTRs of each gene. VEGAS takes into account LD patterns between markers within a gene by using Monte-Carlo simulations from the multivariate normal distribution on the basis of the LD structure of a set of reference individuals (the HapMap2 CEU [Utah residents with ancestry from northern and western Europe from the CEPH collection] population). In VEGAS, the number of simulations per gene is determined adaptively. In the first stage, 103 simulations are performed. If the resulting empirical p value is less than 0.1, 104 simulations are then performed. If the empirical p value from 104 simulations is less than 0.001, the program will perform 106 simulations. At each stage, the simulations are mutually exclusive. For computational reasons, if the empirical p value is 0, then no more simulations will be performed. An empirical p value of 0 from 106 simulations can be interpreted as p < 10−6, which exceeds a Bonferroni-corrected threshold of p < 2.8 × 10⁻⁶ (≈0.05/17,787; this threshold is likely to be conservative given the overlap between genes).
We defined association blocks as those groups of sequential genes with a p value < 0.05. A block_id was assigned to each association block along the genome for each study.
PINBPA
We downloaded the entire iRefIndex database, a collection of 15 human PIN data sets from different sources, and computed the union data set. This set comprised more than 400,000 interactions among ∼25,000 proteins. However, many of these interactions were either predicted or backed up by a single experiment (i.e., a single publication). In order to minimize the rate of false positives, we then filtered this large network to keep only those interactions that were described in at least two independent publications. This resulted in a network of 8,960 proteins (nodes) and 27,724 interactions (edges). We used this high-confidence network for all subsequent analyses. The network was uploaded into Cytoscape 2.8.2 and annotated with genomic position, gene-wise p value, block_id, and bona fide genes (loaded as node attributes) for all studies analyzed. To avoid the complexity of the HLA region, we did not include p values for genes mapping to the 6p21.3 region as attributes. However, the nodes corresponding to those genes were left in the network, given that they might still participate in relevant subnetworks with other significant genes.
For each data set, we computed significant first-order interactions by filtering the main network so as to keep only those genes (and their encoded proteins) with VEGAS p values < 0.05. Then, the number of resulting nodes and edges and the size of the largest connected component were computed within Cytoscape. To evaluate the likelihood that these numbers were obtained by chance (as a consequence of the sheer number of interactions), we computed 1,000 simulations by assigning p values at random from the same network and creating subnetworks of similar size. These simulations were used as background for estimating the significance of the subnetworks obtained with the real gene-wise p values.
We then used the program (plugin) jActiveModules to conduct searches of subnetworks enriched with (but not necessarily composed of) genes with significant p values. Although jActiveModules was originally designed to discover “active” subnetworks by evaluating network connectedness among differentially expressed transcripts, we adapted it to take association p values instead.33 jActiveModules starts by converting each gene p value into a Z score by using the inverse normal cumulative distribution function. Then, it produces an aggregate Z score (ZA) for an entire subnetwork A of k genes by summing the Zi over all genes in the subnetwork .
For the proper capture of the connection between genetic association and network topology, the probability of obtaining a given ZA score by chance must be evaluated. This is accomplished by the random sampling of gene sets of size k with a Monte Carlo approach, computing their ZA scores, and then using these for deriving estimates for the score mean μk and SD σk for each k. Because the means and SD are expected to be a smooth function of k, noise in the Monte Carlo estimates could be reduced with the use of a sliding-window average. Thus, the corrected subnetwork score SA is . We took an SA > 3 as evidence of a biologically active subnetwork.
GO and Cell-Specific Expression of Candidate Genes
The reported biological significance of gene sets was evaluated by GO analysis (biological process FAT set) with the use of DAVID34 with the following parameters: similarity term overlap = 10, similarity threshold = 0.50, initial group membership = 5, final group membership = 3, multiple linkage threshold = 0.50, and EASE = 0.01. For pathways, we used the KEGG set and default parameters.
Cell-specific expression was assessed with the Gene Enrichment Profiler (see Web Resources).35 This tool computes the expression and enrichment of any set of query genes on the basis of a reference set obtained from 126 normal tissues and cell types (represented by 557 microarrays).
Additional analysis and plots were performed with the R statistical package.
Domain Knowledge Score
To prioritize unreported associations, we used a custom tool named domain knowledge score (DKS). DKS was programmed in R and works by performing sequential automated PubMed searches with each gene from a custom list and any combination of search terms. In this article, we combined each gene symbol of interest with the terms “multiple sclerosis,” “inflammation,” or “immunity.” In order to also capture older articles that might refer to outdated gene identifications, the tool also searches for all synonyms and aliases within a specific species. The score that each gene gets is simply the number of PubMed articles (excluding reviews) retrieved with the input search terms. The DKS tool is available upon request.
Results
Here, we describe a multianalytical approach to integrating two large genomic data sets in MS (Figure S1). Through this approach, we merge statistical evidence of association and physical evidence of interaction at the protein level to identify associated loci and highlight functional pathways involved in disease susceptibility.
Nominal Gene-Level Associations Cluster into Blocks
We utilized individual SNP-wise summary-level data from two largely independent GWASs in MS to compute gene-level p values with VEGAS.32 The first of these two studies comprised 9,772 cases and 17,376 controls and was recently published by the IMSGC and the WTCCC2.29 The second study was a meta-analysis encompassing all previous GWASs in MS and included a total of 5,545 cases and 12,153 controls.28 In order to maximize the chance that variants had a functional impact on the encoded protein, we selected the subset of 137,457 SNPs that were nonsynonymous and potentially deleterious (classified as either probably or possibly damaging by PolyPhen-2) or located in 5′ or 3′ UTRs, TFBSs, or histone binding sites. VEGAS computes gene-wise p values by taking into account relative genomic position, number of SNPs within a gene, and LD patterns for the appropriate ethnic background. It uses an adaptive simulation strategy to calculate an empirical gene-based p value for each annotated gene and defines p < 2.8 × 10⁻⁶ as Bonferroni significant. Because our main hypothesis states that even modestly associated genes might participate in biologically plausible pathways, we considered all genes with a VEGAS-determined p < 0.05. A Manhattan-plot visualization of both data sets at the gene level denotes the presence of association peaks, similar to those observed with SNP-level data (Figure 1). The distribution of nominally significant loci at the gene level largely replicated between the studies (see an example in the gray box in Figure 1) and closely matched the extended-LD patterns previously observed in regions of interest. Specifically, 665 association blocks containing 1,997 genes were identified for the WTCCC2 data set, and 612 blocks containing 1,707 genes were identified for the meta2.5 data set. Of these, 625 genes overlapped, representing a much higher-than-expected proportion (4.8-fold enrichment) compared to what would be expected by chance (χ2 test, p < 2.2 10−16). Notably, association blocks defined in this way—as a fixed genetic distance (0.25 cM) from the lead SNP and from there to the closest recombination hotspot from HapMap2—closely match the boundaries of the association regions for the 57 MS susceptibility loci recently reported by the IMSGC.29 The overlap between studies was still significant after exclusion of genes from the major histocompatibility complex and from blocks implicated by the 57 WTCCC2 loci and the two additional meta2.5 associated SNPs. In this filtered set, we found nominal association in 557 blocks (1,471 genes) from the WTCCC2 data set and in 530 blocks (1,298 genes) from meta2.5 (3.2-fold enrichment, Fisher’s exact p < 2.2 10−16); there was an overlap of 271 genes.
Figure 1.

Double Manhattan Plot
A Manhattan plot showing the gene-level p values of both GWASs used in this study. Gene-level p values from the WTCCC2 GWAS are displayed at the top, and those corresponding to the meta2.5 GWAS are at the bottom. Detailed block structure is shown in an enlarged region in chromosome 1. Blocks were defined as groups of contiguous genes with a p value ≤ 0.05 (grayed area). The individual p value of each gene is displayed as a colored circle ranging from green (not significant) to yellow to red (most significant). The two plots are largely specular, denoting overall replication (see main text).
PINBPA
We next sought to identify additional MS susceptibility loci by combining statistical evidence of gene association and physical evidence of interaction of their respective gene products by using a curated human PIN data set consisting of 8,960 proteins (nodes) and 27,724 interactions (edges) (see Subjects and Methods). All subsequent experiments were performed with Cytoscape, an open-source and extensible tool for network visualization and analysis.36 When we extracted the nodes with p values < 0.05, subnetworks of 838 nodes (401 edges) and 761 nodes (304 edges) were generated for the WTCCC2 and meta2.5 data sets, respectively (we refer to these as first-order networks). Given that neighboring genes have been shown to be functionally related and thus more likely to interact,18,37 we repeated this experiment while ensuring that only one gene per block was extracted from the main network. This resulted in first-order networks of 462 nodes (183 edges) for the WTCCC2 data set and 414 nodes (147 edges) for the meta2.5 data set. Both subnetworks were more connected than would be expected by chance, as demonstrated by a simulation experiment in which 1,000 networks of similar size were extracted from the same PIN at random (Figure 2). Of the other data sets used as controls, T1D, CD, and RA also produced highly connected subnetworks (Figure 2A). In each case, subnetworks were composed of a large connected component and several smaller networks or isolated nodes (singletons). When first-order networks were computed with the use of more significant p value thresholds, most diseases showed more connections than expected (Figure S2). We also tested whether the size of the main component was higher than what would be expected by chance (given the number of edges in the first-order network) and observed that less than 1% of random networks resulted in connected components larger than those obtained for the WTCCC2, meta2.5, and CD data sets. Approximately 10% of random networks resulted in connected components of the size of those generated by HT and RA (Figure 2B). Again, when first-order networks were computed with the use of more significant p value thresholds, most diseases showed larger connected components than expected (Figure S3). The higher-than-expected first-order interactions and size of the main connected component of these networks suggest a biologically plausible mechanism by which these gene sets coordinately affect cellular behavior.
Figure 2.
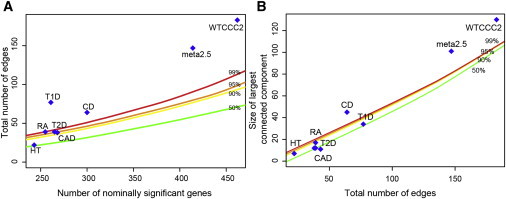
Connectedness of First-Order Interaction Networks
The number of connections among significant genes was evaluated in the background of 1,000 random simulations (see main text).
(A) The total number of edges was plotted as a function of the number of significant genes for each study.
(B) The size of the largest connected component is plotted as a function of the total number of edges. The colored lines represent the 50th (green), 90th (yellow), 95th (orange), and 99th (red) percentiles obtained through simulations with random gene sets of similar size.
Given the small-world topology of the human protein interactome, it is possible that a few highly connected nodes (hubs) bring together several associated genes, even though the hubs themselves are not associated, thus defining biologically associated modules. To explore this possibility, we conducted searches for subnetworks enriched with significant genes by using jActiveModules, a Cytoscape plugin based on a greedy heuristic algorithm with internal cross-validation.33 Fifteen significant and minimally overlapping modules of sizes 5–200 were identified for the WTCCC2 data set. Similarly, 16 significant and minimally overlapping modules of sizes 5–189 were identified for the meta2.5 data set (Table 1). We next computed the union of all modules within each data set, resulting in a single connected network of 464 nodes and 820 edges for the WTCCC2 data set and another of 605 nodes and 1,031 edges for the meta2.5 data set. Finally, we computed the intersection of these two networks, which yielded 118 nodes and 95 edges. Of these, 88 genes were arranged in 13 networks of sizes 2–27, whereas the remaining 30 genes remained as singletons (Figure 3). We concentrated on the 88 genes arranged in networks because these genes and the connections among them were independently identified in both MS studies, and as such, we hypothesized that these would have higher potential to include bona fide susceptibility loci. Of these 88 genes, 54 had nominally significant p values in both WTCCC2 and meta2.5 studies (v-shaped nodes in Figure 3), whereas the remaining 34 had significant p values in only one or neither study. These 54 genes are of highest importance to our approach because they had significant p values in both studies and because they were identified as components of significant networks in both studies as well. Notably, 30 of these genes either contain bona fide susceptibility variants (n = 13) or are located within bona fide associated regions (n = 17) (Table 1 and Figure 4), thus representing a specificity of 56% (Table S2 lists all blocks harboring genes with bona fide susceptibility variants and allows comparison of block structure between the WTCCC2 and meta2.5 data sets). Considering that only 34 of the 57 MS susceptibility loci identified to date are represented in the PIN, this approach was able to identify bona fide MS susceptibility loci with a sensitivity of 88%. Although an independent replication is warranted for firmly establishing whether the remaining 24 genes are indeed associated, the high recall observed with the network-based approach lends support to their involvement in MS susceptibility (Table S3 lists the complete block structure of each of these candidates in the WTCCC2 and meta2.5 studies).
Table 1.
Gene-Level Significance, Power, and Network Characteristics of Each GWAS
| Disease | MIM | Number of Nominally Significant Genes | Area under ROC Curve | Size of First-Order Interaction Net (Nodes–Edges) | Number of Subnetworks (Min–Max Size) | Size of Union Net (Nodes–Edges) | Sensitivity (%) | Specificity (%) |
|---|---|---|---|---|---|---|---|---|
| MS (WTCCC2) | 126200 | 1,996 | 0.95 | 838–401 | 15 (6–200) | 464–820 | 88 | 56 |
| MS (meta2.5) | 126200 | 1,706 | 0.88 | 761–304 | 16 (5–189) | 605–1,031 | - | - |
| T1D | 222100 | 1,056 | 0.65 | 474–161 | 13 (5–170) | 378–669 | 30 | 4.4 |
| T2D | 125853 | 913 | 0.71 | 405–74 | 8 (10–211) | 332–562 | 34 | 17.0 |
| RA | 180300 | 937 | 0.66 | 360–68 | 16 (6–207) | 347–632 | 12 | 1.7 |
| CD | 266600 | 997 | 0.72 | 469–116 | 15 (5–231) | 449–1,066 | 88 | 16.0 |
| CAD | 607339 | 831 | 0.60 | 393–75 | 15 (6–183) | 299–491 | 52 | 8.3 |
| HT | 145500 | 813 | 0.64 | 349–40 | 13 (6–167) | 355–500 | 38 | 2.6 |
Abbreviations are as follows: ROC, receiver operating characteristic; Min, minimum; Max, maximum; MS, multiple sclerosis; T1D, type 1 diabetes; T2D, type 2 diabetes; RA, rheumatoid arthritis; CD, Crohn disease; CAD, coronary artery disease; and HT, hypertension.
Figure 3.

Intersection Network
Of the 118 nodes obtained by the intersection of the resulting networks from each independent study, 88 were arranged in 13 subnetworks (ranging in size from 2 to 27) and 30 nodes remained isolated. Each node represents a gene product, and each edge represents an experimental physical interaction reported in at least two independent publications. Thus, an edge is only displayed if the same interactions were identified in both studies. Isolated nodes in this representation might still have had interactions within each of the studies, but they were not preserved in both. White nodes are not significant. A color scale (yellow to red) denotes the significance of each node in the WTCCC2 study. V-shaped nodes have nominally significant p values in both studies. Nodes with a yellow outline denote genes containing bona fide MS susceptibility variants. Each of the six subnetworks with size ≥ 3 is highlighted by a different background color (subnetworks of size = 2 were grouped under the same background).
Figure 4.

Proportion of Validated Discoveries with a Network versus a Nonnetwork Approach
Of the 118 genes in the intersection network, 88 genes were arranged in 13 subnetworks of sizes 2–27. Of those, 54 genes were nominally significant in both studies. Fifty-five percent of these genes either were bona fide MS-associated genes (24%) or fell into bona fide MS blocks (31%). Of the 30 singletons from the 118-gene intersection network, 26 had significant p values in both studies. Forty-six percent of these either were bona fide MS-associated genes (11%) or fell into bona fide MS blocks (35%). From the 154 genes with significant p values but not found in networks, only 25% either were bona fide MS-associated genes (8%) or fell into bona fide MS blocks (17%).
When we explored the 30 singleton genes in the intersection network, we found that 26 of them had nominally significant p values in both studies (Table 2, bold entries). Although these genes ended up as singletons in the intersection network, each of them was part of a connected network in either the WTCCC2 or the meta2.5 individual study. Therefore, we also evaluated to what extent these genes (significant in both studies but participating in networks in only one of them) include bona fide MS susceptibility loci. Of these 26 genes, 12 either contain bona fide susceptibility variants (n = 3) or are located within bona fide associated regions (n = 9), representing a specificity of 46% and a sensitivity of 35% (Table 1 and Figure 4).
Table 2.
Nominally Significant Genes in the WTCCC2 and meta2.5 Studies
|
Bona Fide MS Susceptibility Loci |
Candidate Loci |
|||||||
|---|---|---|---|---|---|---|---|---|
|
Gene |
Block |
Gene Symbol | p Value (WTCCC2) | p Value (meta2.5) | ||||
| Gene Symbol | p Value (WTCCC2) | p Value (meta2.5) | Gene Symbol | p Value (WTCCC2) | p Value (meta2.5) | |||
| CD58 | 2 × 10⁻⁵ | 1 × 10⁻⁶ | TNFRSF14 | 1 × 10⁻⁷ | 0.00055 | PHGDH | 0.0008 | 0.00012 |
| MERTK | 0.0026 | 0.01698 | S1PR1a | 0.0261 | 0.00992 | ETS1 | 0.0122 | 0.02008 |
| IL12A | 3 × 10⁻⁵ | 0.00066 | GOLGB1 | 1 × 10⁻⁷ | 0.00197 | TRAF3 | 0.0013 | 0.00113 |
| IL7R | 0.0005 | 0.00137 | KIF5A | 0.0002 | 0.00337 | BCL10 | 2 × 10⁻⁵ | 0.00054 |
| IL12B | 4 × 10⁻⁶ | 1 × 10⁻⁷ | CIITA | 1 × 10⁻⁷ | 0.0129 | CD48 | 9 × 10⁻⁶ | 0.00902 |
| IL7 | 3 × 10⁻⁵ | 0.00339 | SOCS1 | 1 × 10⁻⁷ | 2 × 10⁻⁶ | REL | 0.0003 | 0.00047 |
| IL2RA | 0.0015 | 0.00063 | RBM17 | 1 × 10⁻⁵ | 0.00271 | C17orf57 | 0.0117 | 0.00259 |
| TNFRSF1A | 1 × 10⁻⁷ | 0.00019 | SCNN1A | 2 × 10⁻⁶ | 0.00017 | KPNB1 | 0.0002 | 1 × 10⁻⁷ |
| STAT3 | 0.0001 | 0.00004 | LTBR | 2 × 10⁻⁶ | 0.00061 | CHERP | 0.0018 | 1.6 × 10⁻⁵ |
| MALT1 | 0.0002 | 0.00068 | CD27 | 0.0003 | 0.0125 | TEC | 0.0007 | 0.00048 |
| CD40 | 0.0002 | 0.02198 | VAMP1 | 0.0003 | 0.01662 | CSF2 | 0.0112 | 0.00755 |
| MAPK1 | 5 × 10⁻⁵ | 0.00063 | STAT5A | 0.0002 | 1.8 × 10⁻⁵ | IRF1 | 0.0036 | 0.01076 |
| SCO2 | 1 × 10⁻⁵ | 0.00315 | STAT5B | 0.0349 | 0.00099 | EIF3B | 5 × 10⁻⁵ | 0.03787 |
| VCAM1 | 0.0008 | 0.00917 | CLTC | 0.0066 | 0.00088 | JAK2 | 0.01 | 0.01543 |
| RGS1 | 5 × 10⁻⁶ | 0.00076 | KEAP1b | 0.0019 | 0.03798 | PAX5 | 0.0232 | 0.04573 |
| TNFSF14 | 0.0002 | 0.00452 | PFDN4 | 0.0001 | 0.01813 | RIC8A | 0.0061 | 0.02786 |
| - | - | - | TOP3B | 0.0006 | 0.00695 | NR1H3 | 0.0007 | 0.00472 |
| - | - | - | BCL2L11 | 0.0005 | 0.00101 | SART1 | 0.0001 | 0.00115 |
| - | - | - | HCLS1 | 0.0035 | 0.0157 | VPS33A | 0.0091 | 0.00124 |
| - | - | - | CDK4 | 1 × 10⁻⁶ | 1.1 × 10⁻⁵ | MARK3 | 0.0066 | 9.6 × 10⁻⁵ |
| - | - | - | PITPNM2 | 0.0002 | 0.00133 | FBF1 | 0.0232 | 0.00657 |
| - | - | - | OGFOD2 | 0.0006 | 0.0032 | PIK3R2 | 1 × 10⁻⁷ | 0.01093 |
| - | - | - | C3 | 0.0003 | 0.02719 | PITPNB | 0.0059 | 0.01738 |
| - | - | - | PDE4A | 1 × 10⁻⁷ | 0.0048 | BBC3 | 0.0006 | 0.01007 |
| - | - | - | RTEL1 | 4 × 10⁻⁵ | 0.00665 | SLAMF1 | 0.008 | 0.0497 |
| - | - | - | PPM1F | 0.0006 | 0.00458 | MORF4L1 | 0.0105 | 0.0022 |
| - | - | - | - | - | - | MED26 | 0.001 | 0.0002 |
| - | - | - | - | - | - | TXK | 0.0002 | 0.00039 |
| - | - | - | - | - | - | IKZF1 | 0.0068 | 0.04215 |
| - | - | - | - | - | - | BMI1 | 0.01 | 0.0102 |
| - | - | - | - | - | - | PSMD13 | 0.0054 | 0.02084 |
| - | - | - | - | - | - | FOSL1 | 0.007 | 0.02244 |
| - | - | - | - | - | - | CLIP1 | 0.005 | 4.6 × 10⁻⁵ |
| - | - | - | - | - | - | ITGAX | 0.0025 | 0.01925 |
| - | - | - | - | - | - | JUP | 0.0306 | 0.01387 |
| - | - | - | - | - | - | DNAJC7 | 0.0069 | 0.01956 |
| - | - | - | - | - | - | RAB3A | 1 × 10⁻⁵ | 0.01381 |
All genes were arranged in networks in at least one of the two studies. Genes in bold are those with significant p values in both studies but arranged as singletons in the intersection network from Figure 3.
This gene is significant but falls in a contiguous block.
This gene is significant, but the block in meta2.5 is smaller than that in the WTCCC2 study.
As a control, we also evaluated the recall potential of the 154 genes that had nominally significant p values in both studies but that were not found in networks. Only 13 of them (8%) were bona fide MS-associated genes, and 26 (17%) were located within bona fide MS blocks. The remaining 115 (75%) remained potential (nonvalidated) associations (Figure 4). These findings represent a sensitivity of 68% and a specificity of 25%.
All together, these results suggest that even nominally significant genes, if replicated in more than one study, represent a select list of candidates for further analysis. However, in the absence of any additional evidence, the chances of discovering genuine associations among these genes are still hampered by a significant proportion of false positives. These probabilities are significantly increased when one considers those genes that, in addition to showing (nominally) significant associations, participate in interaction networks in at least one study. The best results, nonetheless, were obtained when nominally significant genes were also identified as part of the same interaction network in both studies.
The analysis of other WTCCC1 diseases used as controls also supports this interpretation. In those data sets, the average sensitivity was 42.3% and the average specificity was 8.3%. Notably, CD yielded a sensitivity of 88% (the same obtained for MS), albeit with a much more modest specificity of 16% (compared with 56% for MS). The main factors contributing to the significantly better performance of the MS data sets were most likely their size and the availability of a replication data set.
Biological Significance of Associated and Candidate Genes in MS
To explore the biological significance of the genes with either confirmed or suspected roles in MS susceptibility (described in Table 2), we conducted a GO and pathway analysis by using DAVID. Among the 79 genes in these lists, GO analysis (biological process) identified three main categories as significantly enriched: leukocyte activation (enrichment score = 9; lead category false-discovery rate [FDR]-corrected p value = 1.3 × 10⁻⁸), apoptosis (enrichment score = 6.16; lead category FDR-corrected p value = 2.2 × 10⁻⁶), and positive regulation of macromolecule metabolic process (enrichment score = 5.86; lead category FDR-corrected p value = 4.7 × 10⁻⁸). When KEGG pathways were evaluated, the JAK-STAT signaling pathway (enrichment score = 3.47; lead category FDR-corrected p value = 1.4 × 10⁻⁵), acute myeloid leukemia (enrichment score = 2.22; lead category FDR-corrected p value = 5.9 × 10⁻³), and T cell receptor signaling (enrichment score = 1.63; lead category FDR-corrected p value = 0.01) were significantly enriched.
We also computed the tissue specificity of these genes by using the Gene Enrichment Profiler (see Subjects and Methods). Approximately two-thirds of these genes were highly expressed in immune-related cell types, and about half were highly expressed in the CNS (Figure S4, red or black color). However, enrichment maps overwhelmingly highlighted immune-related cell types (Figure S5). Given that only three genes (PDE4A [MIM 600126], RAB3A [MIM 179490], and VAMP1 [MIM 185880]) appeared to be specifically enriched in the CNS, we were unable to confirm our earlier observation that neural pathways were involved in MS susceptibility.12
Finally, we used a combination of gene-level statistical significance and text mining (DKS, see Subjects and Methods) to highlight some of the candidate associations emerging from the analysis (Table 2). On the basis of stringent criteria (p < 0.01 in both studies and DKS > 50), five genes were identified as the most plausible candidates: B cell lymphoma 10 (BCL10 [MIM 603517]) (DKS = 62), CD48 [MIM 109530] (also known as B cell membrane protein) (DKS = 83), v-rel reticuloendotheliosis viral oncogene homolog (REL [MIM 164910]) (DKS = 630), TNF-receptor-associated factor 3 (TRAF3 [MIM 601896]) (DKS = 60), and TEC protein tyrosine kinase (TEC [MIM 600583]) (DKS = 230). Although it is not possible to unequivocally implicate any of these candidates in MS susceptibility, in the absence of experimental functional data, the combined strategy described here provides a more comprehensive interpretation of these associations.
Discussion
One plausible cause of the manifestation of complex diseases is the genetic alteration in the function of specific biological pathways through the presence of multiple variants in different genes (each of which contributes a modest amount to disease predisposition) and the ultimate disruptions in normal biological processes. We found that even nominally associated genes (i.e., gene-level data) were not scattered randomly across the genome but were rather agglomerated into clusters or blocks of association in a similar fashion to that seen in regional association plots of SNP-level data. In fact, the gene-wise association blocks defined in this study and the critical regions defined in the original WTCCC2 publication are remarkably similar (see Table S2). It is noteworthy that any other gene-wise p value threshold would have resulted in a different arrangement of genes into blocks, most likely smaller and fewer. Thus, the close agreement in association-block structure and size supports our choice of the nominal p value as a threshold for the remainder of the study. Furthermore, this finding has important implications, given that it indicates that our strategy of selecting potentially functional SNPs and nominally significant genes produces comparable results to the more established approach utilized in our previous study of extending a fixed genetic distance from the lead SNP and from there to the next recombination hotspot.29 This also suggests that in most regions, the patterns of extended LD would determine the upper limit of resolution of this approach, except in cases in which a variant with obvious functional consequence is identified within these regions.
We have demonstrated that proteins encoded by truly associated genes are more likely to be connected in the PIN. By extension, we hypothesized that significant subnetworks (enriched with nominally significant genes) would contain genes that are more likely to be genuinely associated. Assuming that 107 common single-nucleotide variants exist in the human genome and that 100 of them are truly associated with MS, the prior probability of finding an association by chance is 100,000 to 1 (10−5). Theoretical calculations have suggested that the statistical-significance cutoff required to yield an association that is more likely true than false is directly related to its sample size (power).38 For example, under these assumptions, a p value of 10−6 is predicted to identify an association that is ten times more likely to be true than false for a study of 10,000 cases and 10,000 controls but equally likely to be true or false if the size of the study is 2,000 cases and 2,000 controls. For a study with 1,000 cases and 1,000 controls, that same p value threshold will identify associations that are ten times more likely to be false than true. These theoretical estimates have also shown that if the prior probability of an association is increased, for example, by two orders of magnitude (from 10−5 to 10−3), the p value threshold generating the same level of confidence in a result can be reduced by roughly the same magnitude (from 10−6 to 10−4). It follows that increasing the prior probability is a meaningful way to increase the power of detecting bona fide associations in a study of a given size. Several ways to increase the prior probability of an association exist. In this study, we aimed at increasing the prior odds by using a three-way strategy. First, we conducted our analysis by only using functional or potentially functional SNPs. Because nonsynonymous coding variants and variants in regulatory regions or splice sites are more likely to have a functional effect than are variants in silent noncoding regions, concentrating analysis on these more functional relevant variants is a reasonable strategy to improve the prior odds.39 Second, we computed gene-wise p values, thus significantly reducing the number of possible tests by ∼8-fold (from 137,457 to 17,787). Third, we prioritized candidates that were arranged in interaction networks, which as shown above, increases the likelihood of finding true associations.
Altogether, this strategy (similar in concept to the genomic convergence paradigm previously described40) is likely to increase the priors, although it is not possible to determine exactly by which magnitude. The fact that recall power of the two MS data sets was large (area under the curve of 0.95 and 0.88) further encouraged us to evaluate genes with even modest statistical evidence of association. Therefore, we took a liberal approach and considered every gene-level association with a nominal p value of 0.05. In support of this strategy, we found that the overlap of nominally significant genes between the WTCCC2 (n = 1,997) and meta2.5 (n = 1,707) studies was 625, a 6-fold increase of what would be expected by chance (Fisher’s exact p value < 10−16).
An important finding of this study is that proteins encoded by nominally associated genes are more connected in the PIN than what would be expected by chance. This provides further evidence that in well-powered studies, the three-way strategy followed here (selecting potentially functional SNPs, analyzing nominal gene-level significance, and studying genes in the context of biological networks) maximizes the potential of finding bona fide associations. Furthermore, this approach might highlight the importance of a different gene than the one originally selected within a GWAS associated block. For example, a nonsynonymous SNP (rs3748816) in membrane metalloendopeptidase-like 1 (MMEL1) was originally identified as a susceptibility gene though a screen of candidate genes showing a p value of 3.54 × 10⁻⁶ (odds ratio = 1.16) in 3,444 affected indviduals and 2,595 controls.41 This association was further replicated by the WTCCC2 GWAS with a p value of 2.25 × 10⁻¹³. Its p value in meta2.5 was 2.81 × 10⁻⁵. However, given the extensive LD in this region, it is not possible to exclude the possibility that other genes within this block are instead associated with MS. In addition to MMEL1, genes in this association block include PLCH2 (MIM 612836), PANK4 (MIM 606162), HES5 (MIM 607348), TNFRSF14 (MIM 602746), and C1orf93. In the present study, this region was also identified with a block p value of 10−7 (genome-wide significant) in the WTCCC2 data set and 1.49 × 10⁻⁴ in the meta2.5 data set (Table S2). However, the only protein encoded by a gene that appeared in the final intersection network in this block was TNFRSF14, which had direct interactions with TRAF2 (not significant) and TRAF3 (p values of 1.3 × 10⁻³ and 1.13 × 10⁻³ in the WTCCC2 and meta2.5 data sets, respectively) (Figure 4). Furthermore, TNFRSF14 is a ligand of TNFSF14, encoded by one of the 57 susceptibility loci identified by the WTCCC2 GWAS. Interestingly, although physically within MMEL1, rs3748816 was mapped to TNFRSF14 by VEGAS in the WTCCC2 study and to both genes in the meta2.5 study, most likely as a result of its high LD. All together, and in the absence of additional functional experimental data, these results provide more evidence to implicate variants in TNFRSF14 than to implicate MMEL1 as an MS susceptibility locus. Ultimately, however, experimental evidence will be needed for determining this with precision.
Another example is the association block containing VCAM1 (MIM 192225), EXTL2 (MIM 602411), SLC30A7 (MIM 611149), DPH5 (MIM 611075), and S1PR1 (sphingosine-1-phosphate receptor 1 [MIM 601974]). Although VCAM1 has been selected as the most likely associated gene from this block (presumably because of its function in cell adhesion), the WTCCC2 regional association plot shows that this gene falls slightly outside the block, and the most significant functional SNP maps to SLC30A7. In this study, however, the block extends to include VCAM1 and S1PR1. Furthermore, the only gene that is significant in both the WTCCC2 and the meta2.5 studies and shows in the final intersection network is S1PR1 (Figure 4). This is of relevance because S1PR1 is the target of the disease-modifying therapy Fingolimod. Again, further experimental approaches are warranted for determining which are the functionally relevant associations in each of these loci.
We acknowledge that the lack of an independent replication is a limitation when new associations are predicted. However, the successful identification of several bona fide genes containing susceptibility variants, the prioritization of different genes within a known association block, and the proposal of candidate associations are valuable outcomes only achieved by the integration of different sources of evidence. Results from this approach contribute to firmly establish that genes and pathways involved in the immune response are the major drivers of MS risk.
Acknowledgments
We thank the research subjects, their families, and the healthy control individuals who participated in this study. S.E.B. and P.D.J. are Harry Weaver Neuroscience Scholars from the US National Multiple Sclerosis Society. B.D. is a clinical investigator of the Research Foundation Flanders (FWO-Vlaanderen), and A.G. and B.D. are supported by the Research Fund KU Leuven (OT/11/087).
Footnotes
A full list of Wellcome Trust Case Control Consortium 2 members can be found in the Supplemental Data
Contributor Information
International Multiple Sclerosis Genetics Consortiumsergio.baranzini@ucsf.edu:
Sergio E. Baranzini, Pouya Khankhanian, Nikolaos A. Patsopoulos, Michael Li, Jim Stankovich, Chris Cotsapas, Helle Bach Søndergaard, Maria Ban, Nadia Barizzone, Laura Bergamaschi, David Booth, Dorothea Buck, Paola Cavalla, Elisabeth G. Celius, Manuel Comabella, Giancarlo Comi, Alastair Compston, Isabelle Cournu-Rebeix, Sandra D’alfonso, Vincent Damotte, Lennox Din, Bénédicte Dubois, Irina Elovaara, Federica Esposito, Bertrand Fontaine, Andre Franke, An Goris, Pierre-Antoine Gourraud, Christiane Graetz, Franca R. Guerini, Léna Guillot-Noel, David Hafler, Hakon Hakonarson, Per Hall, Anders Hamsten, Hanne F. Harbo, Bernhard Hemmer, Jan Hillert, Anu Kemppinen, Ingrid Kockum, Keijo Koivisto, Malin Larsson, Mark Lathrop, Maurizio Leone, Christina M. Lill, Fabio Macciardi, Roland Martin, Vittorio Martinelli, Filippo Martinelli-Boneschi, Jacob L. McCauley, Kjell-Morten Myhr, Paola Naldi, Tomas Olsson, Annette Oturai, Margaret A. Pericak-Vance, Franco Perla, Mauri Reunanen, Janna Saarela, Safa Saker-Delye, Marco Salvetti, Finn Sellebjerg, Per Soelberg Sørensen, Anne Spurkland, Graeme Stewart, Bruce Taylor, Pentti Tienari, Juliane Winkelmann, Frauke Zipp, Adrian J. Ivinson, Jonathan L. Haines, Stephen Sawcer, Philip DeJager, Stephen L. Hauser, and Jorge R. Oksenberg
Supplemental Data
Web Resources
The URLs for data presented herein are as follows:
Gene Enrichment Profiler, http://xavierlab2.mgh.harvard.edu/EnrichmentProfiler/
Online Mendelian Inheritance in Man (OMIM), http://www.omim.org
International Multiple Sclerosis Genetics Consortium
Sergio E. Baranzini, Pouya Khankhanian, Nikolaos A. Patsopoulos, Michael Li, Jim Stankovich, Chris Cotsapas, Helle Bach Søndergaard, Maria Ban, Nadia Barizzone, Laura Bergamaschi, David Booth, Dorothea Buck, Paola Cavalla, Elisabeth G. Celius, Manuel Comabella, Giancarlo Comi, Alastair Compston, Isabelle Cournu-Rebeix, Sandra D’alfonso, Vincent Damotte, Lennox Din, Bénédicte Dubois, Irina Elovaara, Federica Esposito, Bertrand Fontaine, Andre Franke, An Goris, Pierre-Antoine Gourraud, Christiane Graetz, Franca R. Guerini, Léna Guillot-Noel, David Hafler, Hakon Hakonarson, Per Hall, Anders Hamsten, Hanne F. Harbo, Bernhard Hemmer, Jan Hillert, Anu Kemppinen, Ingrid Kockum, Keijo Koivisto, Malin Larsson, Mark Lathrop, Maurizio Leone, Christina M. Lill, Fabio Macciardi, Roland Martin, Vittorio Martinelli, Filippo Martinelli-Boneschi, Jacob L. McCauley, Kjell-Morten Myhr, Paola Naldi, Tomas Olsson, Annette Oturai, Margaret A. Pericak-Vance, Franco Perla, Mauri Reunanen, Janna Saarela, Safa Saker-Delye, Marco Salvetti, Finn Sellebjerg, Per Soelberg Sørensen, Anne Spurkland, Graeme Stewart, Bruce Taylor, Pentti Tienari, Juliane Winkelmann, Wellcome Trust Case Control Consortium 2,1 Frauke Zipp, Adrian J. Ivinson, Jonathan L. Haines, Stephen Sawcer, Philip DeJager, Stephen L. Hauser, and Jorge R. Oksenberg
References
- 1.Hindorff L.A., Sethupathy P., Junkins H.A., Ramos E.M., Mehta J.P., Collins F.S., Manolio T.A. Potential etiologic and functional implications of genome-wide association loci for human diseases and traits. Proc. Natl. Acad. Sci. USA. 2009;106:9362–9367. doi: 10.1073/pnas.0903103106. [DOI] [PMC free article] [PubMed] [Google Scholar]
- 2.Bodmer W., Bonilla C. Common and rare variants in multifactorial susceptibility to common diseases. Nat. Genet. 2008;40:695–701. doi: 10.1038/ng.f.136. [DOI] [PMC free article] [PubMed] [Google Scholar]
- 3.Eberle M.A., Ng P.C., Kuhn K., Zhou L., Peiffer D.A., Galver L., Viaud-Martinez K.A., Lawley C.T., Gunderson K.L., Shen R., Murray S.S. Power to detect risk alleles using genome-wide tag SNP panels. PLoS Genet. 2007;3:1827–1837. doi: 10.1371/journal.pgen.0030170. [DOI] [PMC free article] [PubMed] [Google Scholar]
- 4.Purcell S.M., Wray N.R., Stone J.L., Visscher P.M., O’Donovan M.C., Sullivan P.F., Sklar P., International Schizophrenia Consortium Common polygenic variation contributes to risk of schizophrenia and bipolar disorder. Nature. 2009;460:748–752. doi: 10.1038/nature08185. [DOI] [PMC free article] [PubMed] [Google Scholar]
- 5.Bush W.S., Sawcer S.J., de Jager P.L., Oksenberg J.R., McCauley J.L., Pericak-Vance M.A., Haines J.L., International Multiple Sclerosis Genetics Consortium (IMSGC) Evidence for polygenic susceptibility to multiple sclerosis—the shape of things to come. Am. J. Hum. Genet. 2010;86:621–625. doi: 10.1016/j.ajhg.2010.02.027. [DOI] [PMC free article] [PubMed] [Google Scholar]
- 6.Torkamani A., Topol E.J., Schork N.J. Pathway analysis of seven common diseases assessed by genome-wide association. Genomics. 2008;92:265–272. doi: 10.1016/j.ygeno.2008.07.011. [DOI] [PMC free article] [PubMed] [Google Scholar]
- 7.Wang L., Jia P., Wolfinger R.D., Chen X., Zhao Z. Gene set analysis of genome-wide association studies: methodological issues and perspectives. Genomics. 2011;98:1–8. doi: 10.1016/j.ygeno.2011.04.006. [DOI] [PMC free article] [PubMed] [Google Scholar]
- 8.Wang K., Li M., Bucan M. Pathway-based approaches for analysis of genomewide association studies. Am. J. Hum. Genet. 2007;81:1278–1283. doi: 10.1086/522374. [DOI] [PMC free article] [PubMed] [Google Scholar]
- 9.Holmans P., Green E.K., Pahwa J.S., Ferreira M.A., Purcell S.M., Sklar P., Owen M.J., O’Donovan M.C., Craddock N., Wellcome Trust Case-Control Consortium Gene ontology analysis of GWA study data sets provides insights into the biology of bipolar disorder. Am. J. Hum. Genet. 2009;85:13–24. doi: 10.1016/j.ajhg.2009.05.011. [DOI] [PMC free article] [PubMed] [Google Scholar]
- 10.Chen L.S., Hutter C.M., Potter J.D., Liu Y., Prentice R.L., Peters U., Hsu L. Insights into colon cancer etiology via a regularized approach to gene set analysis of GWAS data. Am. J. Hum. Genet. 2010;86:860–871. doi: 10.1016/j.ajhg.2010.04.014. [DOI] [PMC free article] [PubMed] [Google Scholar]
- 11.Lee I., Blom U.M., Wang P.I., Shim J.E., Marcotte E.M. Prioritizing candidate disease genes by network-based boosting of genome-wide association data. Genome Res. 2011;21:1109–1121. doi: 10.1101/gr.118992.110. [DOI] [PMC free article] [PubMed] [Google Scholar]
- 12.Baranzini S.E., Galwey N.W., Wang J., Khankhanian P., Lindberg R., Pelletier D., Wu W., Uitdehaag B.M., Kappos L., Polman C.H., GeneMSA Consortium Pathway and network-based analysis of genome-wide association studies in multiple sclerosis. Hum. Mol. Genet. 2009;18:2078–2090. doi: 10.1093/hmg/ddp120. [DOI] [PMC free article] [PubMed] [Google Scholar]
- 13.Jia P., Zhao Z. Searching joint association signals in CATIE schizophrenia genome-wide association studies through a refined integrative network approach. BMC Genomics. 2012;13(Suppl 6):S15. doi: 10.1186/1471-2164-13-S6-S15. [DOI] [PMC free article] [PubMed] [Google Scholar]
- 14.Fernández R.M., Bleda M., Núñez-Torres R., Medina I., Luzón-Toro B., García-Alonso L., Torroglosa A., Marbà M., Enguix-Riego M.V., Montaner D. Four new loci associations discovered by pathway-based and network analyses of the genome-wide variability profile of Hirschsprung’s disease. Orphanet J. Rare Dis. 2012;7:103. doi: 10.1186/1750-1172-7-103. [DOI] [PMC free article] [PubMed] [Google Scholar]
- 15.Lee Y.H., Bae S.C., Choi S.J., Ji J.D., Song G.G. Genome-wide pathway analysis of genome-wide association studies on systemic lupus erythematosus and rheumatoid arthritis. Mol. Biol. Rep. 2012;39:10627–10635. doi: 10.1007/s11033-012-1952-x. [DOI] [PubMed] [Google Scholar]
- 16.Jensen M.K., Pers T.H., Dworzynski P., Girman C.J., Brunak S., Rimm E.B. Protein interaction-based genome-wide analysis of incident coronary heart disease. Circ. Cardiovasc. Genet. 2011;4:549–556. doi: 10.1161/CIRCGENETICS.111.960393. [DOI] [PMC free article] [PubMed] [Google Scholar]
- 17.Jia P., Zheng S., Long J., Zheng W., Zhao Z. dmGWAS: dense module searching for genome-wide association studies in protein-protein interaction networks. Bioinformatics. 2011;27:95–102. doi: 10.1093/bioinformatics/btq615. [DOI] [PMC free article] [PubMed] [Google Scholar]
- 18.Rossin E.J., Lage K., Raychaudhuri S., Xavier R.J., Tatar D., Benita Y., Cotsapas C., Daly M.J., International Inflammatory Bowel Disease Genetics Constortium Proteins encoded in genomic regions associated with immune-mediated disease physically interact and suggest underlying biology. PLoS Genet. 2011;7:e1001273. doi: 10.1371/journal.pgen.1001273. [DOI] [PMC free article] [PubMed] [Google Scholar]
- 19.Compston A. Churchill Livingstone Elsevier; Philadelphia: 2005. McAlpine’s multiple sclerosis. [Google Scholar]
- 20.Hauser S.L., Goodin D.S. Multiple Sclerosis and other demyelinating diseases. In: Longo D.I., editor. Harrison’s principles of internal medicine. McGraw-Hill; New York: 2012. pp. 3395–3409. [Google Scholar]
- 21.Hafler D.A., Compston A., Sawcer S., Lander E.S., Daly M.J., De Jager P.L., de Bakker P.I., Gabriel S.B., Mirel D.B., Ivinson A.J., International Multiple Sclerosis Genetics Consortium Risk alleles for multiple sclerosis identified by a genomewide study. N. Engl. J. Med. 2007;357:851–862. doi: 10.1056/NEJMoa073493. [DOI] [PubMed] [Google Scholar]
- 22.Baranzini S.E., Wang J., Gibson R.A., Galwey N., Naegelin Y., Barkhof F., Radue E.W., Lindberg R.L., Uitdehaag B.M., Johnson M.R. Genome-wide association analysis of susceptibility and clinical phenotype in multiple sclerosis. Hum. Mol. Genet. 2009;18:767–778. doi: 10.1093/hmg/ddn388. [DOI] [PMC free article] [PubMed] [Google Scholar]
- 23.Australia and New Zealand Multiple Sclerosis Genetics Consortium (ANZgene) Genome-wide association study identifies new multiple sclerosis susceptibility loci on chromosomes 12 and 20. Nat. Genet. 2009;41:824–828. doi: 10.1038/ng.396. [DOI] [PubMed] [Google Scholar]
- 24.Jakkula E., Leppä V., Sulonen A.M., Varilo T., Kallio S., Kemppinen A., Purcell S., Koivisto K., Tienari P., Sumelahti M.L. Genome-wide association study in a high-risk isolate for multiple sclerosis reveals associated variants in STAT3 gene. Am. J. Hum. Genet. 2010;86:285–291. doi: 10.1016/j.ajhg.2010.01.017. [DOI] [PMC free article] [PubMed] [Google Scholar]
- 25.Sanna S., Pitzalis M., Zoledziewska M., Zara I., Sidore C., Murru R., Whalen M.B., Busonero F., Maschio A., Costa G. Variants within the immunoregulatory CBLB gene are associated with multiple sclerosis. Nat. Genet. 2010;42:495–497. doi: 10.1038/ng.584. [DOI] [PMC free article] [PubMed] [Google Scholar]
- 26.Nischwitz S., Cepok S., Kroner A., Wolf C., Knop M., Müller-Sarnowski F., Pfister H., Roeske D., Rieckmann P., Hemmer B. Evidence for VAV2 and ZNF433 as susceptibility genes for multiple sclerosis. J. Neuroimmunol. 2010;227:162–166. doi: 10.1016/j.jneuroim.2010.06.003. [DOI] [PubMed] [Google Scholar]
- 27.Comabella M., Craig D.W., Camiña-Tato M., Morcillo C., Lopez C., Navarro A., Rio J., Montalban X., Martin R., BiomarkerMS Study Group Identification of a novel risk locus for multiple sclerosis at 13q31.3 by a pooled genome-wide scan of 500,000 single nucleotide polymorphisms. PLoS ONE. 2008;3:e3490. doi: 10.1371/journal.pone.0003490. [DOI] [PMC free article] [PubMed] [Google Scholar]
- 28.Patsopoulos N.A., Esposito F., Reischl J., Lehr S., Bauer D., Heubach J., Sandbrink R., Pohl C., Edan G., Kappos L., Bayer Pharma MS Genetics Working Group. Steering Committees of Studies Evaluating IFNβ-1b and a CCR1-Antagonist. ANZgene Consortium. GeneMSA. International Multiple Sclerosis Genetics Consortium Genome-wide meta-analysis identifies novel multiple sclerosis susceptibility loci. Ann. Neurol. 2011;70:897–912. doi: 10.1002/ana.22609. [DOI] [PMC free article] [PubMed] [Google Scholar]
- 29.Sawcer S., Hellenthal G., Pirinen M., Spencer C.C., Patsopoulos N.A., Moutsianas L., Dilthey A., Su Z., Freeman C., Hunt S.E., International Multiple Sclerosis Genetics Consortium. Wellcome Trust Case Control Consortium 2 Genetic risk and a primary role for cell-mediated immune mechanisms in multiple sclerosis. Nature. 2011;476:214–219. doi: 10.1038/nature10251. [DOI] [PMC free article] [PubMed] [Google Scholar]
- 30.Wellcome Trust Case Control Consortium Genome-wide association study of 14,000 cases of seven common diseases and 3,000 shared controls. Nature. 2007;447:661–678. doi: 10.1038/nature05911. [DOI] [PMC free article] [PubMed] [Google Scholar]
- 31.Adzhubei I.A., Schmidt S., Peshkin L., Ramensky V.E., Gerasimova A., Bork P., Kondrashov A.S., Sunyaev S.R. A method and server for predicting damaging missense mutations. Nat. Methods. 2010;7:248–249. doi: 10.1038/nmeth0410-248. [DOI] [PMC free article] [PubMed] [Google Scholar]
- 32.Liu J.Z., McRae A.F., Nyholt D.R., Medland S.E., Wray N.R., Brown K.M., Hayward N.K., Montgomery G.W., Visscher P.M., Martin N.G., Macgregor S., AMFS Investigators A versatile gene-based test for genome-wide association studies. Am. J. Hum. Genet. 2010;87:139–145. doi: 10.1016/j.ajhg.2010.06.009. [DOI] [PMC free article] [PubMed] [Google Scholar]
- 33.Ideker T., Ozier O., Schwikowski B., Siegel A.F. Discovering regulatory and signalling circuits in molecular interaction networks. Bioinformatics. 2002;18(Suppl 1):S233–S240. doi: 10.1093/bioinformatics/18.suppl_1.s233. [DOI] [PubMed] [Google Scholar]
- 34.Dennis G., Jr., Sherman B.T., Hosack D.A., Yang J., Gao W., Lane H.C., Lempicki R.A. DAVID: Database for Annotation, Visualization, and Integrated Discovery. Genome Biol. 2003;4:3. [PubMed] [Google Scholar]
- 35.Benita Y., Cao Z., Giallourakis C., Li C., Gardet A., Xavier R.J. Gene enrichment profiles reveal T-cell development, differentiation, and lineage-specific transcription factors including ZBTB25 as a novel NF-AT repressor. Blood. 2010;115:5376–5384. doi: 10.1182/blood-2010-01-263855. [DOI] [PMC free article] [PubMed] [Google Scholar]
- 36.Shannon P., Markiel A., Ozier O., Baliga N.S., Wang J.T., Ramage D., Amin N., Schwikowski B., Ideker T. Cytoscape: a software environment for integrated models of biomolecular interaction networks. Genome Res. 2003;13:2498–2504. doi: 10.1101/gr.1239303. [DOI] [PMC free article] [PubMed] [Google Scholar]
- 37.Oti M., Snel B., Huynen M.A., Brunner H.G. Predicting disease genes using protein-protein interactions. J. Med. Genet. 2006;43:691–698. doi: 10.1136/jmg.2006.041376. [DOI] [PMC free article] [PubMed] [Google Scholar]
- 38.Sawcer S. The complex genetics of multiple sclerosis: pitfalls and prospects. Brain. 2008;131:3118–3131. doi: 10.1093/brain/awn081. [DOI] [PMC free article] [PubMed] [Google Scholar]
- 39.Tabor H.K., Risch N.J., Myers R.M. Candidate-gene approaches for studying complex genetic traits: practical considerations. Nat. Rev. Genet. 2002;3:391–397. doi: 10.1038/nrg796. [DOI] [PubMed] [Google Scholar]
- 40.Hauser M.A., Li Y.J., Takeuchi S., Walters R., Noureddine M., Maready M., Darden T., Hulette C., Martin E., Hauser E. Genomic convergence: identifying candidate genes for Parkinson’s disease by combining serial analysis of gene expression and genetic linkage. Hum. Mol. Genet. 2003;12:671–677. [PubMed] [Google Scholar]
- 41.Ban M., McCauley J.L., Zuvich R., Baker A., Bergamaschi L., Cox M., Kemppinen A., D’Alfonso S., Guerini F.R., Lechner-Scott J. A non-synonymous SNP within membrane metalloendopeptidase-like 1 (MMEL1) is associated with multiple sclerosis. Genes Immun. 2010;11:660–664. doi: 10.1038/gene.2010.36. [DOI] [PMC free article] [PubMed] [Google Scholar]
Associated Data
This section collects any data citations, data availability statements, or supplementary materials included in this article.