Abstract
This study was performed to evaluate dosimetric differences between current intensity modulated radiation therapy (IMRT) delivery modes: Step-and-shoot (SS), sliding window (SW), and volumetric modulated arc therapy (VMAT). Plans for 15 prostate cancer patients with 10 MV photon beams using each IMRT mode were generated. Patients had three planning target volumes (PTVs) including prostate, prostate plus seminal vesicles, and pelvic lymphatics. Dose volume histograms (DVHs) of PTVs and organs at risk (OARs), tumor control probability (TCP) and normal tissue complication probabilities (NTCPs), conformation number, and monitor units (MUs) used were compared. Statistical analysis was performed using the analysis of variance (ANOVA) technique. The TCPs were < 99% with insignificant differences among modalities (P > 0.99). Doses to all critical structures were higher on average with SW method compared to SS, but insignificant. NTCP values were lowest for VMAT in all structures excepting bladder. Normal tissue volumes receiving doses in the 20-30 Gy range were reduced for VMAT compared to SS. Percentage of MUs required for VMAT to deliver a comparable plan to SS and SW was at least 40% less. In conclusion, similar target coverage and normal tissue doses were found by the three compared modes and the dosimetric differences were small.
Keywords: Intensity modulated radiation therapy, prostate cancer, step-and-shoot, sliding window, volumetric modulated arc therapy
Introduction
According to the National Cancer Institute, in 2013 it is estimated that approximately 238,590 new cases of prostate cancer and 29,720 deaths will be reported in the United States[1] making prostate cancer the second most prevalent type of cancer affecting American men today.[2] It has been shown in randomized trials that many forms of prostate cancer have effective response to external beam radiation therapy with an escalated dose in the range of 78-81 Gy when compared to the conventional prescription of 70 Gy[3,4] demonstrating between 6 and 20% reduction in biochemical failure. However, utilizing dose escalation to the prostate in three-dimensional conformal plans (3D CRT) has led to unacceptably high complication rates for the rectum. The preferred method for treating prostate cancer patients with radiation is intensity modulated radiation therapy (IMRT) because studies have shown that it can reduce the acute grade 2 gastrointestinal (GI) toxicity from an escalated dose plan by approximately 40%.[5]
Present IMRT technology affords the ability to treat patients using several different modes. The static modes, step-and-shoot (SS) and sliding window (SW), deliver dose from a discrete number of beam angles. For SW, the beam is maintained while the multileaf collimators (MLC) slide across the treatment aperture at varied rates to “paint” a continuous fluence pattern. In contrast, SS steps the MLC to a set of discrete aperture shapes, and only delivers beam when the leaves are stationary at each position. This produces a fluence pattern with a number of discrete levels equal to the number of steps. The most modern and complex of these modes is volumetric modulated arc therapy (VMAT), which rotates the gantry of the linear accelerator around the patient for a partial or full arc at a constant or variable rate. The MLC are in constant motion with the radiation beam on during the rotation, and the dose rate is continuously varied to weight the beam based on the incident angle. Similar to SW, the fluence is continuous and “painted” by the moving MLC, but also by the moving gantry and variable dose rate. This generates fluence across a full or partial ring rather than across a single beam aperture. In principle, this mode reduces streaking and normal tissue dose by distributing the incoming beam over a larger volume for less dose per volume.
There is currently no consensus about which delivery mode is best in terms of dosimetry for prostate treatments, therefore the selection of treatment modality is mainly dependent on other factors, such as delivery time (affecting patient motion and clinical efficiency), available hardware, and planning efficiency (calculation time, ease of optimization, etc.). This study, a continuation and expansion of the work presented at the XII Mexican Medical Physics Symposium,[6] compared the dosimetry of the three radiation delivery modes SS, SW, and VMAT to determine the advantages of one mode over other that may serve as guidelines for the treatment planning process. Several similar studies have been conducted or are in progress from several other centers[7,8,9,10,11,12,13] including comparative evaluations for other modes such as tomotherapy.[7–8,11,13]
Materials and Methods
Patient data
This retrospective study utilized the computed tomography (CT) and planning data of 15 patients with adenocarcinoma of the prostate, stages T1c to T3a, from the Radiation Oncology Department at the University of Oklahoma Health Sciences Center (OUHSC) who were treated with radiation at the OU Medical Center and at the Peggy and Charles Stevenson Oklahoma Cancer Center. Permission for this study was granted by the institutional review board (IRB). The average group age was 66.3 years (range, 44-86 years), the patients’ prostate-specific antigen levels ranged from 5 to 20+ , and the Gleason scores ranged from 6 to 8+ , individual patient characteristics along with the planning target volumes (PTVs) are shown in Table 1.
Table 1.
Patient characteristics
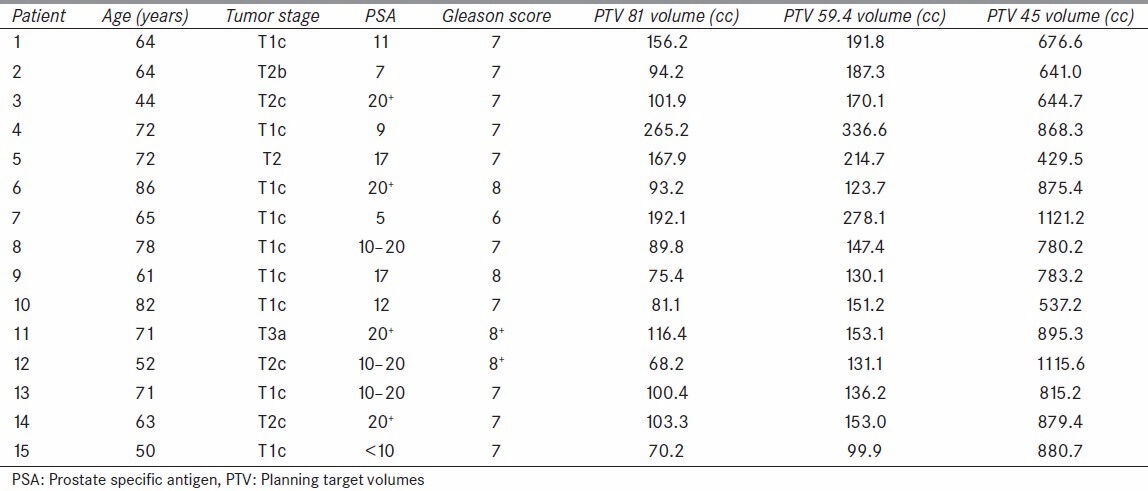
Patients were set up according to the department’s prostate cancer CT simulation protocols with specifications requested by the attending physicians. Patients were set up in supine position with a VAC-Bag under the knees, and were scanned with a 16-slice GE Discovery CT590 RT Simulator with a full bladder, with and without contrast if possible. Planning was performed on the full bladder scan without contrast. The contrasted scans help to better visualize the base of the bladder as it blends into the bladder neck, as well as the prostatic apex.
Treatment planning
The treatment plans created for each of the three IMRT modalities were based on identical target segmentation and normal structure delineations as those used in the original for-treatment plans. Each plan had three PTVs. The whole pelvis, PTV 45, was planned to 45 Gy according to Radiation Therapy Oncology Group (RTOG) studies 0534, 8610, 9202, and 9413.[14,15,16] This PTV was generated with a 5 mm margin on lymphatics contoured from L5-S1 down to the femoral heads, a 7 mm margin on the seminal vesicles, and a 7 mm margin on the prostate (except in the inferior direction, where it was 1 cm). The prostate plus seminal vesicles, PTV 59.4, was planned to 59.4 Gy according to the standard used in our department providing sufficient ablative dose to the vesicles without risking too much dose to the rectum. This PTV had expansions of 5 mm on the seminal vesicles and 7 mm on the prostate (except the posterior, which was 5 mm, and the inferior, which was 10 mm). The prostate alone, PTV 81, was boosted to the escalated dose of 81 Gy, with 5 mm margins (except the posterior, which was 3 mm, and the inferior, which was 7≈mm). All treatment plans are normalized to have 95% of the PTV receive 100% of the prescription dose. Risks for nodal and seminal vesicle involvement were estimated using standard guidelines.[17]
The doses to the organs at risk (OARs) were restricted by the RTOG guidelines for critical structure dose. Normal tissue doses in general were limited using the Varian Eclipse Normal Tissue Objective option during optimization, which attempts to achieve a certain dose falloff around the PTV based on user-set parameters. Normal tissue doses for all cases were set to fall from 100 to 60% of the prescription dose starting 4 mm from the PTV, with a falloff rate of 0.15. This falloff parameter is a unit less value that affects the character of an inverse exponential dose fall off. A full list of OAR constraints are shown in Table 2. Photon fields with 10 MV were arranged according to the dosimetrist’s judgment to aid the optimization in avoiding unnecessary high doses to the critical structures without compromising target coverage.
Table 2.
Organs at risk (OARs) constraints for plan optimization
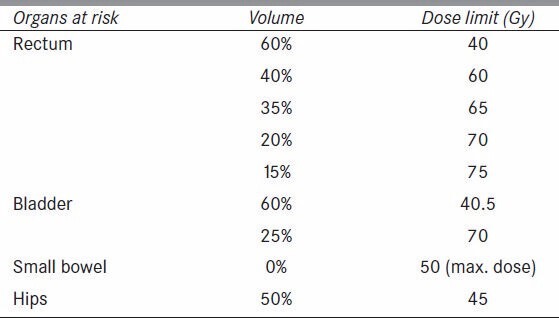
The Anisotropic Analytical Algorithm (AAA) version 8.9 Eclipse Treatment Planning Software (Varian Medical Systems, Palo Alto CA) was used for all dose calculations. The plans for SS and SW, had nine coplanar fields (with gantry angles 200, 240, 280, 320, 0, 40, 80, 120, 160 degrees) for the whole pelvis and prostate plus seminal vesicles, and seven coplanar fields (same, without 200 or 160 degree beams) for the final prostate boost for all patients to ensure identical beam angle arrangements. Similarly, the VMAT plans had two coplanar arcs for the whole pelvis and prostate plus seminal vesicles, and one arc for the final boost for all patients. VMAT plans used the Varian Rapid Arc technology, which utilizes a constant gantry rotation speed, relying only on dose rate for angular weighting.
Leaf motion calculation was performed by the Varian Leaf Motion Calculator (VLMC) utilizing the default configuration settings. These default settings included a maximum 166 control points for SS and SW plans, an internal constant minimum of 64 segments, and 70 intensity levels for SW. Rapid arc plans are set to use 178 control points per arc.
Metrics of radiobiology
Data on target and normal structure doses and volumes derived from the dose volume histograms (DVHs) of the calculated plans were exported from Eclipse into Mathworks’ MATLAB version R2008b for processing, and were utilized in the calculation of the equivalent uniform doses (EUDs), tumor control probability (TCP), and normal tissue complication probabilities (NTCP). The EUDs were calculated with the method presented by Niemierko[18] based on the linear quadratic model of cell survival. The EUD represents the amount of uniform dose needed to be delivered to the entire PTV to cause the same biological effect as the actual dose distribution in the plan. The EUD values are necessary to simplify the calculation of the TCP. The TCP is a measure of the probability of achieving the tumor control expected from the treatment, given the radiobiological characteristics of the tumor cells being treated. For this study we used the notation of Nahum and Tait,[19,20] shown in Equation 1. In the calculation of the TCP, radiobiological parameters used in a paper by Vlachaki et al., were used[21] including a cell density of 10 million clonogens per cm3 (N), a survival fraction at a reference dose (Dref ) of 2 Gy (SF2 ) of 0.5, an α/β-value of 3. The number of fractions, n, was a constant 45. TCP was only calculated for the PTV 81 volume.

The NTCP is a metric for measuring the chance of inducing complications on critical structures. It is calculated independently for each critical structure based on their radiobiological properties, the type of effect being considered, and the volume dose distribution within the structure. The NTCP calculation used the Lyman-Kutcher-Burman method[22,23,24] shown in Equations 2 through 4 with radiobiological values taken from Burman et al.[24]
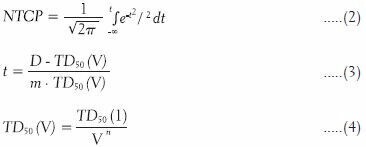
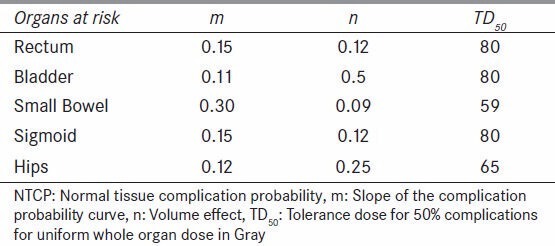
TD50 represents the tolerance dose for 50% complications for uniform whole organ dose in Gray. The values for n and m are constants determined by fitting organ specific tolerance doses for whole and partial organ uniform dose to Equation 2, with m describing the slope of the complication probability curve, and n describing the volume effect, or shifting of the complication probability curve in relation to volume irradiated. The parameters m, n, and TD50 used for each critical structure are shown in Table 3.
Table 3.
NTCP calculation constants for critical structures
Index of conformation
The conformation number (CN) is a value developed by van’t Riet et al.,[25] designed to evaluate how well the prescription isodose line matches the PTV volume. A value of unity represents the maximum possible, and best result (perfect conformation), with zero as the worst possible value (no overlap).

Where VRI is the volume of the prescription isodose (RI), TV is the target volume, and TVRI is the target volume covered by the prescription. The first term in the equation is less than one if any target volume is not covered by the volume of the prescription isodose line, and the second term is less than one if any normal tissue is within the volume of the prescription isodose line, as is shown in Figure 1.
Figure 1.
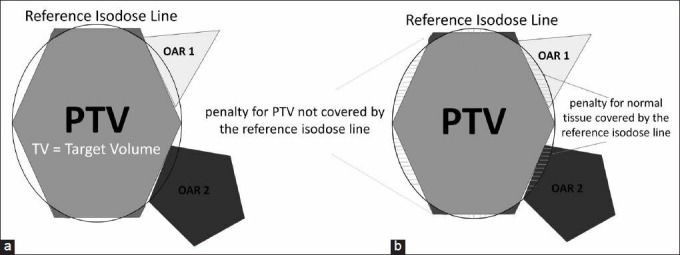
Conformation number (CN): (a) The ring represents the reference isodose line (RI) that includes the planning target volume (PTV) and organs at risk (OARs), (b) The first term of the CN formula (TVRI/TV) is less than one if TV is not covered entirely by the volume of RI, and the second term (TVMRI/VRI) is less than one if OAR is within the volume of RI
Monitor units (MUs)
The machine calibration dose rate was set to deliver 1 cGy per MU at dmax for a 10 × 10 field at 100 SSD. The number of MUs was related to the leakage dose to the patient, which had no therapeutic benefit, but instead contributed to the risk of developing secondary cancers, as was shown by Followill et al.,[26] and Hall et al.[27,28] The quantity of MUs calculated per patient for each treatment modality was recorded and tabulated for comparison.
Statistical analysis
Statistical analysis was performed by using analysis of variance (ANOVA), reporting P-values of <0.05 from the hypothesis test significant.
Results
Planned target volumes
The plans calculated for SS, SW, and VMAT treatment modalities achieved comparable dose coverage for the three planned target volumes without compromising the specified constraints for normal structures. The average mean and minimum doses for PTV 81, PTV 59.4, and PTV 45 were approximately 83 and 76 Gy, 79 and 56 Gy, and 57 and 39 Gy, respectively, and are listed on Table 4 for all three treatment modalities. From the DVHs, the VMAT plans resulted in more homogeneous dose distributions with slightly higher minimum doses overall, but with no statistical significance (P > 0.3). The average mean doses for PTV 45 and PTV 59.4 volumes are higher than the prescribed 45 and 59.4 Gy, respectively due to the overlap of these structures with the higher dose PTV 81 volume. The conformation numbers per individual patient calculated for the PTV 81 plans are illustrated in Figure 2. The VMAT plans had higher CN for six patients, all three plans had equivalent CN for five patients, SS and SW had equivalent higher CN for two patients, and SS had higher CN for two patients. The TCP values calculated for all three treatment modalities were greater than 99.95%, with differences between modes less than 0.01% for any given patient.
Table 4.
Average minimum and mean doses for all planning target volumes (PTVs) (P > 0.3)

Figure 2.
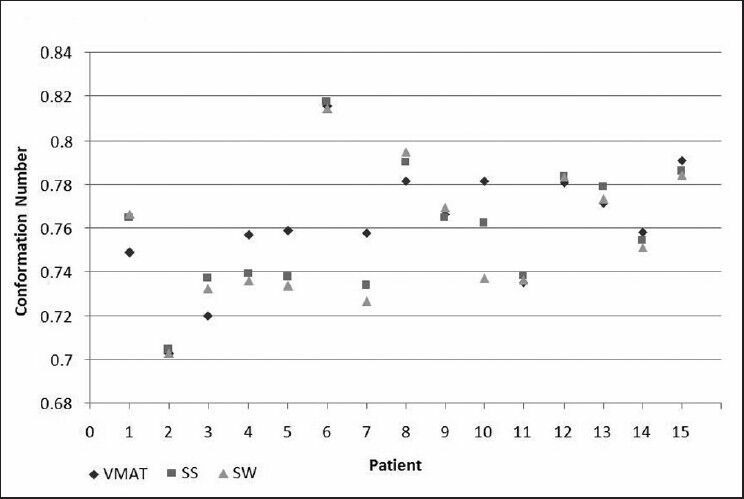
Conformation number (CN) for PTV81 for step-and-shoot (SS), sliding window (SW), and volumetric modulated arc therapy (VMAT)
OARs
The averaged mean and maximum doses for rectum, bladder, small bowel, sigmoid, and right and left hips were approximately 41 and 84 Gy, 39 and 85 Gy, 14 and 48 Gy, 32 and 55 Gy, 32 and 51 Gy, respectively, as listed on Table 5 for all three treatment modalities, with no statistical significance when the three modalities were compared (P > 0.5).
Table 5.
Average mean and maximum doses for all organs at risk (OARs) (P > 0.5)

The criteria for bladder and rectum by RTOG 0126 specifies limiting doses to the 15, 25, 35, and 50% volumes, to ≤80 and 75 Gy, ≤75 and 70 Gy, ≤70 and 65 Gy, and ≤65 and 60 Gy, respectively. For the purpose of analysis, specific doses to 5, 10, 15, 25, 35, and 50% of the volume of each critical structure are graphed for all three treatment modalities and shown in Figure 3. All three methods were able to produce volumetric doses well below the recommendations of RTOG 0126. On average, the bladder received slightly higher doses from SW plans, while the SS and VMAT plans showed similar doses throughout, except at 5% volume for which VMAT delivered slightly higher dose (P > 0.9). The doses to 5 and 10% of the rectum were lower with VMAT, but higher for 15% and larger volumes (P > 0.7). The VMAT plans produced lower doses to small bowel volumes of 25% and less (P > 0.9). The sigmoid received higher doses throughout the entire volume from VMAT (P > 0.9). The VMAT plans reduced the doses to the volumes of the right and left hips (P > 0.5 and >0.3, respectively). The NTCP values calculated for each OARs and all three treatment modalities were less than 0.03% for bladder, sigmoid, and right and left hips, and less than 3.5% for rectum and small bowel (P > 0.9).
Figure 3.
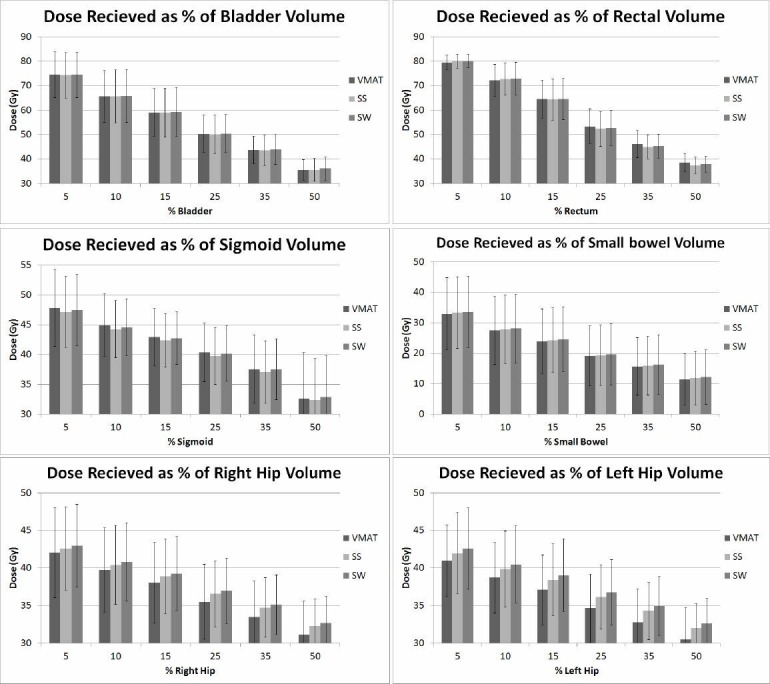
Average doses to specific volumes of the organs at risk (OARs) from intensity modulated radiation therapy (IMRT) modalities: step-and-shoot (SS), sliding-window (SW), and volumetric modulated arc therapy (VMAT)
MUs
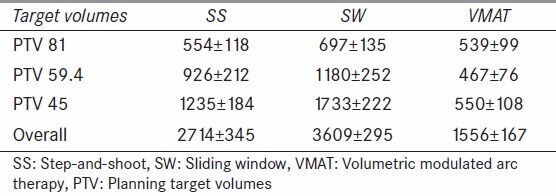
A comparison of the average MU’s required to deliver SS, SW, and VMAT plans is presented in Table 6. The VMAT treatment delivery technique calculated an average of 43% less MUs compared to the SS and 57% less compared to the SW (P < 0.02). This may represent an approximately 0.3% increased risk of induced secondary malignancy for SS and SW compared to VMAT.[26]
Table 6.
Calculated monitor units (mean and standard deviation) for different IMRT delivery modes (MUs)
Discussion
The employment of newer and more complex technologies for the treatment of tumors with high energy radiation stimulates constant efforts to improve target coverage while keeping normal tissue doses under known thresholds in order to avoid complications. Investigations have shown the benefits of IMRT over 3DCRT in the treatment of prostate cancer[4,5,12,21,29] by having the ability to create highly conformal energy fluence fields that allow dose escalation and reduction in toxicity to the OAR. Thus, IMRT with SS and SW modalities became the standard of treatment for patients with prostate cancer at our institution. At the time of this study, a newly acquired machine (TrueBeam) with the capability of VMAT had been commissioned, and so it was necessary to understand the dosimetric characteristics of this technique over the other two IMRT delivering techniques (SS and SW) that were clinically used.
As it was observed, all three techniques rendered similar and equivalent target dose distributions that were able to reach the planning goals and substantially reduce the dose spillage to the healthy tissues. An extensive literature review revealed research projects that concluded comparable results. In an investigation by Tsai et al.,[7] on plans for 12 prostate cancer patients, it was reported that when comparing VMAT with IMRT and helical tomotherapy (HT), the minimum doses to the PTV (95% PTV ≥ 78 Gy) met the planning goals with no statistically significant differences among them (P > 0.34). For the conformity index (CI) however, HT had the best CI, followed by VMAT and SS IMRT (P < 0.001). Wolff et al.,[8] conducted a similar study with data from nine patients for which VMAT, serial tomotherapy (MIMic), SS IMRT, and 3DCRT techniques were compared. Their prescribed median dose to the PTV was 76 Gy and a minimum dose of 90% (68.4 Gy). Their results showed that the mean doses to the PTV were comparable for all four techniques, and their conformity metrics had superior results for IMRT. They defined the posterior rectum as their most important critical structure and achieved mean doses in the range of 31.85-38.75 Gy for IMRT techniques and 55.43 Gy for 3DCRT, while the anterior rectum was exposed to doses ranging from 54 (IMRT) to 61 (VMAT) and 66 Gy (3DCRT). Pasler et al.,[9] compared VMAT and IMRT on the basis of 6, 10, and 15 MV photon energies on 10 plans. The prescription dose to PTV and lymph nodes was 50 Gy plus a boost of 24 Gy (PTVB ). They reported PTVB mean doses, on the 10 MV plans, for VMAT and IMRT of 74.4 Gy with CI of 0.81, and 74.6 Gy with CI of 0.76, respectively. Their VMAT and IMRT mean doses to the rectum, bladder, and small bowel were 42.7 and 43.6 Gy, 52.8 and 52.7 Gy, 25.9 and 27.5 Gy, respectively. In our study, the minimum and mean doses to the PTV 8100 were equivalent (˜76 and 83 Gy, respectively) and the calculated conformation number was 0.81 for all three techniques with statistically insignificant differences (P > 0.9). The doses to the rectum, bladder, and small bowel for IMRT (SS and SW) and VMAT were approximately 41, 39, and 14 Gy, respectively, for all three techniques with statistically insignificant differences (P > 0.5).
Phase III randomized trials[3] have reported dose-volume effects on normal tissue toxicity indicating that radiation treatment plans should carefully be designed so that no more than 25% of the rectal volume is irradiated to more than 70 Gy to avoid grade 2 rectal toxicity. Kopp et al.,[10] compared, retrospectively, the calculated volumetric doses of 292 VMAT and fixed-field IMRT prostate treatment plans with prescription dose of 77.4 Gy. They looked at the doses received by 5, 10, 15, 25, 35, and 50% of the volumes of bladder and rectum; as well as mean doses to penile bulb and 10% of femoral heads. They reported that the mean doses to 5 and 10% of the rectal volumes were lower with VMAT than with fixed field IMRT (P < 0.0001), and for 15% of the rectal volume both techniques did not show any statistical difference (P = 0.95). However, for larger volumes (25-50%) the mean doses were reported greater with VMAT (P < 0.0001). For the bladder, and throughout each segmented volume, the VMAT plans had lower doses than the fixed field IMRT plans (P < 0.0001). The average mean dose to 10% of the femoral heads was 30.97 Gy with VMAT and 31.89 Gy with IMRT. Although our study was only based on data from 15 patients, we were able to observe a similar trend with bladder doses being moderately less with VMAT and SS than with SW. Mean rectal doses to 5 and 10% of the volume were also lower with VMAT, almost identical for all techniques at 15% rectal volume, and higher for 25, 35, and 50% rectal volumes. The mean doses to 10% volume of the right and left hips were 39.37 and 38.72 Gy for VMAT, 40.40 and 39.86 Gy for SS, and 40.80 and 40.47 Gy with SW, respectively.
All the intensity modulated methods of treatment are capable of producing similar dosimetric plans with high conformality and reduced impact on normal tissue involvement. The greatest differences then lie on the treatment delivery, which includes the amount of MUs and the time taken for each treatment fraction. This is an important feature that has been correlated to the probability of incidence for secondary cancers[27,28] as higher number of MUs implicates a larger amount of radiation scatter and leakage, and hence absorbed radiation dose outside the treated volume.[26,27,28] Among the three techniques, the general observation is that VMAT is capable of delivering a dosimetrically comparable treatment with lesser amount of MUs. Tsai et al.,[7] for the 12 patients in their study reported a reduction of average MUs that was equated to a 69% reduction of “beam on” time. Our study did not make a relation of MUs with treatment time since they are not directly correlated, with VMAT modulating dose rate and SS with beam off time between each step. However, for the total amount of MUs needed (PTV 45, PTV 59.4, and PTV 81 all combined), the number of MUs for VMAT was at least 40% less than SS and SW IMRT techniques. Davidson et al.,[11] assessed the differences among 25 VMAT, static IMRT and HT treatment plans and concluded that VMAT required 15-38% fewer MUs than static IMRT overall.
This investigation was initiated at our facility to gain an understanding of the emerging technology and help our clinical practice with dosimetric guidelines. The major limitation of our study is attributed to the small population data, due in part to the non-trivial time taken to create a static IMRT plan for an arc treated patient, and vice versa. It may be of interest to carry this investigation further to include target localization or methods for reduction in target mobility, target volume variability and deformation, sequential clinical outcomes with patient follow-ups, and a much larger patient data set.
Conclusions
The results of this study do not suggest a clear dosimetric superiority of any of the delivery modes. There may be specific patient anatomical characteristics, such as the sizes of structures or the arrangement of structures within the body that may have stronger effect on the dosimetric characteristics of the three treatment methods than the inherent technical differences. The scale of the variations among the different delivery methods is generally small. Therefore, the treatment planning and delivery time should be of greatest consideration when selecting a treatment method for a specific patient.
Footnotes
Source of Support: Nil
Conflict of Interest: None declared.
References
- 1.Prostate Cancer [Internet] [Place unknown]: National Cancer Institute; [Last cited on 2013 Apr 10]. Available from: http://www.cancer.gov/cancertopics/types/prostate . [Google Scholar]
- 2.What are the key statistics about prostate cancer? [Internet] Place unknown: American Cancer Society Available; [Last cited on 2013 Apr 10]. Available from: http://www.cancer.org/Cancer/ProstateCancer/DetailedGuide/prostate-cancer-key-statistics . [Google Scholar]
- 3.Pollack A, Zagars GK, Starkschall G, Antolak JA, Lee JJ, Huang E, et al. Prostate cancer radiation dose response: Results of the M. D. Anderson phase III randomized trial. Int J Radiat Oncol Biol Phys. 2002;53:1097–105. doi: 10.1016/s0360-3016(02)02829-8. [DOI] [PubMed] [Google Scholar]
- 4.Zietman AL, DeSilvio ML, Slater JD, Rossi CJ, Jr, Miller DW, Adams JA, et al. Comparison of conventional dose vs. high-dose conformal radiation therapy in clinically localized adenocarcinoma of the prostate: A randomized controlled trial. JAMA. 2005;294:1233–9. doi: 10.1001/jama.294.10.1233. [DOI] [PubMed] [Google Scholar]
- 5.Al-Mamgani A, Heemsbergen WD, Peeters ST, Lebesque JV. Role of intensity-modulated radiotherapy in reducing toxicity in dose escalation for localized prostate cancer. Int J Radiat Oncol Biol Phys. 2009;73:685–91. doi: 10.1016/j.ijrobp.2008.04.063. [DOI] [PubMed] [Google Scholar]
- 6.Schnell E, De La Fuente Herman T, Young J, Hildebrand K, Algan O, Syzek E, et al. Dosimetric comparison of volumetric modulated arc therapy, step-and-shoot, and sliding window IMRT for prostate cancer. American Institute of Physics. In: Zamudio F, Brandan M, Gamboa-deBuen I, Herrera-Corral H, Medina-Velázquez L, editors. Proceedings of the 12th Mexican Symposium on Medical Physics; 2012. pp. 23–6. [DOI] [PubMed] [Google Scholar]
- 7.Tsai CL, Wu JK, Chao HL, Tsai YC, Cheng JC. Treatment and dosimetric advantages between VMAT, IMRT, and helical tomotherapy in prostate cancer. Med Dosim. 2011;36:264–71. doi: 10.1016/j.meddos.2010.05.001. [DOI] [PubMed] [Google Scholar]
- 8.Wolff D, Stieler F, Welzel G, Lorenz F, Abo-Madyan Y, Mai S, et al. Volumetric modulated arc therapy (VMAT) vs. serial tomotherapy, step-and-shoot IMRT and 3D-conformal RT for treatment of prostate cancer. Radiother Oncol. 2009;93:226–33. doi: 10.1016/j.radonc.2009.08.011. [DOI] [PubMed] [Google Scholar]
- 9.Pasler M, Georg D, Wirtz H, Lutterbach J. Effect of photon-beam energy on VMAT and IMRT treatment plan quality and dosimetric accuracy for advanced prostate cancer. Strahlenther Onkol. 2011;187:792–8. doi: 10.1007/s00066-011-1150-0. [DOI] [PubMed] [Google Scholar]
- 10.Kopp RW, Duff M, Catalfamo F, Shah D, Rajecki M, Ahmad K. VMAT vs.7-field IMRT: Assessing the dosimetric parameters of prostate cancer treatment with a 292-patient sample. Med Dosim. 2011;36:365–72. doi: 10.1016/j.meddos.2010.09.004. [DOI] [PubMed] [Google Scholar]
- 11.Davidson MT, Blake SJ, Batchelar DL, Cheung P, Mah K. Assessing the role of volumetric modulated arc therapy (VMAT) relative to IMRT and helical tomotherapy in the management of localized, locally advanced, and post-operative prostate cancer. Int J Radiat Oncol Biol Phys. 2011;80:1550–8. doi: 10.1016/j.ijrobp.2010.10.024. [DOI] [PubMed] [Google Scholar]
- 12.Palma D, Vollans E, James K, Nakano S, Moiseenko V, Shaffer R, et al. Volumetric modulated arc therapy for delivery of prostate radiotherapy: Comparison with intensity-modulated radiotherapy and three-dimensional conformal radiotherapy. Int J Radiat Oncol Biol Phys. 2008;72:996–1001. doi: 10.1016/j.ijrobp.2008.02.047. [DOI] [PubMed] [Google Scholar]
- 13.Pasquier D, Cavillon F, Lacornerie T, Touzeau C, Tresch E, Lartigau E. A dosimetric comparison of tomotherapy and volumetric modulated arc therapy in the treatment of high-risk prostate cancer with pelvic nodal radiation therapy. Int J Radiat Oncol Biol Phys. 2013;85:549–54. doi: 10.1016/j.ijrobp.2012.03.046. [DOI] [PubMed] [Google Scholar]
- 14.Pilepich MV, Winter K, John MJ, Mesic JB, Sause W, Rubin P, et al. Phase III radiation therapy oncology group (RTOG) trial 86-10 of androgen deprivation adjuvant to definitive radiotherapy in locally advanced carcinoma of the prostate. Int J Radiat Oncol Biol Phys. 2001;50:1243–52. doi: 10.1016/s0360-3016(01)01579-6. [DOI] [PubMed] [Google Scholar]
- 15.Hanks G, Pajak T, Grignon D, Brereton H, Venkatesan V, Horwitz E, et al. Phase III trial of long-term adjuvant androgen deprivation after neoadjuvant hormonal cytoreduction and radiotherapy in locally advanced carcinoma of the prostate: The radiation therapy oncology group protocol 92-02. J Clin Oncol. 2003;21:3972–8. doi: 10.1200/JCO.2003.11.023. [DOI] [PubMed] [Google Scholar]
- 16.Roach M, DeSilvio M, Lawton C, Uhl V, Machtay M, Seider M, et al. Phase III trial comparing whole-pelvic vs prostate-only radiotherapy and neoadjuvant versus adjuvant combined androgen suppression: Radiation therapy oncology group 9413. J Clin Oncol. 2003;21:1904–11. doi: 10.1200/JCO.2003.05.004. [DOI] [PubMed] [Google Scholar]
- 17.Leibel S, Phillips T. Textbook of radiation oncology. Philadelphia: W.B. Saunders Company; 1998. pp. 751–8. [Google Scholar]
- 18.Niemierko A. Reporting and analyzing dose distributions: A concept of equivalent uniform dose. Med Phys. 1997;24:103–10. doi: 10.1118/1.598063. [DOI] [PubMed] [Google Scholar]
- 19.Nahum AE, Tait DM. Maximizing tumor control by customized dose prescription for pelvic tumors. In: Breit A, editor. Advanced Radiation Therapy: Tumor Response Monitoring and Treatment Planning. Berlin: Springer; 1992. pp. 425–31. [Google Scholar]
- 20.Webb S. The physics of conformal radiotherapy: Advances in technology. Bristol and Philadelphia: Institute of Physics Publishing; 1997. pp. 258–87. [Google Scholar]
- 21.Vlachaki MT, Teslow TN, Amosson C, Uy NW, Ahmad S. IMRT versus conventional 3DCRT on prostate and normal tissue dosimetry using and endorectal balloon for prostate immobilization. Med Dosim. 2005;30:69–75. doi: 10.1016/j.meddos.2005.01.002. [DOI] [PubMed] [Google Scholar]
- 22.Lyman J. Complication probability as assessed from dose-volume histograms. Radiat Res Suppl. 1985;104:S13–9. [PubMed] [Google Scholar]
- 23.Kutcher GJ, Burman C. Calculation of complication probability factors for non-uniform normal tissue irradiation: The effective volume method. Int J Radiat Oncol Biol Phys. 1989;16:1623–30. doi: 10.1016/0360-3016(89)90972-3. [DOI] [PubMed] [Google Scholar]
- 24.Burman C, Kutcher GJ, Emami B, Goitein M. Fitting of normal tissue tolerance data to an analytic function. Int J Radiat Oncol Biol Phys. 1991;21:123–35. doi: 10.1016/0360-3016(91)90172-z. [DOI] [PubMed] [Google Scholar]
- 25.van’t Riet A, Mak AC, Moerland MA, Elders LH, van der Zee W. A conformation number to quantify the degree of conformality in brachytherapy and external beam irradiation: Application to the prostate. Int J Radiat Oncol Biol Phys. 1997;37:731–6. doi: 10.1016/s0360-3016(96)00601-3. [DOI] [PubMed] [Google Scholar]
- 26.Followill D, Geis P, Boyer A. Estimates of whole-body dose equivalent produced by a beam intensity modulate conformal therapy. Int J Radiat Oncol Biol Phys. 1997;38:667–72. doi: 10.1016/s0360-3016(97)00012-6. [DOI] [PubMed] [Google Scholar]
- 27.Hall E. Intensity-modulated radiation therapy, protons, and the risk of second cancers. Int J Radiat Oncol Biol Phys. 2006;65:1–7. doi: 10.1016/j.ijrobp.2006.01.027. [DOI] [PubMed] [Google Scholar]
- 28.Hall EJ, Wuu CS. Radiation-induced second cancers: The impact of 3D-CRT and IMRT. Int J Radiat Oncol Biol Phys. 2003;56:83–8. doi: 10.1016/s0360-3016(03)00073-7. [DOI] [PubMed] [Google Scholar]
- 29.Koontz BF, Das S, Temple K, Bynum S, Catalano S, Koontz JI, et al. Dosimetric and radiobiologic comparison of 3D conformal versus intensity modulated planning techniques for prostate bed radiotherapy. Med Dosim. 2009;34:256–60. doi: 10.1016/j.meddos.2008.10.005. [DOI] [PubMed] [Google Scholar]


