Abstract
The main purpose of this paper is to introduce a fast method for gene prediction in DNA sequences based on the period-3 property in exons. First, the symbolic DNA sequences were converted to digital signal using the electron ion interaction potential method. Then, to reduce the effect of background noise in the period-3 spectrum, we used the discrete wavelet transform at three levels and applied it on the input digital signal. Finally, the Goertzel algorithm was used to extract period-3 components in the filtered DNA sequence. The proposed algorithm leads to decrease the computational complexity and hence, increases the speed of the process. Detection of small size exons in DNA sequences, exactly, is another advantage of the algorithm. The proposed algorithm ability in exon prediction was compared with several existing methods at the nucleotide level using: (i) specificity - sensitivity values; (ii) receiver operating curves (ROC); and (iii) area under ROC curve. Simulation results confirmed that the proposed method can be used as a promising tool for exon prediction in DNA sequences.
Keywords: Algorithm, DNA sequence, discrete wavelet transform, Exon, Goertzel, protein coding region, signal processing
INTRODUCTION
Deoxyribonucleic Acid (DNA) is of the most important chemical compounds in living cells, bacteria, and some viruses.[1] It is composed of four types of different nucleotides, namely adenine (A), cytosine (C), guanine (G), and thymine (T).[2] However, only some specific areas of the DNA molecule, which called as genes, carry the coding information for protein synthesis. In eukaryotic cells, the DNA is divided into genes and inter-genic spaces. Genes are further divided into exon and intron, which is shown in Figure 1. Genes are responsible for protein synthesis; therefore, they are called protein-coding regions because they carry the necessary information for protein coding.[3,4,5] Protein-coding regions exhibit a period-3 behavior due to the codon bias involved in the translation process. This phenomenon caused background noise, which leads to more difficult of exon finding in DNA sequences.[6,7]
Figure 1.

Exon/Intron regions for eukaryotic DNA[2]
Nowadays, there are many digital signal processing (DSP) methods presented in literatures to identify the protein coding regions and also reduce the background noise in DNA sequences, which are based on Fourier spectral. In Tiwari et al,[8] Fourier transform is used for this purpose. In this way, a fixed-length window is selected and moved on the numerical sequence. Then, the exonic regions are determined by calculating the power spectrum. In our previous work,[9] the notch filter with the central frequency of 2ð/3 was used in order to remove the background noise. First, the DNA sequence is passed through a notch filter and then a sliding windowed discrete Fourier transform (DFT) is applied on the filtered sequence. In Saberkari et al,[10] a windowless technique based on the Z-curve was implemented to identify gene islands in total DNA sequence which called cumulative GC-Profile method. The main characteristic of this method is that the resolution of the algorithm output in displaying the genomic GC content is high since no sliding window is used, but the computational complexity of this method is also high. In Deng et al,[11] an appropriate method is proposed to predict the protein regions by combining the DFT and continues wavelet transform (CWT). CWT leads to eliminate the high frequency noise and, therefore, improves the accuracy of the prediction. In Datta et al,[12] a new algorithm is proposed based on Fourier transform using Bartlett window to suppress the non-exonic regions. In Akhtar et al,[13] the time domain algorithms have been used to determine the coding regions in DNA sequences. Adaptive filters[14] are one of the best tools for prediction tasks. In Baoshan et al,[15,16] two adaptive filtering approaches based on Kalman filter and least mean squares (LMS) are proposed for human gene identification. However, the major problem with LMS is that the convergence behavior of the algorithm is slow, which leads to high computational complexity. A parametric method based on autoregressive (AR) model proposed in Chakravarthy et al.,[17] for spectral estimation. The AR model has the advantage over the DFT that it works with smaller window sizes and, thus, shorter sequences.
In this paper, a fast method based on DWT and Goertzel algorithm is proposed to determine the location of exons in DNA sequences. The proposed algorithm improves the accuracy of the prediction, especially in detection of the small size exons. The rest of the paper is organized as follows: Section II describes the proposed algorithm in details. The evaluation criteria at nucleonic level are expressed in Section III. Section IV shows simulation results using Genbank database. Finally, Section V concludes the experiments and algorithms.
THE PROPOSED ALGORITHM
Figure 2 shows block diagram of the proposed algorithm to identify protein coding regions. The main steps of the algorithm are as follows that will be discussed in more details in this section.
Figure 2.
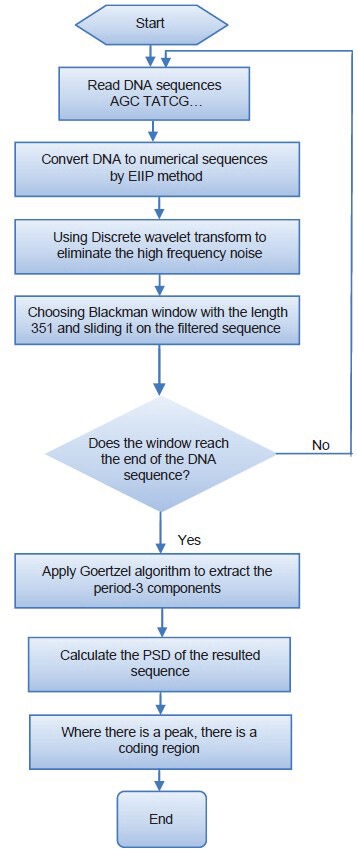
Block diagram of the proposed algorithm
Numerical mapping of DNA sequence using EIIP method,
Using DWT to remove the noise from the numerical sequence,
Choosing Blackman window with the length 351 and sliding it on the filtered sequence, and
Using Goertzel algorithm to extract the period-3 components.
DNA Numerical Representation
Converting the DNA sequences into digital signals[18,19] opens the possibility to apply signal processing methods for analyzing genomic data and reveals features of chromosomes. The genomic signal approach has already proven its potential in revealing large scale features of DNA sequences maintained over distance of 106-108 base pairs, including both coding and non-coding regions, at the scale of whole genomes or chromosomes.[20,21,22]
There are many methods for converting the DNA sequences into numerical signals like VOSS mapping,[6] Z-curve,[23] and EIIP.[24] In VOSS technique, the background noise is more dominant because the magnitude for each base is the same (i.e. 1 represents the presence of the nucleotide and 0 for its absence). The Z-curve technique is a 3-D curve for representing the DNA sequence. In this method, the dimension is reduced by projecting each 3-D curve into x-y axes, which leads to more computational complexity. In this paper, we have used EIIP method to convert DNA sequence into numerical signal. This approach allows DNA representations with either one or four sequence (s). It can be noticed that the EIIP representation has a different magnitude for each base and the distances among them are unequal. In this method, the electron-ion-interaction potential associated with each nucleotide is used for mapping of the DNA sequence. The EIIP values for the nucleotides are: A = 0.1260, G = 0.0806, T = 0.1335, C = 0.1340.[24]
Using Discrete Wavelet Transform to Reduce the High Frequency Noise
In this paper, DWT is applied on the input numerical sequence to remove the high frequency noise and hence, improve the accuracy of the algorithm for exonic region identification. In DWT, the signal is passed first through the high and low pass filters, then by down-sampling the filtered signal, samples are divided into two signals; high frequency samples (detail signals) and low frequency ones (approximation signals). The DNA numerical signal, x[n], is passed first through the high pass filter, g[n], then through the low pass filter, h[n]. So, we have:

Figure 3 shows our user-friendly package designed to analyze DNA sequences. This tool has been designed by our research group on genomic signal processing at Sahand University of Technology, Tabriz, Iran and consists of two main parts: The graphic display and the DSP tools for analyzing the DNA sequences. The graphic display allows the user to view the structure record either as a graphic or as a text record in txt formats. Also, it can be useful to search option for special patterns in the sequences (for example, start and stop codons in DNA sequences). The DSP tools are applying to DNA sequences in order to spectral analysis.
Figure 3.
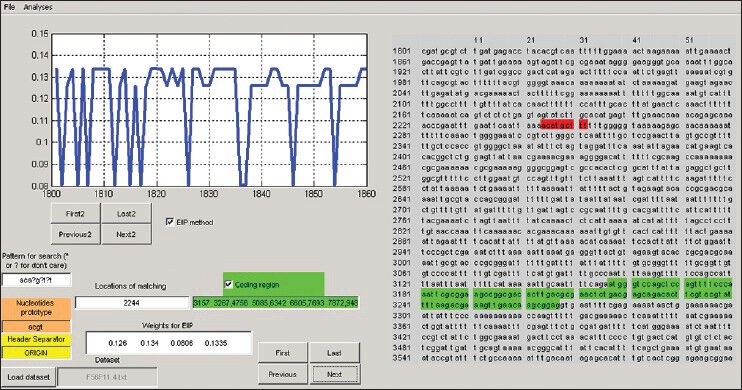
A view of the designed user-friendly package for analyzing DNA sequences
Briefly, there are some advantages for this tool as mentioned below:
Loading of any DNA sequences
Genomic sequence representation
Conversion of the genomic sequence into digital values by EIIP or binary methods
Search option for special patterns in the sequence
Applying of DSP methods such as DFT on the signal
Prediction of the protein coding regions.
Figure 4a and b show the result of applying DWT algorithm on the sequence F56F11.4. The power spectrum of the signal is smoothed by removing the high frequency components. Hence, the noise effect is decreased, which leads to improve the accuracy of identification task.
Figure 4.
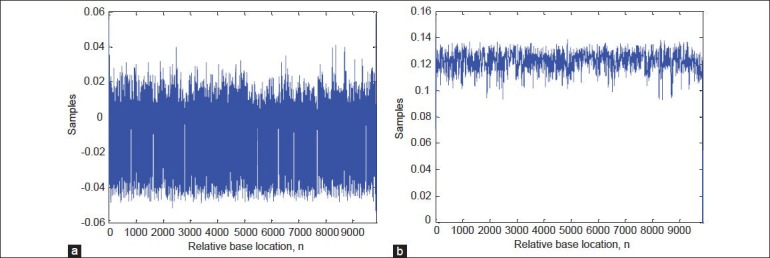
Applying DWT to the numerical sequence. (a) High frequency components of level 3 DWT decomposition (detail signal). (b) Low frequency components of level 3 DWT decomposition (approximation signal)
Choosing Blackman Window and Sliding it on the Estimated Sequence
In DNA sequence analysis, it is important to make the window size sufficiently large. In this paper, like many other researches such as Tiwari et al.,[8] and Akhtar et al.,[13] we have taken the window length equal to 351. Since there are very few intron-containing genes in these sequences, open reading frames (ORFs) of length less than 300 bp are not frequently encountered. A window length in the range of 250-400 gives the similar results. The windows of length less than 250 increase the noise level resulting in unacceptable statistics, while those greater than 400 tend to miss the ORFs due to numerous overlaps.[8]
In the proposed algorithm, we have employed a Blackman window to segment the filtered sequence. The Blackman window gives high weight to the codon positions residing in center of window and much less weight to the codons near the window boundaries. Hence, the noise cancelling level in Blackman window is higher than the other windows. The impulse response of the FIR windows is depicted in Figure 5. As can be seen, Blackman window has the highest amount of attenuation between the other windows. So, the background noise is more suppressed by Blackman window.
Figure 5.
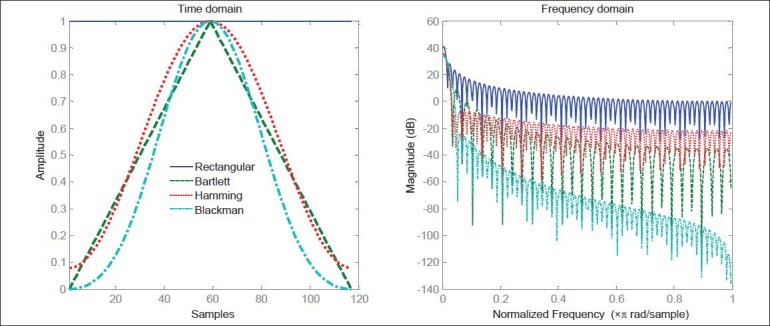
Comparison of the different FIR windows and their frequency impulse responses
Goertzel Algorithm
The Goertzel algorithm is a digital signal processing technique that provides a means for efficient evaluation of individual terms of DFT, thus making it useful in certain practical application, such as dual-tone multi frequency (DTMF) signals,[25] digital multi frequency (MF) receiver,[26] and in a very small aperture terminal (VSAT) satellite communication system.[27]
The Goertzel filter is composed of a recursive part and a non-recursive part [Figure 6]. The DFT coefficients are obtained as the output of the system after N iterations which N is the input signal length. The recursive part is a second-order IIR filter (resonator) with a direct form structure. The resonant frequency of the first stage filter is set at equally spaced frequency points; that is,  (This value is chosen
  in this work to extract the period-3 components, exactly). The second stage filter can be observed to be an FIR filter, since its calculations do not use of the previous values of the output. In fact, we only compute the recursive part of the filter at every sample update and the non-recursive part is computed only after the Nth time instant when the Fourier coefficients are to be determined.[28]
Figure 6.
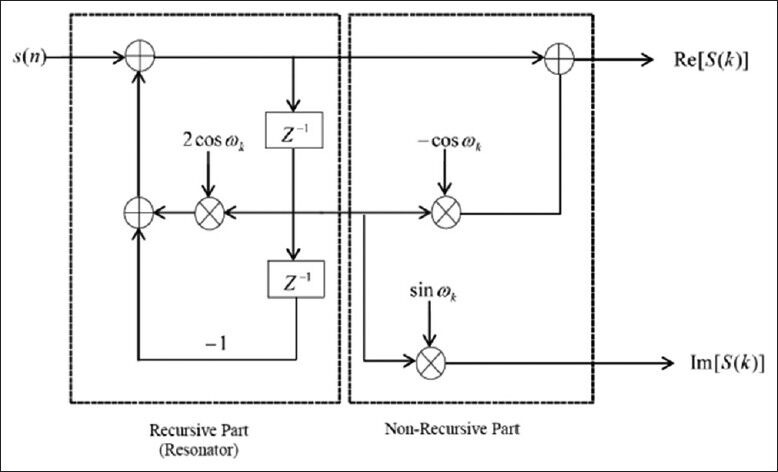
Filter realization of the Goertzel algorithm[28]
The major advantage of Goertzel algorithm is its ability to reduce the computational complexity relative to other existence methods such as DFT. This algorithm requires N real multiplications and a single complex multiplication to compute a sample. However, DFT and decimation in time FFT require N2 and N log2N complex multiplications, respectively.[28]
EVALUATION CRITERIA AT NUCLEOTIDE LEVEL
In order to compare accuracy of the different methods for protein coding regions detection, the evaluation is done at nucleotide level. For this purpose, we introduce some parameters that are listed as follows:
Sensitivity, Specificity, and Precision
These parameters are defined as follow according to[13] and:[29]

where true positive (TP) is the number of coding nucleotides correctly predicted as coding, false negative (FN) is the number of coding nucleotides predicted as non-coding. Similarly, true negative (TN) is the number of non-coding nucleotides correctly predicted as non-coding, and false positive (FP) is the number of non-coding nucleotides predicted as coding.
Receiver Operating Characteristic Curves
The receiver operating characteristic (ROC) curves were developed in the 1950s as a tool for evaluating prediction techniques based on their performance.[30] An ROC curve explores the effects on TP and FP as the position of an arbitrary decision threshold is varied. The ROC curve can be approximated using an exponential model as follow:[31]

in which, parameters α, β1 and β2 can be determined by minimizing the error function:

where p = [α β1 β2]T and {xi, yi} are points in the ROC plane.
Area Under the ROC Curve
This parameter is also a good indicator of the overall performance of an exon-location technique. The greater the AUC leads to the better performance of the tested algorithm.[29]
SIMULATION RESULTS
In order to demonstrate the performance of the methods, we apply them on four gene sequences; F56F11.4, AF009962, AF019074.1, and AJ223321 from GenBank database.[32] The gene sequence F56F11.4 (GenBank No. AF099922) is on chromosome III of Caenorhabditiselegans. C elegans is a free living nematode, about 1 mm in length, which lives in temperate soil environment. It has five distinct exons, relative to nucleotide position 7021 according to the NCBI database. These regions are 3156-3267, 4756-5085, 6342-6605, 7693-7872, and 9483-9833.[32] AF009962 is the accession number for single exon, which has one coding region at position 3934-4581. The gene sequence AF019074.1 has the length of 6350, which has three distinct exons, 3101-3187, 3761-4574, and 5832-6007. AJ223321.1 is in the HMR195 dataset. This database consists of 195 mammalian sequences with exactly one complete either single-exon or multi-exon gene. All sequences contain exactly one gene, which starts with the ‘ATG’ initial codon and ends with a stop codon (TAA, TAG, or TGA). There is one coding region existed in AJ223321.1 gene sequence, which its location is 1196-2764. All mentioned sequences are converted to numerical sequences using EIIP method.
In this paper, to compare the performance of the proposed algorithm and other tested methods, we used the parameters Sn, Sp and P, which were described in section III. Amounts of these parameters achieved from equation (2). The amounts of TP, FP, TN, and FN are calculated by changing threshold level in range of 0 and 1 with small steps according Figure 7. In this Figure, the value of threshold is 0.161. It can be observed in Figure 7 that if the decision threshold is very high, then there will be almost no false positives, but it won’t be really identified many true positives either.
Figure 7.
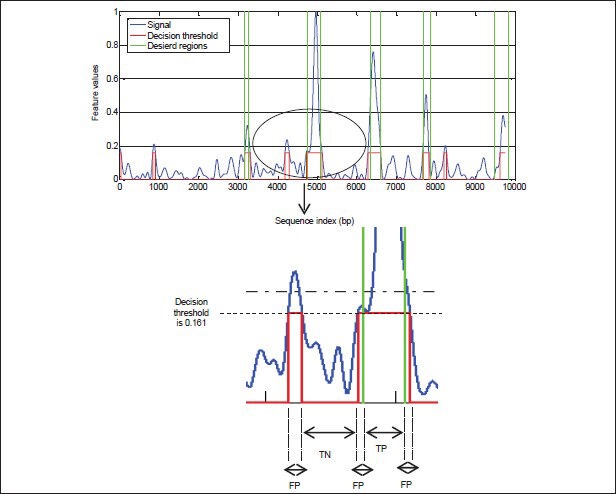
Parameters for exon-intron separation problem
In this paper, to evaluate the performance of the proposed algorithm, DFT[8] and Multi-Stage filter (MS)[33] methods are implemented. Figures 8-11a and b show results of implementation of these methods and the proposed algorithm in identifying protein coding regions in four gene sequences explained above. As can be seen, the accuracy of the DFT method for protein coding regions estimation is not high due to the noise associated with the original signal. However, the MS filter resulted a good spectral component compared to DFT and reduced the computational complexity. Also, the non-coding regions are relatively suppressed in it, but this method cannot recognize the small size exonic regions. As shown in Figures 8-11c, the large amount of noise is removed in the proposed method due to applying the DWT, and small size of exons (For example, first exon in F56F11.4 gene sequence) can be identified because of using the Goertzel algorithm.
Figure 8.
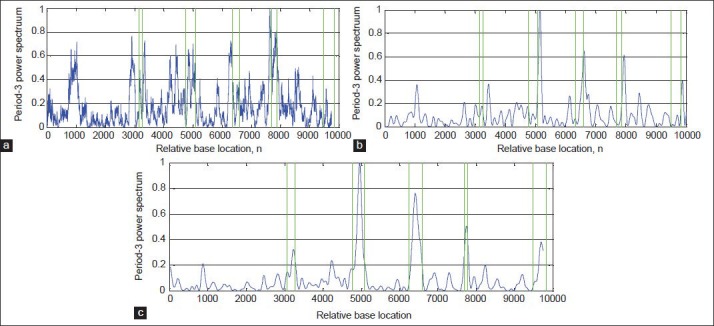
Results of the algorithms for identification of the exonic regions on the gene sequence F56F11.4: (a) DFT, (b) MS-filter, and (c) Proposed algorithm
Figure 11.
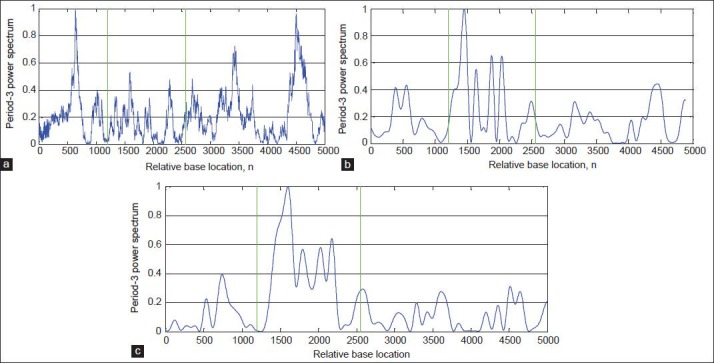
Results of the algorithms for identification of the exonic regions on the gene sequence AJ223321.1: (a) DFT, (b) MS-filter, and (c) Proposed algorithm
Figure 9.
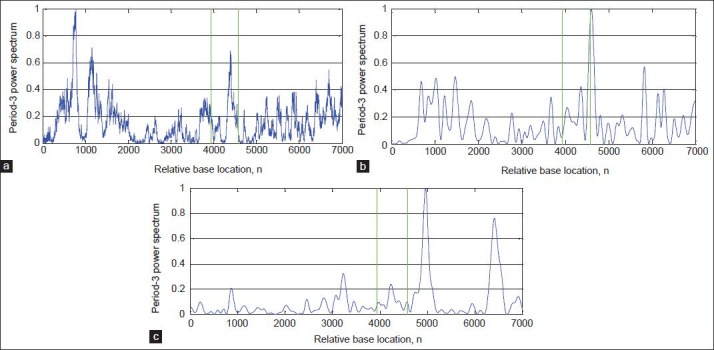
Results of the algorithms for identification of the exonic regions on the gene sequence AF009962: (a) DFT, (b) MS-filter, and (c) Proposed algorithm
Figure 10.
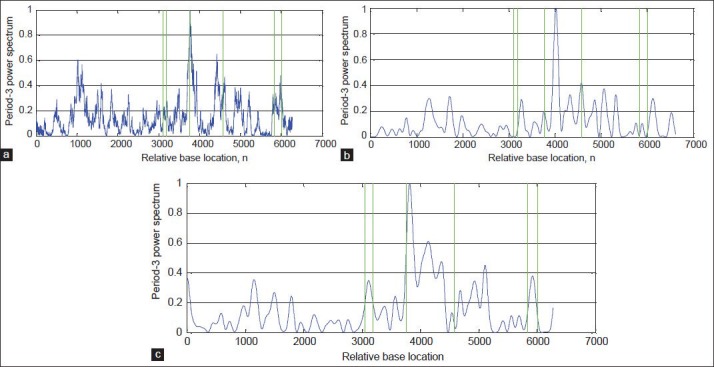
Results of the algorithms for identification of the exonic regions on the gene sequence AF019074.1: (a) DFT, (b) MS-filter, and (c) Proposed algorithm
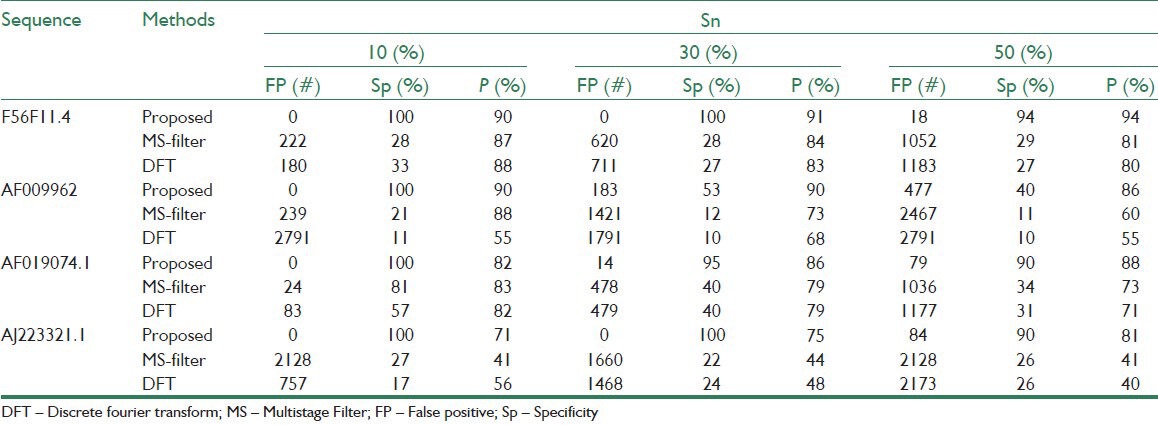
Table 1 shows the estimated exons by methods DFT, MS filter, and the proposed algorithm compared with the locations of exons in a sample gene sequence F56F11.4 from NCBI database. As can be seen, the proposed algorithm result is better than the other methods because of using the Goertzel algorithm. In Table 2, the number of false positive nucleotides, specificity, and precision for specified sensitivities are presented for the proposed and the other tested methods. According to this table, the proposed algorithm has the minimum nucleotides incorrectly identified as exons in all four gene sequences. For example, in F56F11.4, at the sensitivity of 0.5, the number of false positives in the proposed method is 18 bp, while this quantity for MS filter and DFT are 1052 and 1183, respectively. Also, the proposed algorithm shows relative improvement of 11.1% and 12.5% over the MS filter and DFT methods, respectively, in terms of the precision measure in the same gene sequence. Similar results of the proposed algorithm are apparent for the other three gene sequences, which are shown in Table 2.
Table 1.
Comparison of the proposed algorithm and the other methods in determining protein coding regions using F56F11.4 gene sequence

Table 2.
Quantitative evaluation of the algorithms using Genbank datasets
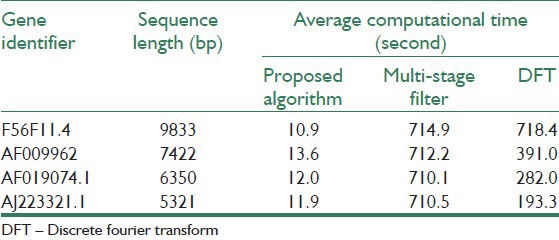
To compare the computational efficiencies of the proposed algorithm and other tested methods, the average CPU time is computed over 1000 runs of the techniques for the four gene sequences. Note that all of the implemented algorithms were run on a PC with a 1.6 GHz processor (Intel (R) Pentium (R) M processor) and 2 GB of RAM. Table 3 summarizes results of the average CPU times. It is observed that the proposed algorithm has improved the average CPU time by the factors of 65.9, 28.7, 23.5, and 16.2 relative to the next-best performing method, DFT in F56F11.4, AF009962, AF019074.1, and AJ223321.1 gene sequences, respectively.
Table 3.
Average computational time of the algorithms
Finally, Figures 12-15 illustrate the ROC's of the algorithms. It is obvious that the proposed algorithm has the highest value of its parameter over the other methods. By way of illustration, the area under the ROC curve is improved by the factors of 1.36, 1.84, 1.38, and 1.83 over the DFT and 2, 1.82, 1.56, and 1.25 over the MS filter methods in F56F11.4, AF009962, AF019074.1, and AJ223321.1 gene sequences, respectively. This implies that the proposed algorithm is superior to the other methods for identifying exonic gene regions.
Figure 12.
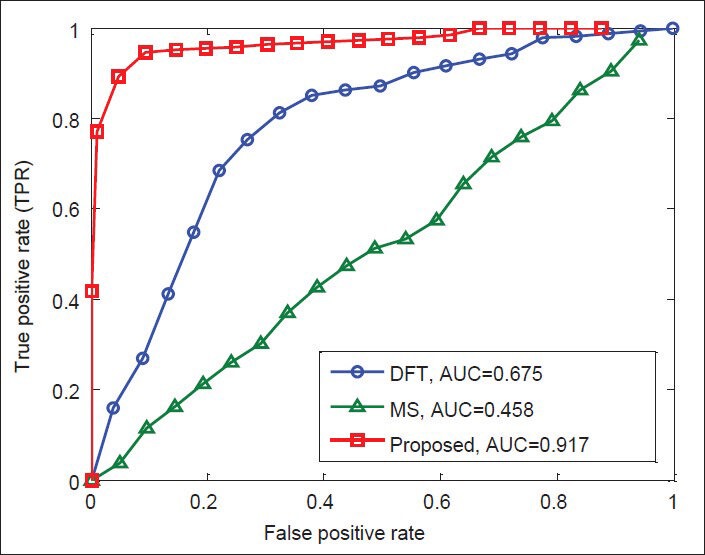
ROC curves of the methods for gene sequence F56F11.4
Figure 15.
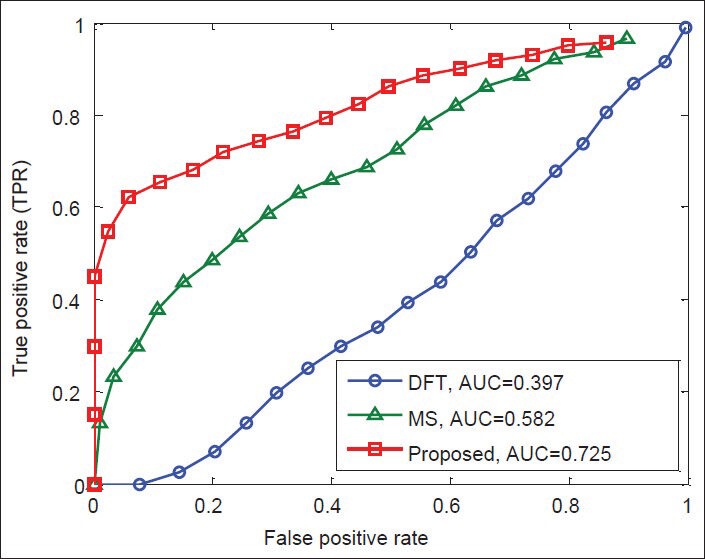
ROC curves of the methods for gene sequence AJ223321.1
Figure 13.
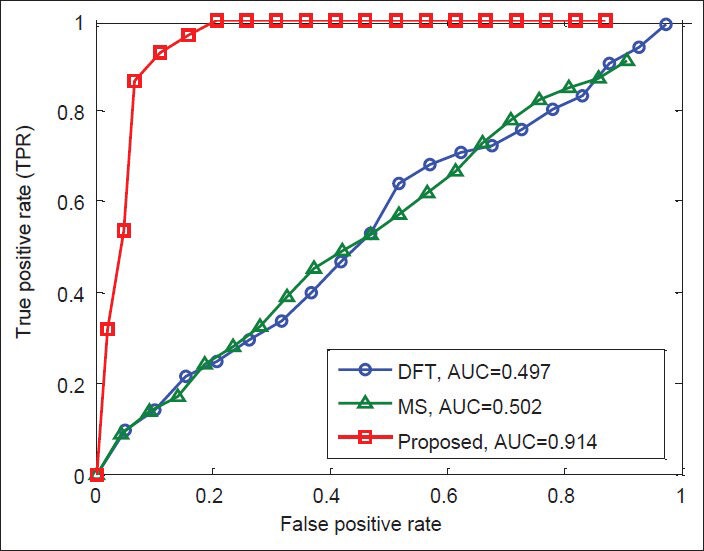
ROC curves of the methods for gene sequence AF009962.
Figure 14.
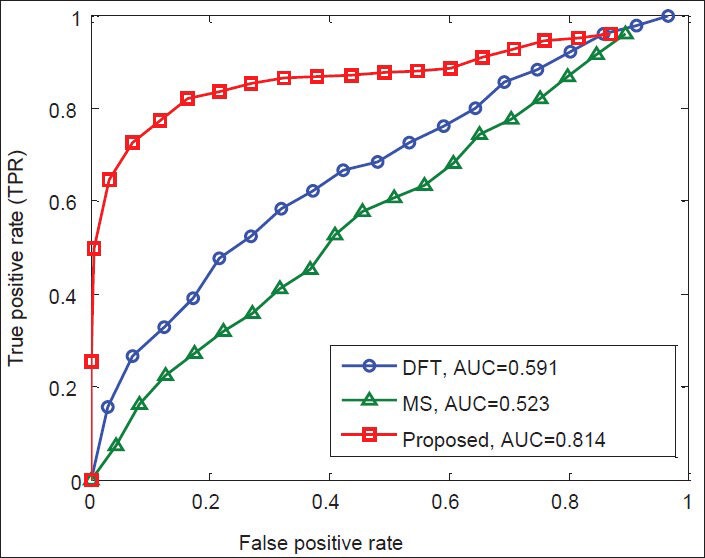
ROC curves of the methods for gene sequence AF019074.1.
CONCLUSION
Gene identification is a complicated problem, and the detection of the period-3 patterns is a first step towards gene and exon prediction. Due to the complex nature of the gene identification problem, we usually need a powerful model that can effectively represent the characteristics of protein-coding regions. Many different DSP techniques have been successfully applied for the identification task, but still improvement in this direction is needed. In this paper, a fast model-independent algorithm is presented for exon detection in DNA sequences. First, EIIP method is used to convert the symbolic sequence into digital signal. Then, we applied discrete wavelet transform to reduce the correlation between the numerical data and, therefore, reduce the high frequency noise. Finally, the Goertzel algorithm was applied to the filtered sequence for the period-3 detection. The proposed algorithm minimizes the number of nucleotides incorrectly predicted as coding regions, which leads to increase the specificity. Also, area under the ROC curve is improved in the proposed algorithm over the other methods. The main advantage of the proposed algorithm is its high speed characteristic, which leads to less run process.
BIOGRAPHIES

Hamidreza Saberkari was born in Rasht, Iran. He received the B.Sc. degree in Electrical Engineering from Guilan University, Rasht, IRAN, in 2011. In 2013, he received his M.Sc. degree in Communication Engineering from Sahand University of Technology, Tabriz, IRAN. Now, he is Ph.D. student in Electrical Engineering at Sahand University of Technology, Tabriz, Iran. His research interests include Bio-MEMS, RF MEMS, RF IC design, genomic signal processing, Bioinformatics, signal processing, pattern recognition.
E-mail: h_saberkari@sut.ac.ir

Mousa Shamsi received his B.Sc. degree in Electrical Engineering (major: electronics) from Tabriz University, Tabriz, IRAN, in 1995. In 1996, he joined the University of Tehran, Tehran, IRAN. He received his M.Sc. degree in Electrical Engineering (major: Biomedical Engineering) from this university in 1999. From 1999 to 2002, he taught as a lecturer at Sahand University of Technology, Tabriz, Iran. From 2002 to 2008, he was a PhD student at the University of Tehran in Bioelectrical Engineering. In 2006, he was granted with the Iranian government scholarship as a visiting researcher at the Ryukyus University, Okinawa, Japan. From December 2006 to May 2008, he was a visiting researcher at this University. He received his PhD degree in Electrical Engineering (major: Biomedical Engineering) from University of Tehran in December 2008. From December 2008 to April 2013, he was an assistant professor at Faculty of Electrical Engineering, Sahand University of Technology, Tabriz, Iran. From April 2013, he is an associate professor at Faculty of Electrical Engineering, Sahand University of Technology, Tabriz, Iran. His research interests include medical image and signal processing, genomic signal processing, pattern recognition, adaptive networks, and facial surgical planning.
E-mail: shamsi@sut.ac.ir

Hamed Heravi was born in Mashad, Iran in 1989. He received the B.Sc. degree in Biomedical Engineering from Sahand University of Technology in 2012. Now, he is M.Sc. student in Communication Engineering at this University. His research interests are Biomedical Signal Processing, Biomedical Image Processing, Machine Vision And Biometrics.
E-mail: h_heravi@sut.ac.ir

Mohammad Hossein Sedaaghi was born in Tehran, Iran. He received the B.Sc. and M.Sc. degrees from the Sharif University of Technology, Tehran, IRAN, in 1986 and 1987, respectively. In 1998, he received the Ph.D. degree from Liverpool University. He is now a professor at Sahand University of Technology, Tabriz. His research interests include signal/image processing, pattern recognition, machine learning and biometrics.
E-mail: sedaaghi@sut.ac.ir
Footnotes
Source of Support: Nil
Conflict of Interest: None declared
REFERENCES
- 1.Snustad DP, Simmons MJ. United States: John Wiley and Sons Inc; 2000. Principles of Genetics. [Google Scholar]
- 2.Dougherty ER, Shnulevich L, Chen J, Wang ZJ. Genomic signal processing and statistics. EURASIP Book Series on Signal Processing and Communications. 2005:2. [Google Scholar]
- 3.Fickett JW, Tung CS. Assessment of protein coding measures. Nucleic Acids Res. 1992;20:6441–50. doi: 10.1093/nar/20.24.6441. [DOI] [PMC free article] [PubMed] [Google Scholar]
- 4.Fickett JW. The gene identification problem: An overview for developers. Comput Chem. 1996;20:103–18. doi: 10.1016/s0097-8485(96)80012-x. [DOI] [PubMed] [Google Scholar]
- 5.Vaidyanathan PP, Yoon BJ. The role of signal-processing concepts in genomics and proteomics. J Franklin Inst. 2004;341:111–35. [Google Scholar]
- 6.Voss RF. Evolution of long-range fractal correlations and 1/f noise in DNA base sequences. Phys Rev Lett. 1992;68:3805–8. doi: 10.1103/PhysRevLett.68.3805. [DOI] [PubMed] [Google Scholar]
- 7.Chatzidimitriou-Dreismann CA, Larhammar D. Long-range correlations in DNA. Nature. 1993;361:213–3. doi: 10.1038/361212b0. [DOI] [PubMed] [Google Scholar]
- 8.Tiwari S, Ramachandran S, Bhattacharya A, Bhattacharya S, Ramaswamy R. Prediction of probable genes by Fourier analysis of genomic sequences. Comput Appl Biosci. 1997;13:263–70. doi: 10.1093/bioinformatics/13.3.263. [DOI] [PubMed] [Google Scholar]
- 9.Saberkari H, Shamsi M, Sedaaghi MH, Golabi F. 2012 IEEE Symposium on Industrial Electronics and Applications (ISIEA 2012) Bandung, Indonesia: 2012. Prediction of protein coding regions in DNA sequences using signal processing methods; pp. 354–9. [Google Scholar]
- 10.Saberkari H, Shamsi M, Sedaaghi MH. Tehran, Iran: 2013. Identification of genomic islands in DNA sequences using a non-DSP technique based on the Z-Curve, 11th Iranian Conference on Intelligent Systems (ICIS 2013) pp. 27–8. [Google Scholar]
- 11.Deng S, Chen Z, Ding G, Li Y. Vol. 9. Yantai: 2010. Prediction of protein coding regions by combining Fourier and wavelet transform, International Conference on Image and Signal processing (ICISP) pp. 4113–7. [Google Scholar]
- 12.Datta S, Asif A. A Fast DFT-based gene prediction algorithm for identification of protein coding regions, Proceedings of the 30th International Conference on Acoustics, Speech, and Signal Processing. 2005 [Google Scholar]
- 13.Akhtar M, Epps J, Ambikairajah E. Signal processing in sequence analysis: Advanced in eukaryotic gene prediction. IEEE J Sel Top Signal Process. 2008;2:310–21. [Google Scholar]
- 14.Haykin S. 4th ed. United States: Prentice Hall Inc; 2001. Adaptive Filter Theory. [Google Scholar]
- 15.Baoshan Ma, Zhu Yi-Sheng. International Conference on Signal Processing Systems (ICSPS 2010) 2nd ed. Vol. 1. Dalian: 2010. Kalman filtering approach for human gene identification; pp. V1-525–V1-528. [Google Scholar]
- 16.Baoshan Ma, Dongdong Qu. Beijing: 2010. A novel adaptive filtering approach for genomic signal processing, IEEE 10th International Conference on Signal Processing (ICSP) pp. 1805–8. [Google Scholar]
- 17.Chakravarthy N, Spanias A, Lasemidis LD, Tsakalis K. Autoregressive modeling and feature analysis of DNA sequence. EURASIP J Appl Signal Processing. 2004;1:13–28. [Google Scholar]
- 18.Cristea PD. Conversion of nucleotides sequences into genomic signals. J Cell Mol Med. 2002;6:279–303. doi: 10.1111/j.1582-4934.2002.tb00196.x. [DOI] [PMC free article] [PubMed] [Google Scholar]
- 19.Cristea PD. San Jose, Calif, USA: 2002. Genetic signal representation and analysis, In SPIE Conference, International Biomedical Optics Symposium, Molecular Analysis and Informatics (BIOS ’02), Vol. 4623 of Proceedings of SPIE; pp. 77–84. [Google Scholar]
- 20.Claverie JM. Computational methods for the identification of genes in vertebrate genomic sequences. Hum Mol Genet. 1997;6:1735–44. doi: 10.1093/hmg/6.10.1735. [DOI] [PubMed] [Google Scholar]
- 21.Doolittle WF. Phylogenetic classification and the universal tree. Science. 1999;284:2124–8. doi: 10.1126/science.284.5423.2124. [DOI] [PubMed] [Google Scholar]
- 22.Cristea PD. San Jose, Calif, USA: Progress in Biomedical Optics and Imaging; 2004. Genomic signals of chromosomes and of concatenated reoriented coding regions, In SPIE Conference, Biomedical Optics (BIOS ’04), Vol. 5. 5322 of Proceedings of SPIE; pp. 29–41. [Google Scholar]
- 23.Zhang R, Zhang CT. Z curves, an intuitive tool for visualizing and analyzing the DNA sequences. J Bioml Struc Dyn. 1994;11:767–82. doi: 10.1080/07391102.1994.10508031. [DOI] [PubMed] [Google Scholar]
- 24.Rao KD, Swamy MN. Analysis of genomics and proteomics using DSP techniques. IEEE Trans Circuits Syst. 2008;55:370–8. [Google Scholar]
- 25.Rabiner LR, Schafer RW. United States: Prentice-Hall Inc; 1987. Digital Processing of Speech Signals. [Google Scholar]
- 26.Braun FQ. Nonrecursive digital filters for detecting multi frequency code signals. IEEE Trans Acoust. 1975;23:250–6. [Google Scholar]
- 27.Koval I, Gara G. Digital MF receiver using discrete Fourier transform. IEEE Tran Commun. 1973;12:1331–5. [Google Scholar]
- 28.Oppenheim AV, Schafer RW. United States: Prentice Hall Inc; 1999. Discrete Time Signal Processing. [Google Scholar]
- 29.Burset M, Guigo R. Evaluation of gene structure prediction programs. Genomics. 1996;34:353–67. doi: 10.1006/geno.1996.0298. [DOI] [PubMed] [Google Scholar]
- 30.Fawcett T. ROC Graphs: Notes and Practical Considerations for Researchers HP Laboratories. 2003:4. [Google Scholar]
- 31.Ramachandran P, Lu WS, Antoniou A. IEEE International Symposium on Circuits and Systems (ISCAS 2010) Paris: 2010. Optimized numerical mapping scheme for filter-based exon location in DNA sing a Quasi-Newton algorithm; pp. 2231–4. [Google Scholar]
- 32.National Center for Biotechnology Information, National Institutes of Health, National Library of Medicine. [Last accessed on 2013 Apr 19]. Available from: http://www.ncbi.nlm.nih.gov/Genebank/index.html .
- 33.Vaidayanathan PP, Yoon BJ. Digital filters for gene prediction applications, Proceeding of the 36th Asilomar Conference on Signals, Systems, and Computers. 2002 [Google Scholar]


