Abstract
Studies show that any complications including hemorrhage, lack of blood supply, lack of oxygen supply and death of cells in a tissue, will have a clear effect on electrical properties of that tissue. Thus, by measuring impedance of a set of tissues, potential problems of the damaged tissue may be found. Since electrical impedance is closely related to the measuring frequency, obviously, every tissue exhibits its own specific impedance according to its electrical properties at each frequency. This research project investigates design and manufacture method of a device for measuring tissue impedance at different frequencies. To this end, design of a multi frequency sinusoidal current source is required. This current source is built using a single harmonic Generator sample (Direct Digital Synthesizer AD9835) with working frequency (design-point frequency) between 1 Hz and 10 MHz and accuracy of 1 Hz and microcontroller (PIC16F628) capability. For measurement and display of tissue impedance, ARM AT91SAMs256 microcontroller was used. Thus, with this hardware created, it shows that there are significant impedance changes between mouse tissues.
Keywords: Bioimpedance, spectroscopy, live tissue impedance
INTRODUCTION
It has been nearly 60 years that the use of electrical impedance of living tissue has played an extensive role in medical technology, physiological research and also in clinical diagnosis.[1] The first application of electrical impedance was in examination of myocardial function by Nyboer et al.[2] Phillipson used a capacitor and an electrical resistance to simulate living tissue with a model of impedance.[3] Afterward, Fricke and Morse, using advanced instruments, were able to measure electrical conductivity of the tissue and explain the results obtained via Maxwell's theory.[3] Concurrently, Cole discovered an empirical equation that could describe electrical impedance property of tissues. This description was compatible with the nature of impedance frequency as well as measured data by Fricke and Morse.[3] In the recent 20 years, measurement of electrical impedance of tissues has had applications even in medical imaging.[4] Electrical impedance medical imaging highly enhances clinical diagnosis capacity.[4] This method of imaging requires hardware design as well as algorithms for reconstruction of complex images.[4] Various researches and many clinical studies have been conducted using bioimpedance imaging in neurology, including investigation of lack of blood supply to the brain using bioimpedance,[5,6,7] and “The effect of depression and its spread in the brain,”[8,9] “Epilepsy and its progress in the brain tissue.”[9,10,11] Currently, living tissue electrical impedance has applications in many branches of medicine such as various respiratory observations, body part distinction and their percentages and skin cancer diagnosis.[1]
The rest of this paper is organized as follows. In Section 2, living tissue modeling with circuit elements, in Section 3, bioimpedance measurement device, in Section 4, result of testing bioimpedance device by measuring impedance in a mouse.
LIVING TISSUE MODELING WITH CIRCUIT ELEMENTS
Since extracellular and intracellular fluids (cytoplasm) have ions with electric charge migration capability; thus, they are electrolytes.[1] Therefore, electric current in biological tissue is transferred through binding to ions or transmission of free ions. Application of an external electric field to a tissue causes increased transmission of free ions and consequently, increases the passing current. The range of this passing current is determined through the level of concentration and agitation of free ions and is introduced as intrinsic conductivity σ.[1,3] In addition to intra/extra cellular fluids; each cell has a membrane that separates it from its surrounding space. This membrane is made of lipids and proteins and has very poor electrical conductivity, so it is referred to as “dielectric.”[1]
If the applied voltage is sinusoidal with a maximum range V, then, the passing current will be found using Eq. 1;

As discussed above, in addition to free ions, electric current is also conducted through binding to complex proteins. This component of current depends on the frequency of the applied field to the tissue and is directly proportional to it and is referred to as intrinsic permittivity of tissue εr,[3] with sinusoidal electric field, maximum range V and electric permittivity in vacuum, Eq. 2:

In Figure 1, the relationship between these components of current with frequency is shown.
Figure 1.
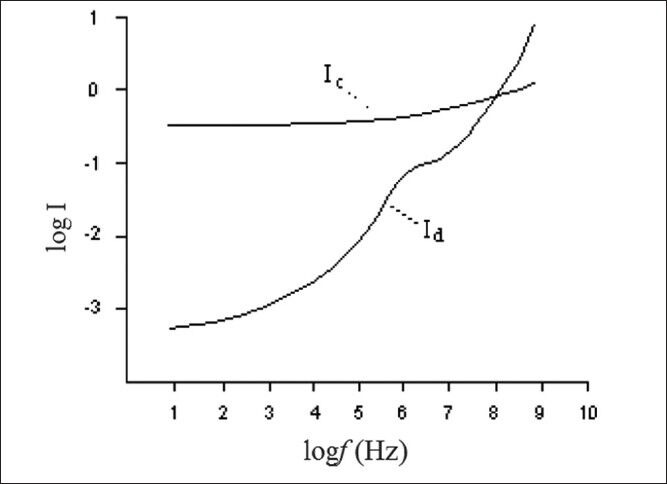
Show the relationship frequency and current due to free ions (Ic) and binding protein complex (Id)[3]
Therefore, according to Figure 1, at high frequencies, current mostly passes through the cells and low frequencies mostly through the space between cells.[3] Each polar set within a tissue has a specific behavior at each frequency according to its dielectric response. This is a first degree response and in Fourier domain, it is expressed as in Eq. 3;[1]

where ε∞ is electric permittivity at infinite frequency εs is maximum permittivity at low frequency and ω is the angular frequency and τ is the dielectric rest time.[3] Based on Figure 1 and the above equation, three distinct areas (σ, β and χ) in impedance frequency distribution can be seen in Figure 2. Table 1 presents different types of bio molecules specific to each area (σ, β and χ). In Figure 3, extracellular space has been shown with resistance Re, intracellular space with Ri, capacitor property of membrane with Cm, and resistance of this area with Rm.
Figure 2.
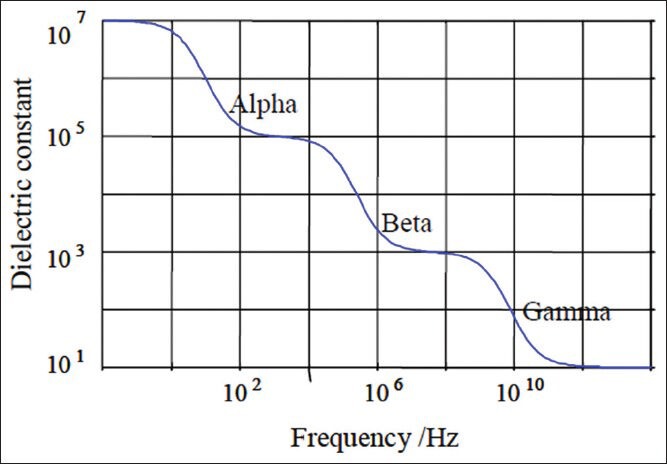
Decrease in dielectric constant with frequency[3]
Table 1.
Presents different types of bio molecules specific to each area of impedance frequency
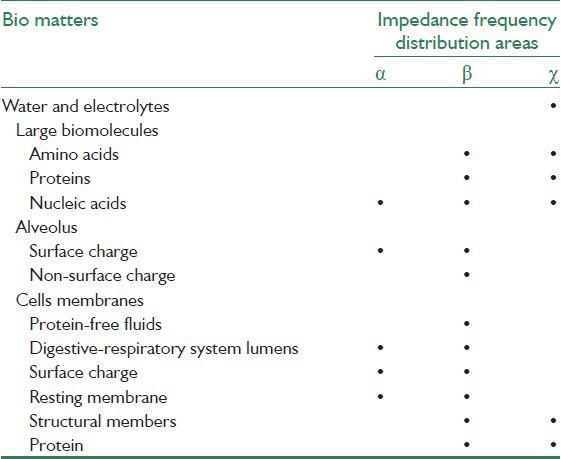
Figure 3.
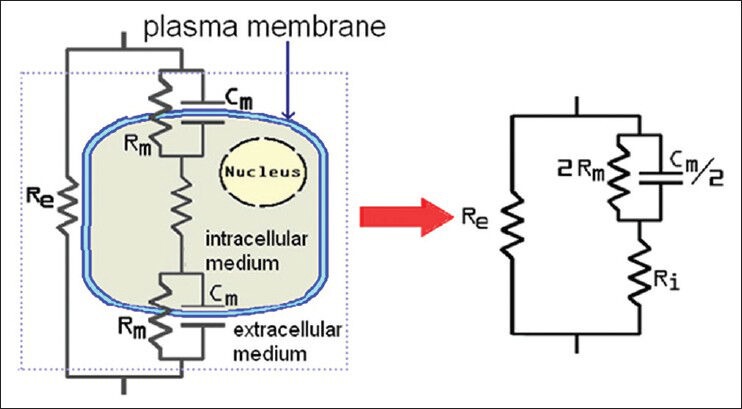
A cell equivalent circuit[1]
BIOIMPEDANCE MEASUREMENT DEVICE
It can be seen from Figure 4 that electrical impedance measuring device consists of various parts including a current source with a signal generator making the waveform, linking electrodes between electronic circuitry current and ion flow in the body and a differential amplifier that amplifies minor voltages collected from tissue.[3]
Figure 4.

General design of bioimpedance measuring device[3]
Current Source
According to Frick and Morris, impedance is a highly dependent on the applied current frequency. Thus, a constant current source is needed to ensure detection of the each smallest effect of tissue impedance on the current supply. The ideal current source is a source with near zero output impedance. This wave is sinusoidal and to reduce common mode voltage, it must be symmetrical with earth and its offset voltage must be zero. For this purpose, this current source is built using the Direct Digital Synthesizer (DDS) AD9835 and a voltage/current converter. Current source building methods are based on (1) using current mirror, (2) using Op-Amp and (3) improved current source known as Howland circuit. In this study, Howland circuit current source was used [Figure 5].
Figure 5.
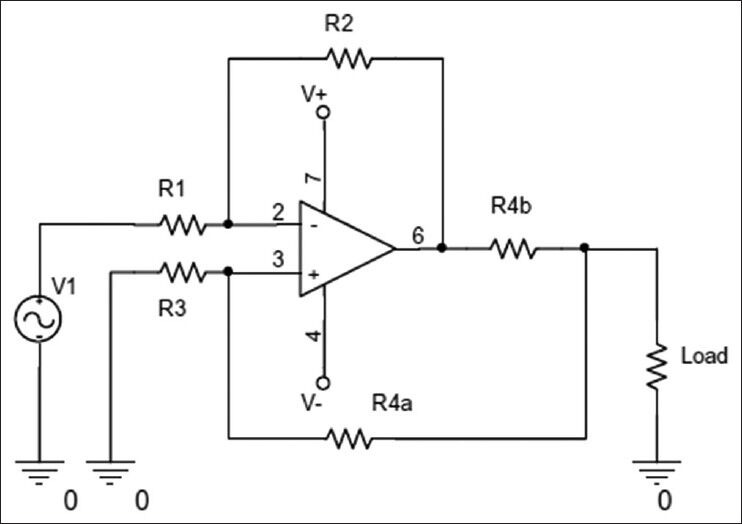
Howland circuit current source
The output current from this source is calculated using Eq. 4;

The load current is found using input voltage and R2/R1 ratio, with R4b as the feedback resistance from output current. Hence, output current is independent from the load resistance in this design, as indicated in Eq. 5;

The value of the resistances are found using Eq. 6;

To build a current source with 1 mA current, parameters of the circuit shown in Figure 5 were designed according to Table 2 (it should be noted that this circuit requires Op-Amps with high frequency response capability, such as LF351 and LM833. LF351 was used in the circuit built in this project). In the practical experiments, circuit frequency range of approximately 20 MHz was measured. To achieve perfection, an Op-Amp buffer was used in the circuit.
Table 2.
Resistor values designed for implementing voltage to current converter

Designing and Implementing a DDS with AD9835
Have the ability of creating the frequency range of 1 Hz to 10 MHz with 1 Hz step and with constant output at any frequency over time, is the main purpose of implementing DDS. AD9835 element, with receiving 50 MHz input clock, is able to produce sinusoidal signals frequencies up to 25 MHz. At the higher frequencies, due to problems in signal amplification and printed circuit board (PCB) design, working range has been limited to 10 MHz. Figure 6 shows schematic of the circuit designed for this purpose. In this schematic, unit 2 represents PIC 16F628 microcontroller. The reasons for using this particular type of controller were the ability to easily adapt to AD9835, uniform baud rate in sending and receiving data, also the 4 MHz internal oscillator crystal and internal EEPROM to control AD9835. The U4 unit in the diagram represents a 50 MHz crystal oscillator for generating input clock to AD9835.
Figure 6.
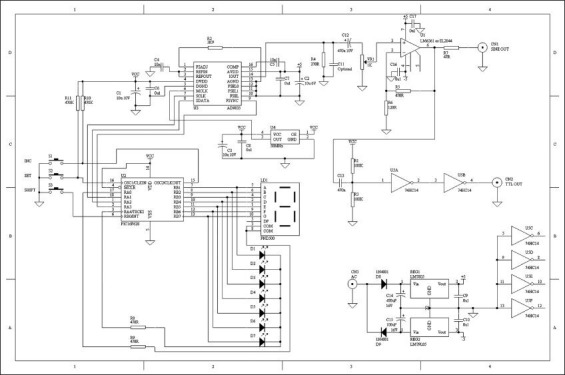
Schematic of designed direct digital synthesizer
AD9835 requires at least one 32-bit code to generate the corresponding frequency. This code must be entered into FRQ0 register. Hence, the microcontroller must first receive required frequency by the user and convert it into corresponding 32-bit code, then, transmit it through SPI link to FRQ0 register in AD 9835.
Corresponding code to each frequency is calculated using Eq. 7;

Produced frequency resolution accuracy of this equation is approximately 12 mHz.
After receiving the code, AD9835 begins to generate a sinusoidal current signal. This IC produces a maximum current of 3.8 mA, which is converted into voltage at R4 resistance. At this stage, high frequency noise is eliminated by a capacitor. It is then connected to an amplifier, using a C12 coupling capacitor. Level of the signal sent to the amplifier is decided by VR1 potentiometer. Amplification coefficient of the designed amplifier is 4.9, which can be regulated by R5 and R6 resistances. Given these regulations, a signal with maximum output range of ± 2.5 V. Resistance R7 increases the very low output resistance of the amplifier to 50 Ω output impedance.
On the board, there are three keys named Inc., Set and Shift that help determine output voltage frequency. Shift button has been installed to generate frequency steps as follows; 1 Hz, 10 Hz, 1 KHz, 10 KHz, 100 KHz, and 1 MHz.
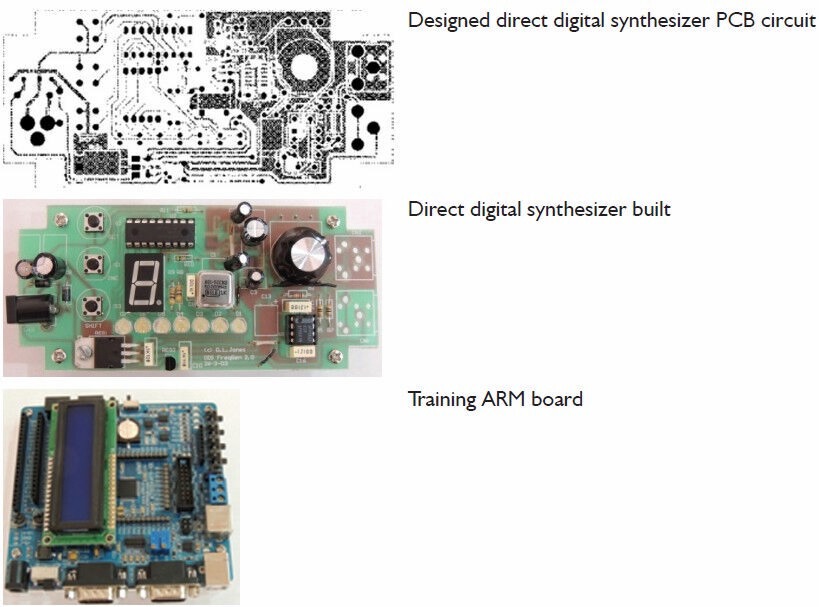
In each range, by pressing INC key, one unit is added to the initial value and SET key transmits the 32-bit code to AD9835. In appendix can find Printed Circuit Board (PCB) and built Direct digital synthesizer (DDS).
Appendix.
Electrodes
In most bioimpedance applications, connecting electrodes are composed of Ag/AgCl. In the inner body applications, silver chloride electrodes are not suitable due to their toxicity and must be replaced by metals with low tendency to dissolve such as gold or platinum. The main problem with electrodes in measuring bioimpedance is high impedance of electrodes and between electrodes and tissue surface (normally skin). The resultant impedance is much higher than the impedance of the tissue being measured. To solve this problem, electrodes with larger cross-sections are used. Furthermore, to reduce the impedance between electrodes and tissue, a 4-electrode system is used (2 electrodes for stimulant and 2 electrodes to record stimulant). Older systems were two-electrode systems, where one electrode was used for application of current stimulation and the other for recording voltage. With electrodes designed in an array, the distance between electrodes will be an important to influencing parameter in control system sensitivity in different depths in tissues and also in the measured electrical conductivity.[3] Different methods of placing electrodes with names and diagrams are presented in Table 3.[12,13]
Table 3.
Methods of placing electrodes
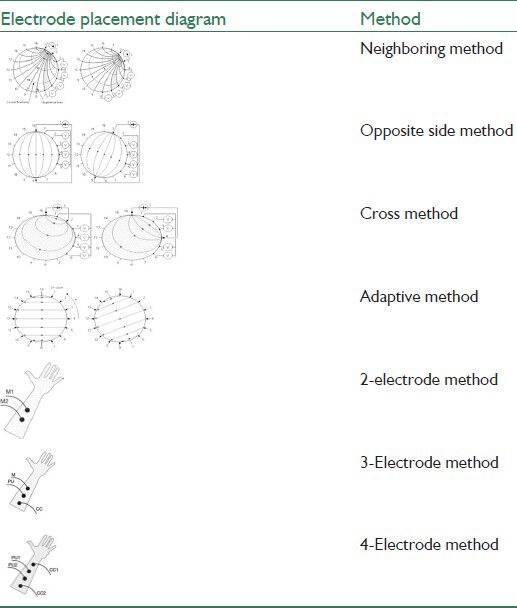
The first four 16-electrode methods in Table 3 are generally used in imaging of electric impedance, isolated tissue and phantom,[12] while methods with 2, 3 and 5 electrodes are mostly used in measuring bioimpedance spectroscopy.[13] In this study, 4-electrode method was used.
Differential Amplifier
Patient's safety considerations in bioimpedance measuring systems compels the designer to keep the applied current range as low as possible (maximum a few mA) as the stimulus. This low current range creates very low voltage in the tissue. According to British standards BS 5724, maximum allowable current applied to the body is 100 μA at 1 KHz frequency and maximum of 10 mA at higher frequencies. Therefore, differential amplifier must increase the measured voltage created through this stimulant (normally only a few mV) so that the amplifier output voltage will be compatible with impedance of the tissue being measured. The most important problem in a bioimpedance measuring system's differential amplifier is the Common Mode Rejection Ratio. To increase this ratio in the amplifier, applied current to the tissue must be attempted to be in symmetry with the earth and be without any common mode. Moreover, the amplifier input impedance compared with the impedance between the electrode and tissue must be significantly higher to neutralized its effect to an acceptable level. Furthermore, in terms of frequency, the amplifier must be designed within the current source (applied to tissue) frequency range.[3]
Demodulator
Obviously impedance of every tissue consists of a real part (Resistive) and a virtual part (Reactive). Hence, the amplifier measured output voltage will be in a mixed form, of which, usually only the real part and signal phase are important. To measure signal phase, it is necessary that the current source should act concurrently (Synchronic) with demodulator. To that end a training board with ARM AT91 SAMS256 processor has been used.
RESULT OF TESTING BIOIMPEDANCE DEVICE BY MEASURING IMPEDANCE IN A MOUSE TISSUE
Figure 7 shows general flowchart of proposed multi-frequency current source for measurement of bioimpedance. In order to show the ability of our device in measuring the impedance, the tissues of a healthy mouse was investigated [Figure 8]. Figures 9-12 show the result of testing bioimpedance for Gastrocnemius muscle, Skin, liver and Heart tissues. All of this measurement was repeated 5 times for each frequency. In Figure 9, the value of the heart impedance was practically noting between 10 HZ and 300 HZ. From this part onwards, impedance reached a peak of 0.200 at 700 Hz. The value of the liver impedance was reported with a sharp rising trend. This measuring was followed by value of the Gastrocnemius muscle impedance in Figure 11 with two exceptions. Value of the skin impedance does not show any steady trend.
Figure 7.
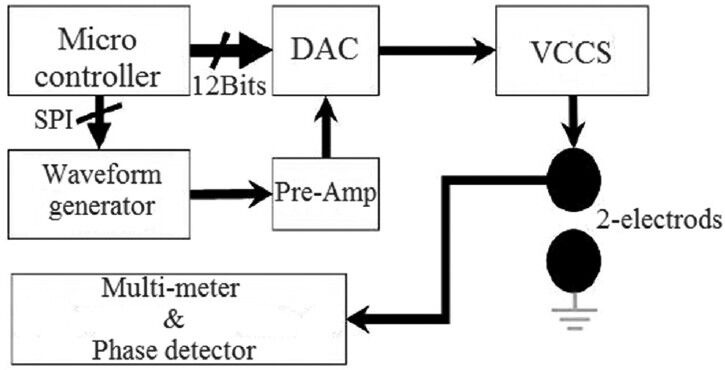
Proposed design block diagram[14]
Figure 8.
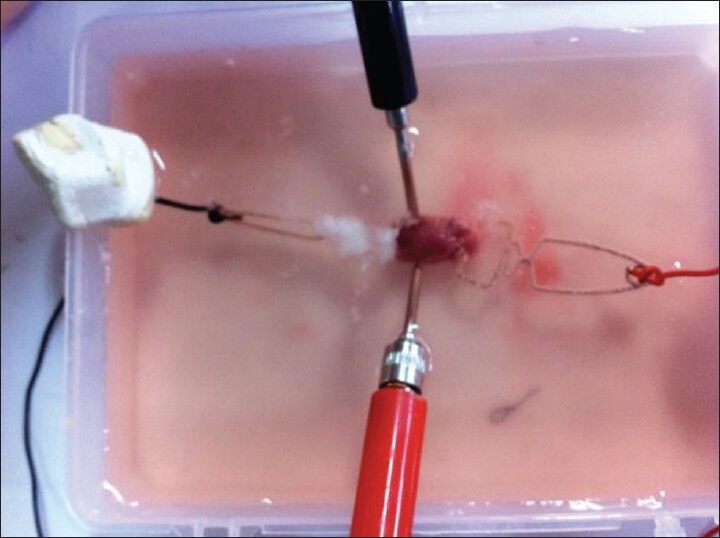
Measuring the impedance of, tissues of a healthy mouse was investigated
Figure 9.
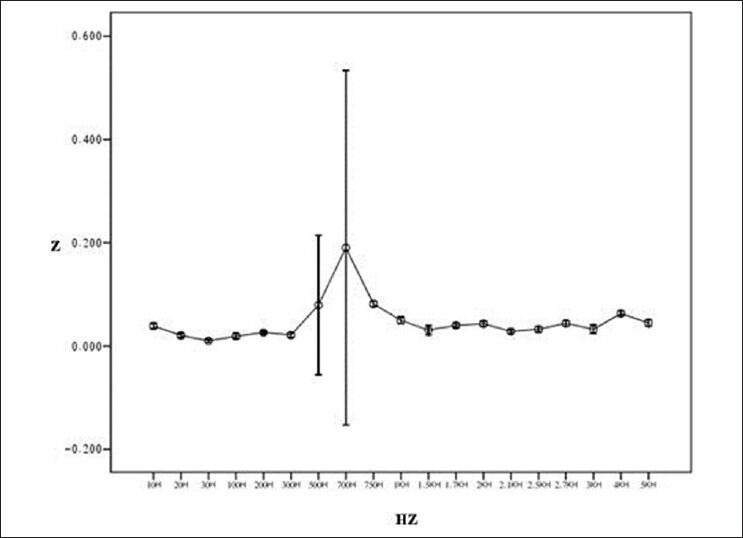
Result of testing bioimpedance device by measuring impedance in heart (length of tissue: 1.5 cm)
Figure 12.
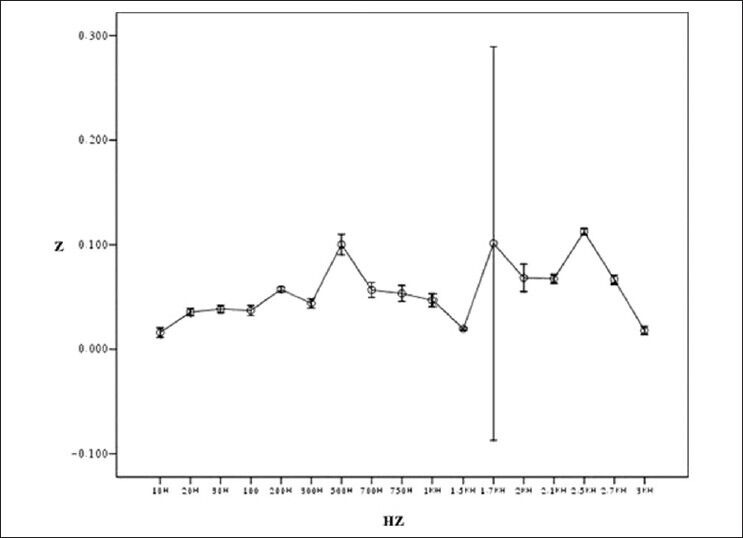
Result of testing bioimpedance device by measuring impedance in skin (length of tissue: 2.38 cm)
Figure 11.
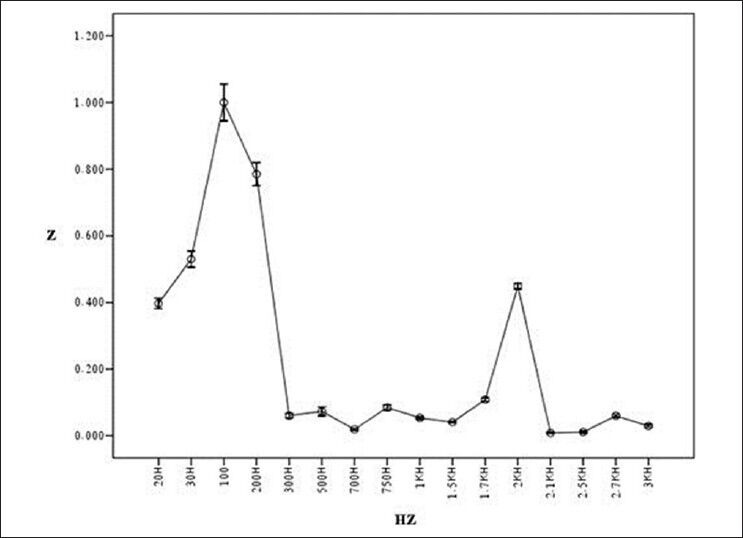
Result of testing bioimpedance device by measuring impedance in Gastrocnemius (length of muscle: 1.65 cm)
Figure 10.
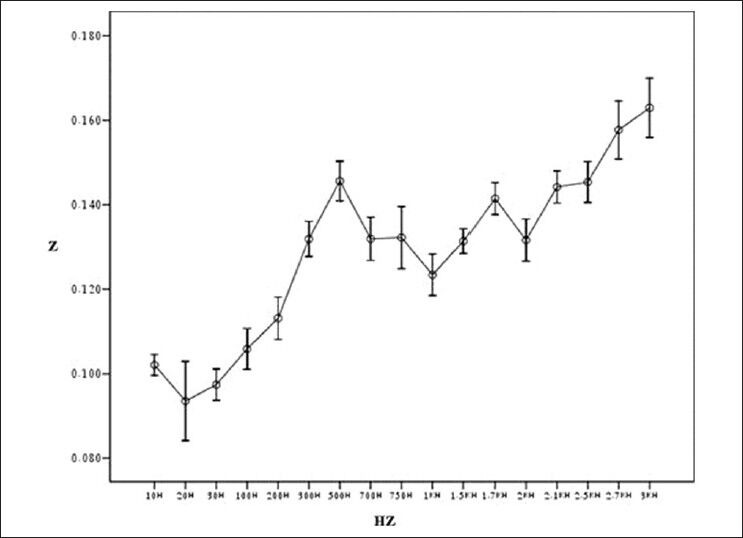
Result of testing bioimpedance device by measuring impedance in liver (length of tissue: 2.25 cm)
CONCLUSION
In this study, we have measured impedance in a mouse living tissue and it shows that there are significant impedance changes between tissues. The changes can explain by electrical model of molecule [Figure 3]. In Table 1, it is shown impedance in living tissue depended with two parameters: distribution areas and frequency domain.
To begin with, it is the responsibility of the manufacturers to inform and educate physicians about the technology and application of these systems. Certainly, these results will be highly important to physicians to know how a simple electric current can make available to them such a vast amount of information and help in finding answers to diagnostic questions. However, this device does not produce much information about anatomy, but it offers benefits of being portable, inexpensive, non-invasive and also, capable of repeated, continuous and simultaneous measurements. It would be impossible to recommend new methods in this area without knowing physician's requirements. Thus, interactions between these two groups in relation to needs and strategies will be very useful in reducing this gap.[15] Performance of an impedance spectroscopy device depends on the current source output impedance, output signal to noise ratio, linearity of the system, adaptive power to transmit maximum signal to tissue and other parameters. Currently, work is being done on current sources that apply current stimulants to increase output impedance, reduce harmonic frequency damage and increase number of electrodes. Furthermore, work on the main system processors to increase speed of the procedure, reduce system noise, increase safety of the device and ultimately, isolation of feeding sources, are hardware approaches that should be considered in achieving this goal. In software terms, it is important to apply reconstruction methods in noise-resistant images and also, suitable interpolation techniques that increase the image spatial resolution.
It is worth noting that in this method, due to ignoring magnetic fields created at current application time, image reconstruction through data obtained from measuring bioimpedance will be impossible. This problem will affect the quality of the image and its resolution. Thus, to solve this problem, a new method of measuring impedance in the magnetic field is used, which is a combined impedance measurement and magnetic resonance imaging method as known as MREIT.[16]
BIOGRAPHIES

Houman Mirzaalian Dastjerdi B.Sc. in Electrical Engineering (Electronics), Isfahan University, Isfahan, Iran
E-mail: hooman.mirzaalian@gmail.com

Ramin Soltanzadeh is B.Sc. and M.Sc. from Shahed University of Tehran and Medical University of Isfahan, respectively, both in Biomedical Engineering. His research background is medical imaging and signal processing. He is now a PhD candidate (as of Sept. 2013) at Biomedical Engineering of the U of Manitoba, working on Sleep Apnea.
E-mail: ramin.soltan9898@gmail.com

Hossein Rabbani is Associate Professor, Department of Biomedical Engineering, Isfahan University of Medical Sciences & Medical Image & Signal Processing Research Center, Isfahan, Iran.
E-mail: h_rabbani@med.mui.ac.ir
Footnotes
Source of Support: Nil
Conflict of Interest: None declared
REFERENCES
- 1.Martinez FS. Electrical bio impedance cerebral monitoring. Ph.D. Thesis. Sweden School of Engineering University College of Boras. 2007 [Google Scholar]
- 2.Nyboer J, Bango S, Barnett A, Halsey RH. Radiocardiograms: Electrical impedance changes of the heart in relation to electrocardiograms and heart sounds. J Clin Invest. 1940;19:773. [Google Scholar]
- 3.Walker DC. England: University of Sheffield; 2001. Modelling the Electrical Properties of Cervical Epithelium. Ph.D. Thesis. [Google Scholar]
- 4.Kolehmainen V. Kuopio University Publications C. Natural and Environmental Sciences: Kuopio University Publications; 2001. Novel Approaches to Image Reconstruction in Diffusion Tomography. Ph.D. Thesis. [Google Scholar]
- 5.Williams CE, Gunn A, Gluckman PD. Time course of intracellular edema and epileptiform activity following prenatal cerebral ischemia in sheep. Stroke. 1991;22:516–21. doi: 10.1161/01.str.22.4.516. [DOI] [PubMed] [Google Scholar]
- 6.Holder DS. Detection of cerebral ischaemia in the anaesthetised rat by impedance measurement with scalp electrodes: Implications for non-invasive imaging of stroke by electrical impedance tomography. Clin Phys Physiol Meas. 1992;13:63–75. doi: 10.1088/0143-0815/13/1/006. [DOI] [PubMed] [Google Scholar]
- 7.Seoane F, Lindecrantz K, Olsson T, Kjellmer I. Gdansk, Poland: IOP Publishing; 2004. Bioelectrical impedance during hypoxic cell swelling: Modeling of tissue as a suspension of cells. Paper Presented at the Conference Proceedings-XII International Conference on Electrical Bio-Impedance, Jun 20-24, 2004. [Google Scholar]
- 8.Holder DS. Detection of cortical spreading depression in the anaesthetised rat by impedance measurement with scalp electrodes: Implications for non-invasive imaging of the brain with electrical impedance tomography. Clin Phys Physiol Meas. 1992;13:77–86. doi: 10.1088/0143-0815/13/1/007. [DOI] [PubMed] [Google Scholar]
- 9.Olsson T, Broberg M, Pope KJ, Wallace A, Mackenzie L, Blomstrand F, et al. Cell swelling, seizures and spreading depression: An impedance study. Neuroscience. 2006;140:505–15. doi: 10.1016/j.neuroscience.2006.02.034. [DOI] [PubMed] [Google Scholar]
- 10.Cusick G, Holder D, Birkett A, Boone K. A system for impedance imaging of epilepsy in ambulatory human subjects. Innov Technol Biol Med. 1994;15:40–6. [Google Scholar]
- 11.Rao A. London: Univ College London; 2000. Electrical impedance tomography of brain activity: Studies into its accuracy and physiological mechanisms. [Google Scholar]
- 12.Doldurucu A. Biomedical imaging systems, term project. Istanbul technical University. 2008 [Google Scholar]
- 13.Grimnes S, Martinsen OG. Norway: University of Oslo, John Wiley; 2006. Bioimpedance. [Google Scholar]
- 14.Cheng KS, Cheng YC, Huang MW, Chen CH. A Multi-Frequency Current Source for Bioimpedance Application. National Science Council under Grant NSC94-2213-E006-085. Institute of Physics Publishing; Cheng Kung University. 2005 [Google Scholar]
- 15.de Vries PM. Vol. 17. Springer Berlin Heidelberg; 2007. What separates us from turning EIC and EIT into successful clinical bed-side instruments? ICEBI 2007, IFMBE Proceedings; p. 3. [Google Scholar]
- 16.Woo EJ. Vol. 17. Springer Berlin Heidelberg; 2007. New techniques in impedance imaging: MFEIT and MREIT. ICEBI 2007, IFMBE Proceedings; p. 2. [Google Scholar]


