Abstract
Background:
Lack of clinical tests to quantify spatial components of distortion in patients with full thickness macular holes (FTMH) and epiretinal membranes (ERM).
Aim:
To develop a test for subjective evaluation of visual distortion in the central visual field around fixation in patients with unilateral FTMH or ERM.
Settings and Design:
Prospective case-control study carried out at tertiary referral center.
Materials and Methods:
Twenty-five patients with unilateral macular disease (13 macular epiretinal membranes, 12 full-thickness macular holes), and nine controls (without ocular pathology) underwent ophthalmological examination with logMAR ETDRS visual acuity, near vision and contrast sensitivity assessed. Macular optical coherence tomography and metamorphopsia assessment using Morphision test was also carried out. This test consists of a set of modified Amsler charts for detection, identification, and subjective quantification of visual distortion in the central visual field around fixation. Morphision test content and construct validity, and reliability (test-retest method) were evaluated. Sixteen patients completed an unstructured survey on test performance and preference.
Results:
Every patient with unilateral FTMH or ERM identified a particular chart using Morphision test (content validity). None of the normal subjects without symptoms of metamorphopsia identified any distortion (construct validity). Test-retest showed a 100% consistency for frequency and 67% for amplitude. The mean amplitude difference between measurements was 0.02 degrees (SD = 0.038). The coefficient of repeatability was 0.075. There was a correlation between Morphision amplitude score and visual acuity and contrast sensitivity, individually.
Conclusions:
Morphision test allowed detection and subjective quantification of metamorphopsia in the clinical setting in our patients with unilateral macular epiretinal membranes and full thickness macular holes.
Keywords: Distortion, epiretinal membrane, macular hole, metamorphopsia, morphision
Metamorphopsia (i.e., visual distortion) is thought to result from displacement of photoreceptors and/or visual cortex re-organization and perceptual adjustment following disruption of sensory input from the retina in macula diseases.[1,2,3,4,5,6,7] Although standard Amsler charts[8] or modifications[1,9,10,11,12,13] can detect metamorphopsia qualitatively, there are many unanswered questions, including the pattern of distortion, the relationship with other macular function indexes, the value of quantification in the assessment of disease severity. Some aspects have been quantified with other methods. A modified version of the New Aniseikonia test measures dysmetropsia or disordered size perception.[14,15] M-CHARTS determines the minimum visual angle of a dotted line for distortion detection,[9,16] PreView PHP™ assesses misalignments in central and paracentral fields using hyperacuity.[17] Sine Amsler charts (SAC) evaluate the metamorphopsia amplitude.[1] However, no methods are currently available to quantify both spatial frequency and amplitude components of perceived distortion. The purpose of this study was to develop a subjective evaluation test (Morphision) of visual distortion in the central visual field around fixation in patients with unilateral full thickness macular hole (FTMH) or idiopathic macular epiretinal membranes (ERM).
Morphision is a paper-based test (in the form of an A5 booklet) containing a series of modified Amsler charts with displaced central horizontal and vertical lines, in direct analogy to the technique used to analyze distortion for spatial variation in amplitude.[1] It can be performed completely within 2 minutes. By comparing the perception of images presented separately to the eye with FTMH or ERM and the fellow healthy eye, it allows pattern identification and subjective quantification of distortion in the clinical setting. Patients with unilateral FTMH and ERM were included, as Morphision evaluates distortion by the inter-eye difference in shape perception, when comparing vision of a grid with each eye. The perception of the healthy eye is used as reference. We hypothesized that, by using this test, we could detect, quantify, and monitor visual distortion more accurately; as well as establish whether there was a relationship between the spatial (frequency and amplitude) metamorphopsia patterns and macular functions (i.e., visual acuity, contrast sensitivity).
Materials and Methods
We examined distortion systematically in 25 patients with ERM or FTMH using a newly designed test, Morphision. Twenty-five patients, 13 with unilateral macular ERM (nine women; mean age ± SD, 72 ± 7.5 years), 12 with unilateral FTMH (grade three) (eight women; mean age ± SD, 67 ± 7.8 years) with symptoms of distortion, and nine asymptomatic control observers (seven women; mean ± SD, 41 ± 13.2 years) were included. Clinical details are shown in Table 1. The procedures adhered to the tenets of the Declaration of Helsinki 1995 (as revised in Edinburgh 2000) and were approved by the Local Research Ethics Committee. Informed, written consent was obtained. All subjects completed Morphision test, underwent ophthalmological examinations (logMAR ETDRS visual acuity, near vision with Sussex Vision charts, contrast sensitivity with Pelli-Robson test, slit-lamp biomicroscopy), and macular optical coherence tomography (OCT) (Stratus OCT™, Carl Zeiss Meditec, Inc.) scanning. With on-screen callipers, central foveal thickness (CFT) (from internal limiting membrane to the retinal pigment epithelium), and maximum linear hole width (diameter)[18] and height (highest linear edge on either side of the hole) were measured [Fig. 1]. Ocular dominance was also assessed.[19] Sixteen patients completed an unstructured survey on test performance and preference. (Q1: Which test did you find easier to use, the standard Amsler chart or Morphision?; Q2: Which of these 2 tests is better, in your opinion, to convey your symptoms?).
Table 1.
Clinical details of 13 patients with unilateral ERM and 12 patients with unilateral FTMH included in the study
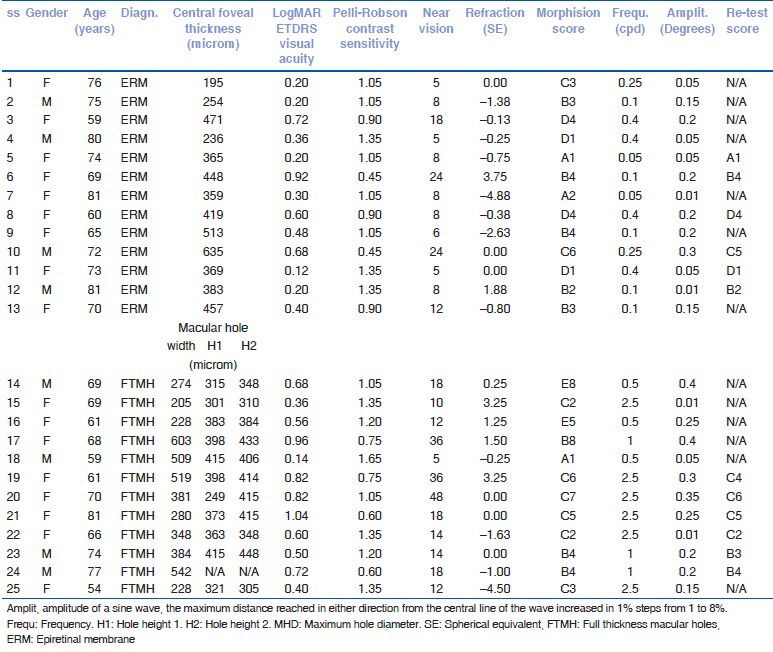
Figure 1.
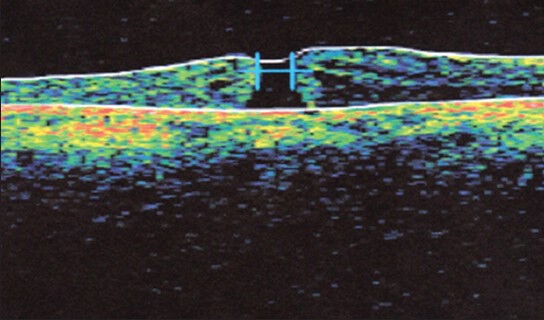
Snapshot showing macular hole width and height measurement on OCT scan using the on-screen calipers
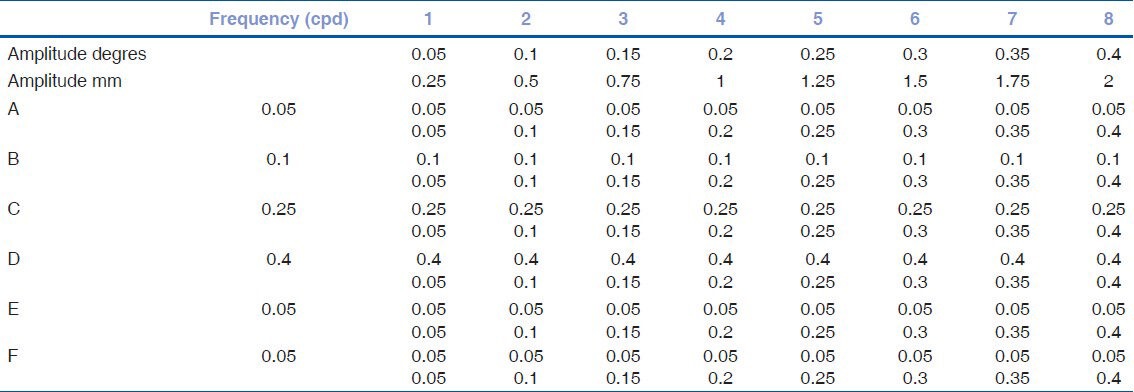
In a preliminary patient-focused study, a separate group of 22 patients with unilateral FTMH or ERM and visual symptoms of distortion were asked to draw and describe shape alterations in images perceived. Patterns described by the majority of patients included “wavy lines” with different frequency and amplitudes, together with pincushion- and barrel-like distortion, mainly affecting 5 degrees around fixation. This assisted us with the design of Morphision test charts with Adobe Illustrator CS3 for Windows (version 13.0.0; Adobe Systems Incorporated, USA) for display on an A5-sized booklet. Morphision consists of a set of 50 modified Amsler charts [Fig. 2]. The control plate (1) allows detection and localization of distortion, the second plate (2) identifies the pattern of distortion, and the remaining 48 plates quantify metamorphopsia [Fig. 2c]. Plate 1 is a modified white Amsler grid (2 mm thick lines) on a black background with external dimensions 10 by 10 cm, comprising 16 individual grid squares (2.5 × 2.5 cm). At 30 cm, the linear measurement of the whole chart corresponds to visual angle of 10 degrees on either side of fixation and 5 degrees for each small square. Plate 2 includes 6 small grids (series A-F) corresponding to the central 4 squares of the chart in plate 1, where the straight lines have been replaced by sine waves of different frequencies, 0.5 (A), 1 (B), 2.5 (C), and 4 (D) cycle per 5 cm, producing distortions at spatial frequencies of 0.05, 0.1, 0.25, and 0.4 cycles per degree (cpd) of visual angle, respectively. A chart representing a cushion- (0.05 cpd) (E) and a barrel-like distortion (0.05 cpd) (F) are also included. These grids give more detailed information regarding the pattern of distortion affecting the foveal area (5 degrees around fixation). The remaining 48 plates are 6 groups (series A-F) of 8 grids each, where the borders of the central 4 squares have the corresponding frequency (A to F from Plate 2) and increasing amplitudes in steps of 0.25 mm (0.05 degrees of visual angle) from chart 1 to 8 [Table 2]. The amplitude of the sine-wave is considered to be the maximum distance reached by the wave in either direction from the central line of the wave.
Figure 2.
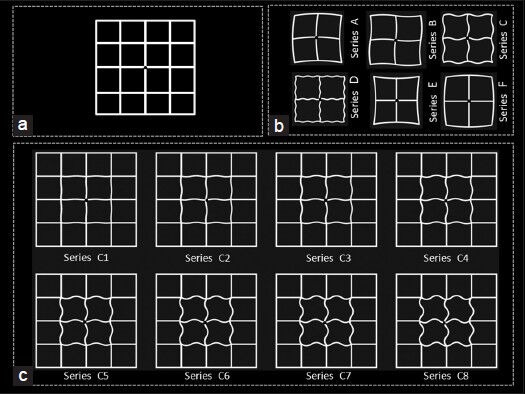
Morphision test. (a) Plate 1 includes a modified Amsler chart consisting of a grid of white lines on a black background with external dimensions of 10 by 10 cm and comprising 16 individual grid squares measuring 2.5 by 2.5 cm. At the center is the fixation point where observers were required to fixate during the presentation of the chart. This plate was used to detect metamorphopsia and localize the area of distortion. (b) Plate 2 includes 4 (A-D) modified Sine Amsler Charts where the straight lines have been replaced by sine curves of different frequencies [half a cycle (A), 1 cycle (B), 2.5 cycles (C), and 4 cycles (D) per 5 cm line], a chart representing a cushion- (E) and a barrel-like (F) distortion. Plates 3-50 consist of 6 groups (series A-F) with 8 charts. (c) shows example of Series C. The plates in individual groups have fixed frequency and increasing amplitudes of distortion in 0.05 degree-steps (from 0.05 to 0.4 degrees) (1-8 plates)
Table 2.
Spatial details of sine-wave lines introducing distortion in modified Amsler grids (in plates 3-50)
The observer looks at the fixation point in the center of the charts at 30 cm, with one eye at a time, with the appropriate correction, for a few seconds. If squares in plate 1 are noticed to contain distortions with the eye with FTMH or ERM (metamorphopsia detection), using the fellow, good-seeing eye, the chart in plate 2 that best corresponds with the distortion is selected (metamorphopsia pattern identification) and subsequently the chart from that particular set (series A-F) with the amplitude that best describes the metamorphopsia observed is chosen. The identical procedure was performed in the control observers on the dominant and non-dominant eyes. For the scoring of the test (metamorphopsia quantification), the frequency and amplitude of the selected plate is recorded.
Correlations between Morphision test score, visual function parameters (distance and near visual acuity, contrast sensitivity), central foveal thickness, and macular hole dimensions were analyzed using SPSS for Windows (version 16.0, SPSS, Chicago, USA). The time taken to complete the test was recorded.
To ensure high quality testing and that Morphision scores can be accurately applied and interpreted, validity (content and construct) and reliability of the test were evaluated. Content validity, the extent to which Morphision measurements reflect the specific perceived distortion and whether all the usual perceived patterns are tapped by the test, was studied by asking 16 (8 with ERM) out of the 25 patients about the representativeness and clarity of distortion detected by the test. Construct validity, the association between the Morphision test scores and the prediction of distortion, was assessed by testing asymptomatic control subjects without macular disease. Reliability, the extent to which the test yields the same results on repeated trials, was evaluated by measuring agreement between repeated measurements[20] recorded 30 minutes apart on 12 patients (6 with ERM) [Table 1]. The coefficient of reliability was calculated as 1.96 times the standard deviation of the differences between the two measurements. Low values of the coefficient of reliability meaning good reproducibility.[21]
Results
Clinical data results can be seen in Table 1. Of 25 patients, 52% had left eye affected (69% of patients with ERM and 33% of those with FTMH) and 36% had their dominant eye affected (15% with ERM and 58% with FTMH). Median duration of symptoms was 11.5 months (range 1-38) in patients with ERM and 4 months (range 1-12) in patients with FTMH. Six patients (24%) were pseudophakic in the affected eye (4 with ERM and 2 with FTMH).
The test was performed within 2 minutes in every patient. The results in Table 1 show that pattern A, B, C, D, and E from plate 2 were selected by 12%, 32%, 32%, 16%, and 8% of the study population, respectively. Regardless of the pattern (spatial frequency) selected, spatial amplitudes chosen ranged from 0.05 to 0.4 degrees. Two of the FTMH subjects selected pin-cushion (E) patterns.
Using an unstructured survey, the judgment of 16 (8 with ERM) of the 25 patients, who performed Morphision test was the first step in assuring content validity. Constructive feedback supported the completeness, accuracy, and achievability of the newly developed test in identifying their distortion. Participants found particularly useful the set of distortions used throughout the booklet and explained that the patterns displayed helped them to focus on central areas of distortion that were causing their symptoms. Eleven out of the 16 patients (69%) found Morphision easier to use than the standard Amsler chart and 13 (81%) felt it communicated better their symptoms of metamorphopsia. Every single patient identified a particular distorted pattern from plate 2 and subsequently a graded chart from that series (content validity). In contrast, none of the normal subjects without symptoms of metamorphopsia identified any distortion on the Morphision reference grid (Plate 1) (construct validity). In the absence of a gold standard, the degree to which Morphision test correlates with other known and validated measures (criterion validity), could not be evaluated in a straightforward manner. One could argue that the view of the target population (patients with symptoms of distortion) is the ultimate criterion against which to measure metamorphopsia test performance at this stage. The sensitivity of the method was 100% using the subjective perception of patients as standard.
Evaluation of repeatability of the distortion measure by test-retest on 12 (6 with ERM) of the 25 patients showed a 100% consistency for spatial frequency and 67% (8 patients) for spatial amplitude. The intra-individual variation of the metamorphopsia amplitude score was within 0.1 degrees. The mean amplitude difference between the first and second measurements for the 12 patients who underwent test-retest evaluation was 0.02 degrees (SD = 0.038). The test-retest method revealed coefficient of repeatability 0.075. The differences between score 1 and 2 were within 2 SD of the mean. The results from Morphision test can, therefore, be considered reproducible and reliable.
The results in Table 1 suggest that subjects with FTMH or ERM perceived distorted images with varying frequency and amplitude (reflected in the Morphision score) in cases where visual acuity and contrast sensitivity estimates were within normal limits. This raises the question whether subjects with loss of acuity or contrast sensitivity have greater distortion and whether this could be because of their poorer stimulus acuity.
The results in Fig. 3a show the visual acuity measure for each patient with subjects arranged in ascending order of visual angle. Fig. 3b and 3c maintain the same subject order for near vision and contrast sensitivity measures, respectively. It is immediately obvious that there is no tight correlation between frequency score and acuity or contrast sensitivity, whereas there is correlation with spatial amplitude [Fig. 3d–f] with Spearman's rank coefficient of correlations (SRCC) of 0.78, 0.73, and -0.40 for distance LogMAR ETDRS visual acuity, near vision, and contrast sensitivity, respectively.
Figure 3.
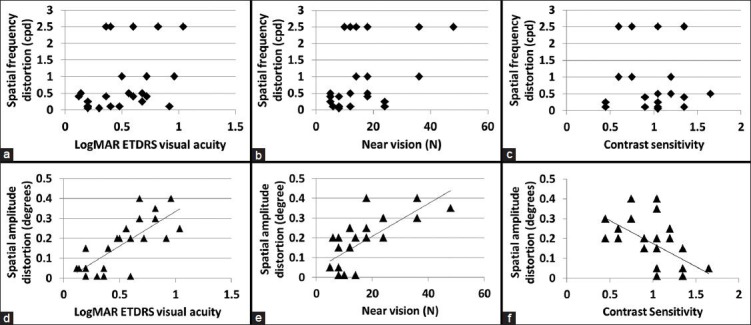
Plots of distance LogMAR ETDRS visual acuity (a), near vision (b), and contrast sensitivity (c) versus spatial frequency distortion (cpd) and LogMAR ETDRS visual acuity (d), near vision (e), and contrast sensitivity (f) versus spatial amplitude distortion (degrees)
Discussion
This paper examined the identification and subjective quantification of spatial (frequency and amplitude) distortions with Morphision test by 13 patients with macular ERM and 12 with FTMH. In pilot studies, the distortion perceived by 22 symptomatic FTMH and ERM patients with metamorphopsia was recorded before introducing distortion in our modified Amsler grids. A number of research groups have employed radial frequency patterns[7,22] to study the perception of periodic structure in certain experimental images. However, it is considered that the sensitivity to visual distortions may be detected more easily with white Amsler grids on a black background due to the high number of edges and uniform, high contrast periodic vertical and horizontal lines.[2] In agreement with this, observers commented that distortions seemed easier to detect when they affected straight lines and seemed less easy to detect on edges that were curved or within texture.
The data identifies key points. Firstly, subjects with symptoms of distortion are able to select Morphision grids that reflect the distortion they see. In contrast, in asymptomatic subjects without FTMH or ERM, no metamorphopsia was detected by the Morphision test suggesting that the pattern of distortion introduced in the Morphision plates must have similarity with the spatial structure perceived by patients with FTMH or ERM. Secondly, our study shows that perception of spatial period and structure of the image undergoing distortion varies. Distortion frequencies set at 0.1 and 0.25 cpd were the most commonly selected. At all distortion frequencies, subjects selected distortion amplitudes ranging from 0.05 to 0.4 degrees. The test-retest analysis shows that subjects could reliably select a pattern of distortion in the squares projecting 5 degrees around fixation. Furthermore, distortion spatial frequencies produced higher repeatability than spatial amplitudes, suggesting that distortion frequency may be a more reliable feature.
Many measures of visual function vary with FTMH or ERM including visual acuity, contrast sensitivity, shape and size discrimination.[14,15] On the assumption that the peak spatial distortion could vary with FTMH or ERM, it was expected that peak sensitivity to spatial amplitude might co-vary with frequency; however, the data provide no evidence to support this. The differences in detection of spatial distortion for frequencies and amplitudes suggest that the spatial structure (photoreceptor) distribution and orientation, and/or cortex re-organization may contribute to different aspects of distortion perception. We did not find any relationship between spatial frequency distortion, visual acuity, contrast sensitivity, or OCT measurements in our patients. Sensitivity to frequency distortion has been suggested to peak around 4 cpd.[2] In the present study, distortion frequencies used included 0.05 to 0.4 cpd, and so, a potential correlation could exist between deficits of macular visual function and distortion at higher frequencies. This hypothesis will need to be tested. Distortion amplitude measurements, on the other hand, showed that eyes with reduced acuity and contrast sensitivity perceived increased amplitude distortion.
The nature of the structural disturbance responsible for frequency and amplitude distortion in FTMH or ERM is not well understood. The suggestion that it could be due to photoreceptor physical misalignment is a possible explanation. Another suggestion is that visual cortex structural changes following removal of afferent information in retinal pathology might result in changes in visual perception. Different factors might affect frequency and amplitude distortion differently.
Morphision test allows detection and subjective quantification of metamorphopsia in the clinical setting in patients with unilateral macular epiretinal membranes and macular holes. The measurements were found to be reliable and reproducible. The use of a reliable and reproducible quantitative method of visual distortion is of great importance for assessing visual symptoms associated with these macular pathologies, progression of disease, and response to therapy in research.
Footnotes
Source of Support: Nil.
Conflict of Interest: None declared.
References
- 1.Bouwens MD, Van Meurs JC. Sine Amsler Charts: A new method for the follow-up of metamorphopsia in patients undergoing macular pucker surgery. Graefes Arch Clin Exp Ophthalmol. 2003;241:89–93. doi: 10.1007/s00417-002-0613-5. [DOI] [PubMed] [Google Scholar]
- 2.Bex PJ. In sensitivity to spatial distortion in natural scenes. J Vis. 2010;10:23.1–15. doi: 10.1167/10.2.23. [DOI] [PMC free article] [PubMed] [Google Scholar]
- 3.Burke W. Psychophysical observations concerned with a foveal lesion (macular hole) Vision Res. 1999;39:2421–7. doi: 10.1016/s0042-6989(98)00323-x. [DOI] [PubMed] [Google Scholar]
- 4.Cohen SY, Lamarque F, Saucet JC, Provent P, Langram C, LeGargasson JF. Filling-in phenomenon in patients with age-related macular degeneration: Differences regarding uni- or bilaterality of central scotoma. Graefes Arch Clin Exp Ophthalmol. 2003;241:785–91. doi: 10.1007/s00417-003-0744-3. [DOI] [PubMed] [Google Scholar]
- 5.Jensen OM, Larsen M. Objective assessment of photoreceptor displacement and metamorphopsia: A study of macular holes. Arch Ophthalmol. 1998;116:1303–6. doi: 10.1001/archopht.116.10.1303. [DOI] [PubMed] [Google Scholar]
- 6.Mansouri B, Hansen BC, Hess RF. Disrupted retinotopic maps in amblyopia. Invest Ophthalmol Vis Sci. 2009;50:3218–25. doi: 10.1167/iovs.08-2914. [DOI] [PubMed] [Google Scholar]
- 7.Zur D, Ullman S. Filling-in of retinal scotomas. Vision Res. 2003;43:971–82. doi: 10.1016/s0042-6989(03)00038-5. [DOI] [PubMed] [Google Scholar]
- 8.Amsler M. Ophthalmologica. 1946;112:51. [PubMed] [Google Scholar]
- 9.Arimura E, Matsumoto C, Okuyama S, Takada S, Hashimoto S, Shimomura Y, et al. Quantification of metamorphopsia in a macular hole patient using M-CHARTS. Acta Ophthalmol Scand. 2007;85:55–9. doi: 10.1111/j.1600-0420.2006.00729.x. [DOI] [PubMed] [Google Scholar]
- 10.Frisen L. The Amsler grid in modern clothes. Br J Ophthalmol. 2009;93:714–6. doi: 10.1136/bjo.2008.149088. [DOI] [PubMed] [Google Scholar]
- 11.Jivrajka RV, Kim JK, Fink W, Sadun AA, Sebag J. Quantitative analysis of central visual field defects in macular edema using three-dimensional computer-automated threshold Amsler grid testing. Graefes Arch Clin Exp Ophthalmol. 2009;247:165–70. doi: 10.1007/s00417-008-0971-8. [DOI] [PubMed] [Google Scholar]
- 12.Matsumoto C, Arimura E, Okuyama S, Takada S, Hashimoto S, Shimomura Y. Quantification of metamorphopsia in patients with epiretinal membranes. Invest Ophthalmol Vis Sci. 2003;44:4012–6. doi: 10.1167/iovs.03-0117. [DOI] [PubMed] [Google Scholar]
- 13.Saito Y, Hirata Y, Hayashi A, Fujikado T, Ohji M, Tano Y. The visual performance and metamorphopsia of patients with macular holes. Arch Ophthalmol. 2000;118:41–6. doi: 10.1001/archopht.118.1.41. [DOI] [PubMed] [Google Scholar]
- 14.Ugarte M, Williamson TH. Horizontal and vertical micropsia following macula-off rhegmatogenous retinal-detachment surgical repair. Graefes Arch Clin Exp Ophthalmol. 2006;244:1545–8. doi: 10.1007/s00417-006-0290-x. [DOI] [PubMed] [Google Scholar]
- 15.Ugarte M, Williamson TH. Aniseikonia associated with epiretinal membranes. Br J Ophthalmol. 2005;89:1576–80. doi: 10.1136/bjo.2005.077164. [DOI] [PMC free article] [PubMed] [Google Scholar]
- 16.Arimura E, Matsumoto C, Nomoto H, Hashimoto S, Takada S, Okuyama S, et al. Correlations between M-CHARTS and PHP findings and subjective perception of metamorphopsia in patients with macular diseases. Invest Ophthalmol Vis Sci. 2011;52:128–35. doi: 10.1167/iovs.09-3535. [DOI] [PubMed] [Google Scholar]
- 17.Goldstein M, Loewenstein A, Barak A, Pollack A, Bukelman A, Katz H, et al. Results of a multicentre clinical trial to evaluate the preferential hyperacuity perimeter for detection of age-related macular degeneration. Retina. 2005;25:296–303. doi: 10.1097/00006982-200504000-00008. [DOI] [PubMed] [Google Scholar]
- 18.Gupta B, Laidlaw DA, Williamson TH, Shah SP, Wong R, Wren S. Predicting visual success in macular hole surgery. Br J Ophthalmol. 2009;93:1488–91. doi: 10.1136/bjo.2008.153189. [DOI] [PubMed] [Google Scholar]
- 19.Waheed K, Laidlaw DA. Disease laterality, eye dominance, and visual handicap in patients with unilateral full thickness macular holes. Br J Ophthalmol. 2003;87:626–8. doi: 10.1136/bjo.87.5.626. [DOI] [PMC free article] [PubMed] [Google Scholar]
- 20.Bland JM, Altman DG. Statistical methods for assessing agreement between two methods of clinical measurement. Lancet. 1986;1:307–10. [PubMed] [Google Scholar]
- 21.London: BSI; 1987. British Standards Institution. Precision of test methods I: Guide for the determination and reproducibility for a standard test method (BS 5497, part 1) [Google Scholar]
- 22.Wilkinson F, Wilson HR, Habak C. Detection and recognition of radial frequency patterns. Vision Res. 1998;38:3555–68. doi: 10.1016/s0042-6989(98)00039-x. [DOI] [PubMed] [Google Scholar]


