Abstract
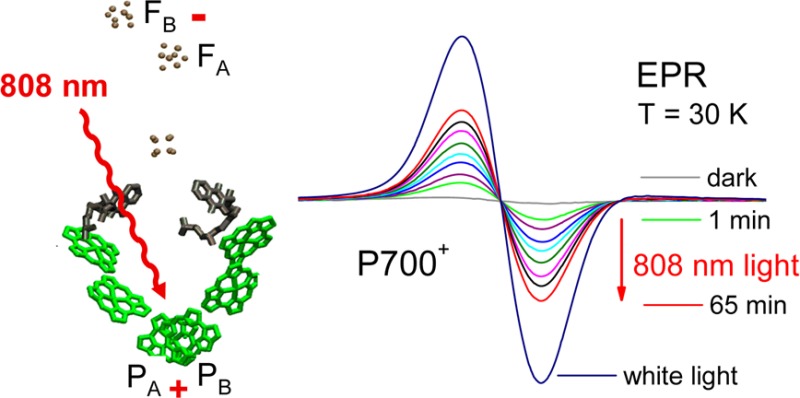
In Photosystem I (PS I) long-wavelength chlorophylls (LWC) of the core antenna are known to extend the spectral region up to 750 nm for absorbance of light that drives photochemistry. Here we present clear evidence that even far-red light with wavelengths beyond 800 nm, clearly outside the LWC absorption bands, can still induce photochemical charge separation in PS I throughout the full temperature range from 295 to 5 K. At room temperature, the photoaccumulation of P700+• was followed by the absorbance increase at 826 nm. At low temperatures (T < 100 K), the formation of P700+•FA/B–• was monitored by the characteristic EPR signals of P700+• and FA/B–• and by the characteristic light-minus-dark absorbance difference spectrum in the QY region.
P700 oxidation was observed upon selective excitation at 754, 785, and 808 nm, using monomeric and trimeric PS I core complexes of Thermosynechococcus elongatus and Arthrospira platensis, which differ in the amount of LWC. The results show that the LWC cannot be responsible for the long-wavelength excitation-induced charge separation at low temperatures, where thermal uphill energy transfer is frozen out. Direct energy conversion of the excitation energy from the LWC to the primary radical pair, e.g., via a superexchange mechanism, is excluded, because no dependence on the content of LWC was observed. Therefore, it is concluded that electron transfer through PS I is induced by direct excitation of a proposed charge transfer (CT) state in the reaction center. A direct signature of this CT state is seen in absorbance spectra of concentrated PS I samples, which reveal a weak and featureless absorbance band extending beyond 800 nm, in addition to the well-known bands of LWC (C708, C719 and C740) in the range between 700 and 750 nm. The present findings suggest that nature can exploit CT states for extending the long wavelength limit in PSI even beyond that of LWC. Similar mechanisms may work in other photosynthetic systems and in chemical systems capable of photoinduced electron transfer processes in general.
Introduction
In photosynthetic organisms, absorbed sunlight is transferred as excitation energy to the reaction center to drive photochemistry. In the reaction center, a photoinduced charge separation takes place by transferring an electron from the excited primary donor to an adjacent electron acceptor. Excitation energy is converted in this way into electrochemical energy. Secondary electron transfer reactions stabilize the primary charge separation by increasing the distance between the separated charges.
It is generally assumed that photochemistry starts from the lowest excited state of the reaction center. However, the transition energy from the ground state to this excited state may not be the long-wavelength limit of photochemistry. There are reports that lower-energy (longer-wavelength) radiation can also be used by various photosynthetic organisms resulting in a higher energy efficiency.1−6
One example is photosystem I (PS I)7a studied in this work. PS I contains so-called long-wavelength chlorophylls (LWC) or red antenna states where the energy of the lowest excited singlet state lies below that of the excited singlet state, P700*, from which the charge separation starts (for a review see refs (7 and 8)). Remarkably, excitation at significantly longer wavelengths than 700 nm can induce photochemical charge separation at room temperature and even low temperature (78 K).2,3 In our study we observe charge separation for long wavelength excitation even beyond the absorption bands of the LWC, indicating an underlying mechanism independent from the LWC.
Photosystem I is a pigment–protein complex located in the thylakoid membranes of cyanobacteria, algae, and plants that mediates light-induced electron transfer from plastocyanin or cytochrome c6 on the lumenal side to ferredoxin on the stromal side (for a review see refs (9,10) and references therein). Cyanobacteria lacking the peripheral light-harvesting complex, LHC I, contain only the PS I core. The PS I core complex coordinates all of the redox cofactors and the core antenna of ∼100 chlorophyll a (Chl) and ∼20 β-carotene molecules. The PS I core complexes in cyanobacteria are organized preferentially as trimers,11−13 whereas PS I in higher plants and algae is present only as a monomer.14
A high-resolution (2.5 Å) X-ray structure is available for trimeric PS I core complexes from the cyanobacterium Thermosynechococcus elongatus,15 whereas for plant PS I, a crystallographic model at 3.3 Å resolution has been reported.16 The two large subunits, PsaA and PsaB, each consisting of 11 transmembrane helices, coordinate most of the antenna pigments and the following redox cofactors involved in the electron-transfer reactions: the primary electron donor P700 (a heterodimer of Chl a (eC-B1; PB) and Chl a′ (eC-A1; PA)) located on the luminal side (nomenclature of ref (15) is used for naming cofactors).
Two branches of cofactors related by pseudo-C2 symmetry connect the special pair PA–PB and the first [4Fe-4S] iron sulfur cluster FX (see Figure 1). Each branch is composed of two Chls (Acc-A (eC-B2) and A0-A (eC-A3) in the A-branch and Acc-B (eC-A2) and A0-B (eC–B3) in the B-branch) and one phylloquinone A1-A/B (QK-A and QK-B, respectively). The terminal electron acceptors FA and FB (two [4Fe-4S] iron–sulfur clusters) are both coordinated by subunit PsaC, one of the three extrinsic subunits located on the stromal side.
Figure 1.
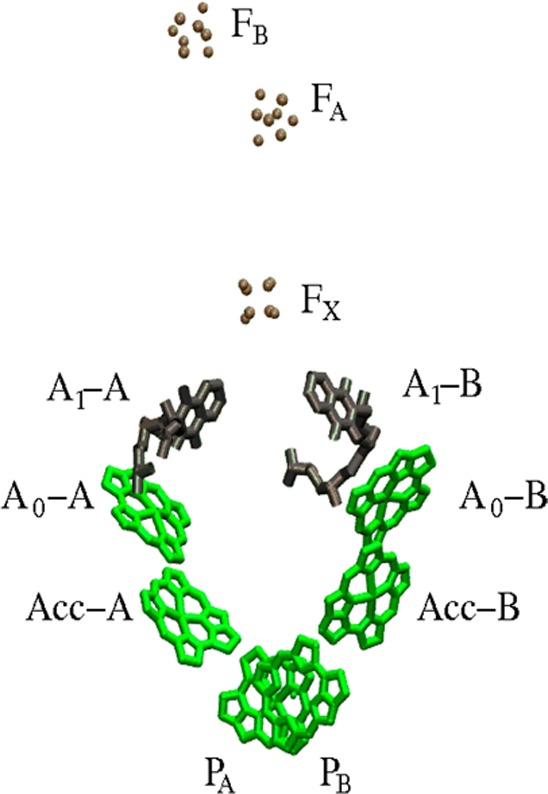
Arrangement of the electron transfer cofactors of PS I from T. elongatus taken from the X-ray structure at 2.5 Å resolution15
After absorption of light by an antenna pigment, the excitation energy is efficiently trapped via charge separation in the reaction center leading to P700+•A0–•. Charge stabilization is achieved by subsequent electron transfer to the secondary acceptor A1, then further to FX and finally to the terminal electron acceptors FA and FB. In PS I both branches are ET active; however, the A-branch is used more frequently.17 Some mechanistic details of primary ET are still open for discussion, such as the identity of the primary electron donor. From mutagenesis studies, removing a hydrogen bond to PA, and measuring absorbance difference spectra P700+• – P700 it became clear that the lowest excited state has strong contributions from the special pair.18 Most likely, the energy sink is determined by short-range effects in the special pair,19 which were calculated to red-shift the site energies of the special pair by about 500 cm–1. If one assumes that ET starts from an excitonically equilibrated RC, it would be most natural to assume that the special pair PA–PB is the primary electron donor. From mutagenesis studies involving ultrafast transient absorption studies,20,21 however, it was concluded that the primary electron donor in PS I is not the special pair but one of the two accessory chlorophylls Acc-A or Acc-B.
The occurrence of LWC in the core antenna, surrounding the reaction center, is unique to cyanobacteria. Higher plants and algae contain LWC in the light-harvesting complex LHCI.16,22 More recently it was shown that both the Lhca1/Lhca4 and Lhca2/Lhca3 heterodimers contain a red antenna state with low-temperature emission maxima around 730 nm.23 The amount and spectral characteristics of long-wavelength Chl a antenna states in PS I of cyanobacteria are species dependent. PS I trimers contain usually more red Chls than PS I monomers.7,8
In this work, we used monomeric and trimeric PS I from T. elongatus and Arthrospira platensis. Low-temperature absorption spectra are shown as Supporting Information (see Figure S1). The low-temperature absorption spectrum of PS I from T. elongatus exhibits two long-wavelength absorption bands peaking at 708 and 719 nm, assigned to long-wavelength chlorophylls called C708 and C719.3 For PS I of A. platensis absorption bands are found at 708 and 740 nm, attributed to LWCs called C708 and C740.7,24 The absorption of C708 corresponds to that of about five (PS I of T. elongatus) and seven (PS I of A. platensis) Chl a molecules in the QY region. The oscillator strength of C719 corresponds to a QY-band oscillator strength of two Chl a molecules in PS I monomers and four Chl a molecules per P700 in PS I trimers from T. elongatus. PS I trimers of A. platensis contain the most red-shifted Chl antenna state reported so far, absorbing at 740 nm (C740) and emitting at 760 nm (F760) at cryogenic temperatures.24,25 The oscillator strength of C740 corresponds to a QY-band oscillator strength of about three Chl a molecules per P700.
Photooxidation of P700 by far-red light at room temperature is generally attributed to thermally activated uphill energy transfer.3,7,8 Indeed, the thermal energy of the environment might enable efficient uphill energy transfer to bulk Chls and then to P700. At physiological temperatures, the quantum efficiency of photochemistry is virtually not affected by the long-wavelength Chls, and the quantum yield of P700 oxidation is nearly independent of the wavelength of the excitation, even at wavelengths of up to 750 nm 3. At lower temperatures, the LWC act, however, as traps for excitations, decreasing thereby the quantum yield of charge separation for visible light excitation and increasing the fluorescence yield.3,7,17,19 Remarkably, there is one report2, that far-red illumination leads to photooxidation of P700 even at cryogenic temperatures. The underlying mechanism is not clear.
A long discussion on the function of long-wavelength antenna pigments started ever since their discovery. It has been suggested that the extension of the spectral range for light harvesting to longer wavelengths was crucial for the adaptation of the cyanobacteria to low-light conditions.26 Long-wavelength Chls may also be involved in the protection of PS I complex against excess excitation light energy.7,27
In this work, photooxidation of P700 induced by far-red excitation, even extending the range up to 810 nm, has been analyzed in detail by absorbance difference spectroscopy. Additionally, EPR spectroscopy has been used to monitor the EPR signal of the P700+• radical arising upon far-red excitation at different temperatures. The wavelength and temperature dependence of P700+• formation by far-red excitation has been investigated. The amount of P700+• formed upon long-wavelength excitation at each temperature between 5 K and room temperature has been determined relative to the amount of P700+• induced by illumination with white light under the same conditions. Using PS I samples with different amounts of LWC (e.g., monomeric and trimeric PS I from T. elongatus and A. platensis) offers the possibility to clarify the role of the LWC in this process.
Materials and Methods
Preparation of PS I Complexes
PS I trimers and monomers from T. elongatus have been isolated and purified as described in refs (28 and 29). Monomeric and trimeric PS I core complexes from A. platensis have been prepared according to ref (24).
Measurement of Steady-State Optical Spectra and Light-Minus-Dark Difference Spectra
For the measurement of absorbance spectra, the concentrated PS I stock solutions were diluted to a final Chl concentration of about 10 to 20 μM with buffer containing 20 mM tricine (N-[2-hydroxy-1,1-bis(hydroxymethyl)ethyl]glycine) pH = 7.5, or MES (2-(N-morpholino)ethanesulfonic acid) pH = 6.5, 25 mM MgCl2, 100 mM KCl, 0.02% n-dodecyl-β-d-maltoside (β-DM). Absorption spectra were recorded with a spectral resolution of 1 nm on a Cary-1E-UV/VIS spectrophotometer (Varian, Inc.). Concentrated PS I samples (c(Chl a)·d = (0.1–4) mM·cm with an optical path length d = 0.2 cm) were used to identify the weak absorbance of PS I samples in the far-red region (700–900 nm) at room temperature. To reduce light scattering, the quartz cuvette was placed in front of the sample compartment exit window of the spectrophotometer. The baseline was recorded with buffer, and for each spectrum the absorbance was set to zero at 900 nm.
For experiments at cryogenic temperatures, glycerol was added to a final concentration of 60–65% (v/v) as a cryoprotectant. At this glycerol concentration, the sample forms a clear glass during cooling at about 200 K and remains optically transparent. The cuvette was placed in a variable-temperature, liquid nitrogen bath cryostat (Oxford DN1704) or a liquid helium flow cryostat (Oxford CF1204). A home-built cryostat holder was used in the spectrophotometer. Spectra were recorded with data intervals of 0.1 nm, a scan speed of 20 nm/min, and a spectral bandwidth of 1 nm.
For light-minus-dark absorbance difference spectra at cryogenic temperatures (5–100 K), 5 mM sodium ascorbate and 3 μM PMS were added, and the sample was cooled in the dark to the set temperature. Under these conditions, P700 is fully reduced, and all electron acceptors are oxidized prior to illumination at low temperature.
First, two spectra of the dark-adapted sample were measured in one series of measurements. The difference of the two dark spectra was calculated in order to check that photochemistry induced by the measuring light in the spectrophotometer is negligible. To minimize excitation by the measuring light, its intensity was reduced by a neutral density filter with 29% transmission.
Thereafter, the sample was illuminated perpendicular to the measuring light beam for a certain period of time as indicated in the figure legends, and spectra of the illuminated sample were recorded. The difference spectra (light-minus-dark) were obtained by subtracting the absorbance spectrum of the sample in the dark-adapted state from that after illumination.
For illumination of the sample with far-red light we used different laser diodes: (1) LT031 MDO from Sharp (wavelength 754 nm, cw, power 8 mW); (2) laser diode module IMM-1255FB-785-50-E-K-L (IMM Photonics) containing DL-7140-002 from Sanyo (wavelength 785 nm, cw, power 45 mW), (3) laser diode module IMM-1255FB-808-160-E-G-L (IMM Photonics) containing DL-8141-001S from Sanyo (wavelength 808 nm, cw, power 129 mW) and (4) HL8318G from Hitachi (wavelength 830 nm, cw, power 25 mW). Control experiments, in which, in addition, an appropriate interference filter has been used in front of the sample, confirmed that the oxidation of P700 was exclusively induced by the far-red light used for excitation.
At the end, the sample was illuminated either by 50 saturating flashes of about 15 μs duration from a Xe-flash lamp whose emission was filtered by a Corning glass filter (CS 4-96) or by cw visible light for 1–5 min using a cold light source (Streppel halolux 250) filtered by a colored glass filter or by blue LED light (Thorlabs LED C2 emitting at 455 nm). Thereby, we could determine the maximal absorbance changes that can be induced by visible actinic light (hereinafter also referred to as white light excitation).
The absorbance difference spectra (light-minus-dark) are attributed to the stable formation of P700+•FA–• and P700+•FB–•. It is known from studies of the heterogeneity of electron transfer reactions in PS I at low temperature30,31 that in one fraction of the PS I complexes, an irreversible charge separation due to the stable formation of P700+•FA/B–• takes place, whereas in the other fraction forward electron transfer to the terminal iron–sulfur clusters FA/B–• is completely blocked at cryogenic temperatures.31 In this fraction, the charge separation is reversible at low temperature and can be attributed to the formation and decay of P700+•A1–• and P700+•FX–•, respectively. Charge recombination of P700+•A1–• occurs almost independent of temperature with t1/2 ≈ 170 μs.31 The charge recombination between FX–• and P700+• takes place in the millisecond time range at low temperature.31 These states do not contribute to the difference spectra because their half-lives are too short.
Control experiments were performed with samples containing P700 in the oxidized state. P700 was oxidized either chemically by the addition of 1 mM ferricyanide or by freezing a sample without addition of redox mediators under illumination. In this case, P700 is irreversibly oxidized by the light. In these samples, the spectra after illumination were virtually identical to the dark spectrum.
Absorbance Changes at 826 nm Induced by cw Far-Red Light at Room Temperature
Absorbance changes at 826 nm induced by cw far-red light at room temperature were measured using the kinetic application of the Cary-1E-UV/vis spectrophotometer. The photomultiplier was protected against scattered actinic light and fluorescence by a narrow-band interference filter (MA7-05, 826.2 nm from Schott). To achieve a better signal-to-noise ratio, the chlorophyll concentration was increased up to 200 μM in these experiments. The intensity of the weak monochromatic (λ = 826 nm) measuring light of the spectrophotometer was recorded as a function of time. Actinic light that induces the photochemical reactions was passed onto the sample at a right angle to the measuring beam. The accumulation of oxidized P700 by the actinic light is accompanied by an absorption increase of the sample at 826 nm.32 After turning off the actinic light, the absorbance change decays in the dark due to the recovery of the initial state. Oxidized P700 is reduced by ascorbate. Its concentration determines the recovery rate. The rate of formation of P700+• is kcs = σ(λ)Φ(λ)·I where σ(λ) is the absorption cross section at the wavelength λ of the actinic light, Φ(λ) is the quantum yield of charge separation, and I is the photon flux per cm2.
Electron Paramagnetic Resonance Spectroscopy
X-Band EPR spectra (9.3 GHz) were recorded using a Bruker “EMX Plus” spectrometer equipped with a high-sensitivity Bruker Superhigh-Q-cavity (ER 4122 SHQE). Samples (typically chlorophyll concentration was 1–5 mM) were prepared in quartz tubes with an outer diameter of 4 mm. They contained 65% glycerol and 5 mM ascorbate. They were frozen in cold ethanol at about 220 K and immediately transferred into an Oxford EPR 900 helium flow cryostat that allows low-temperature measurements between 5 and 200 K (Oxford ITC4). Freezing of EPR samples, transfer into the EPR cryostat, and measurements were performed in the dark. Instrument settings are given in the figure legends. Baseline corrections, if required, were performed by subtracting a background spectrum, obtained under the same experimental conditions from a sample containing only a buffer solution.
The resonator contained slits to allow light excitation of the sample. The PS I samples were illuminated with far-red light of the laser diodes described above or by cw white light from a 150 W tungsten lamp filtered by a 10 cm water filter. When it was appropriate, the light was focused by a lens.
Results
Photooxidation of P700 by Far-Red Light at Room Temperature
It is well documented in the literature that PS I can use far-red light up to 750 nm at room temperature to drive photochemistry.2,3 Interestingly, the difference between the energy of a photon at 700 and 755 nm amounts already to 129 meV which corresponds to about 5 kT at T = 295 K. To examine the proposed mechanism, we analyzed photooxidation of P700 upon far-red excitation using monomeric and trimeric PS I complexes from T. elongatus and A. platensis with significantly different contents of LWC. The sample was selectively excited by actinic light from laser diodes in the wavelength region from 754 nm up to 808 nm (see Materials and Methods). The characteristic absorbance of chlorophyll cation radicals in the NIR has been monitored at 826 nm to follow the formation of P700+•.
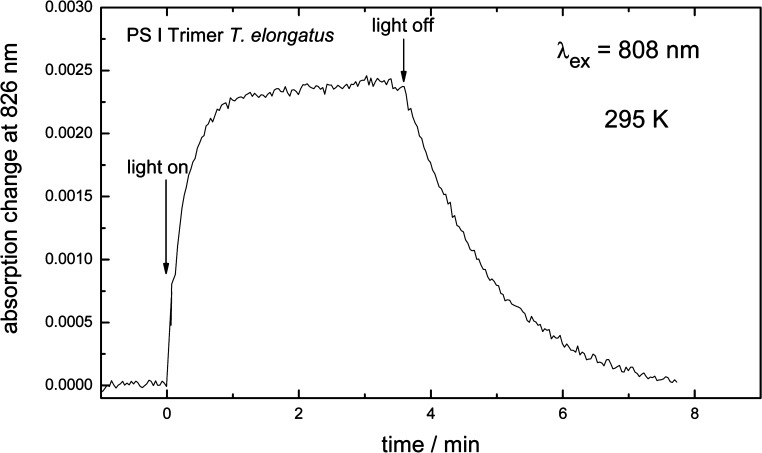
Figure 2 shows the absorption of PS I trimers from T. elongatus at 826 nm as a function of time. At t = 0 the laser diode emitting light at 808 nm was turned on. The absorption increase can be assigned to the accumulation of P700+• (see Scheme 1).
Figure 2.
Time course of absorption of PS I trimers from T. elongatus at 826 nm as a function of time. The absorbance increase is assigned to the photoaccumulation of P700+• induced by 808 nm light from a cw laser diode, (293 K, 1 mM ascorbate).
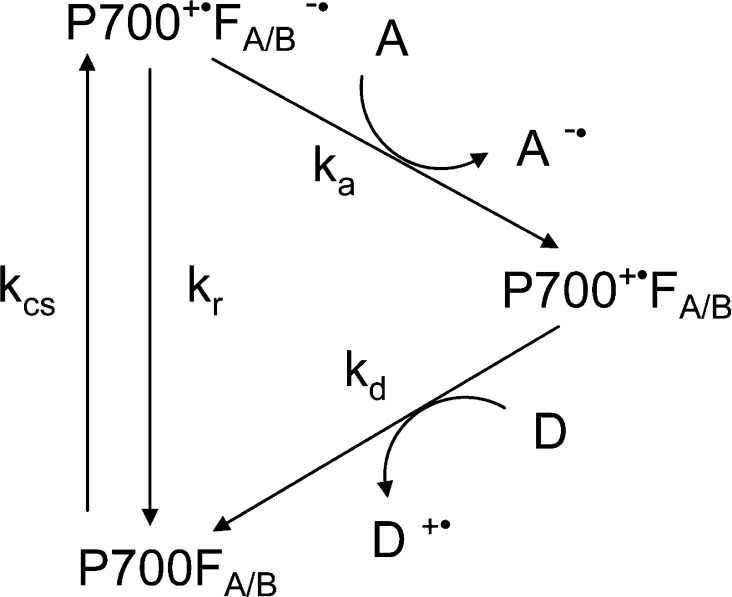
Scheme 1. Reaction Scheme of ET Reactions Following the Formation of P700+•FA/B–•.
After formation of P700+•FA/B–•, the reduced terminal iron–sulfur cluster is reoxidized either by charge recombination with P700+• or by forward electron transfer to external electron acceptors (e.g., oxygen or dehydroascorbate). In the latter case, the photoaccumulated P700+• is very slowly rereduced by ascorbate. Forward electron transfer occurs under aerobic conditions in about 50–70% of the PS I complexes.9,33 The decay of the absorption increase recorded after switching off the laser diode (indicated by the arrow “light off” in Figure 2) offers the possibility to determine the rate constant of the reduction of P700+•.
The rate constant can be adjusted by the ascorbate concentration of the reaction medium. The rate of far-red light-induced accumulation of P700+• is given according to Scheme 1 by
with
where σ(λ) is the absorption cross section of photosystem I at wavelength λ, I is the photon flux per cm2, and Φ(λ) is the quantum yield of charge separation. It should be noted that ka and kd depend on the acceptor and donor concentrations:
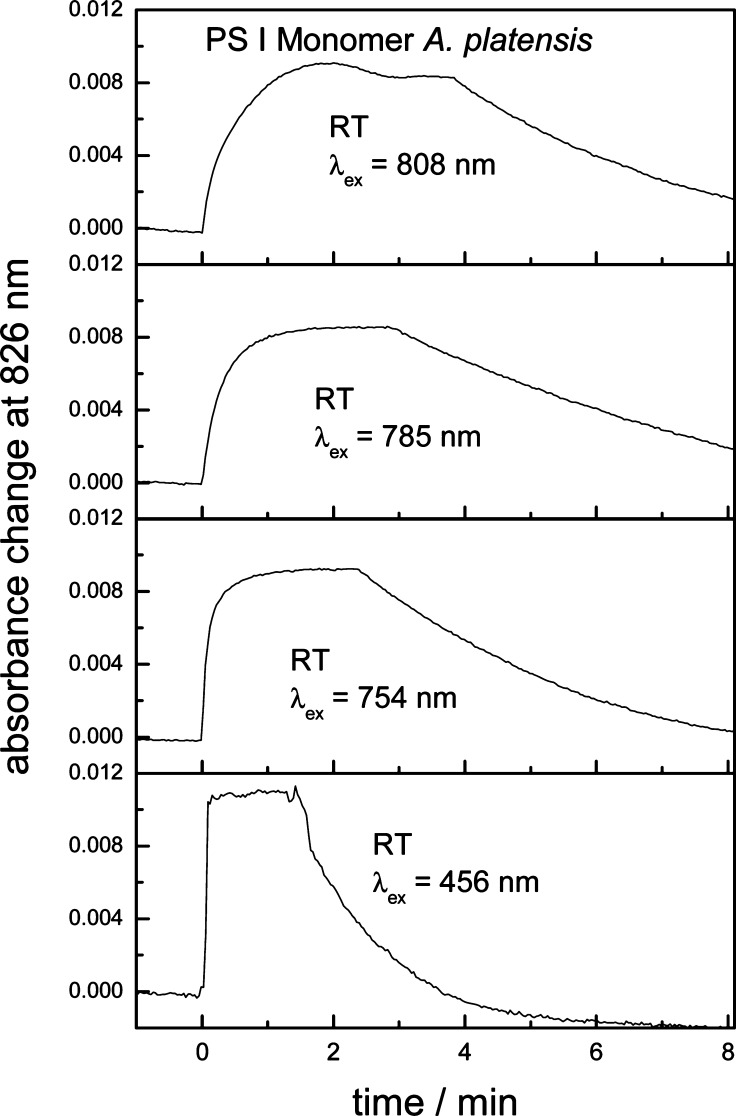
Photooxidation of P700 upon selective far-red excitation has been examined at 754, 785, and 808 nm using cw laser diodes as actinic light source (see Materials and Methods). Experiments have been performed with monomeric and trimeric PS I complexes from T. elongatus and A. platensis, which contain different long-wavelength spectral forms and different amounts of LWC identified by their absorption maxima at low temperature.7,8 For each excitation wavelength and all PS I samples, an absorption increase at 826 nm was observed. This observation provides clear evidence that P700+• can be accumulated upon far-red illumination up to 808 nm, regardless of the different LWC content of the PS I complexes. Figure 3 shows as an example the results for PS I monomers from A. platensis for different excitation wavelengths. Monomeric PS I from A. platensis contains only one long-wavelength spectral form with an absorption maximum at 708 nm.7,24 The bottom trace of Figure 3 shows the formation of P700+• induced by visible actinic light (blue LED light, 456 nm). Under these conditions, P700 is oxidized in virtually all PS I centers resulting in the maximum change in absorbance. The rise upon 456 nm excitation is significantly faster than those found upon far-red excitation. It is even faster than the rise shown in Figure 3, bottom, because it is limited by the time resolution used in this experiment.
Figure 3.
Time course of absorption of PS I monomers from A. platensis at 826 nm as a function of time. The absorbance increase due to the photoaccumulation of P700+• is induced by far-red monochromatic light from cw laser diodes with the indicated wavelengths. Bottom graph shows for comparison the time course upon excitation with LED light at 456 nm (293 K, 1 mM ascorbate).
The absorption change ΔA(t) can be expressed according to Lambert–Beer’s law as
where Δε is the difference between the molar extinction coefficients of P700+• and P700 at wavelength λ, and [P700+•](t) is the concentration of oxidized P700 at time t, d is the optical path length. The differential extinction coefficient at 826 nm is about 7500 M–1 cm–1.32,14 Using the simplified reaction scheme
the absorbance change ΔAstat, that is reached in the steady-state after switching on the excitation light, can be calculated by
The maximum change ΔAmax is observed when P700 is oxidized in all centers, that means kf ≫ kd. kd is the rate for the decay of P700+• due to rereduction by ascorbate. The rise kinetics of the absorbance change is given by
where t1/2 is the half-life of the rise. After turning off the light, P700+• decays with a half-life equal to ([ln 2]/kd).
Figure 4 shows the formation of P700+• as a function of the intensity I of the actinic far-red light. The half-life of the rise and ΔAstat should depend on the intensity of actinic far-red light, since the rate of light induced formation of P700+•FA/B–• is proportional to I(kcs = σ(λ)·I·ϕ). The laser light at 785 nm has been attenuated by neutral density filters with transmissions between 5% and 54%. The simplified reaction scheme provides a satisfactory description of the results.
Figure 4.
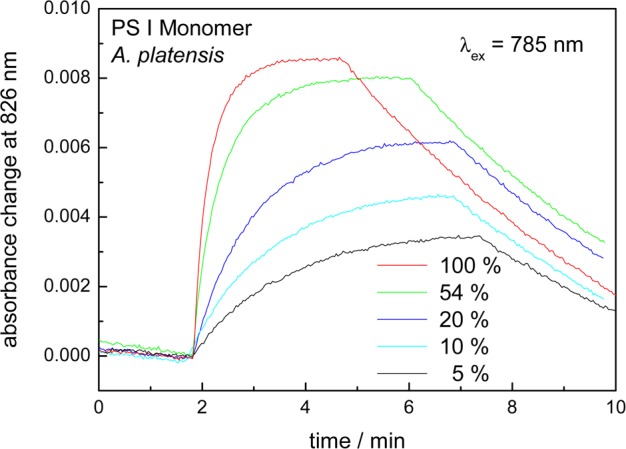
Time course of absorption of PS I monomers from A. platensis at 826 nm as a function of time. The absorbance increase is assigned to the photoaccumulation of P700+• induced by 785 nm light, whose intensity was attenuated with neutral density filters of different transmissions (293 K, 1 mM ascorbate).
The half-life of the rise increases from 14 to 72 s, whereas the absorption change in the steady-state decreases from 0.0085 to 0.0036, if the intensity of the excitation light is attenuated from 100% to 5%. An average value of 2.1 × 10⁻¹⁸ cm2 has been calculated for kf/I = σ(λ)·ϕ(λ). Using the relationship between the absorption cross section and the molar extinction coefficient and (ka)/(ka + kr) = 0.6 (see above), one obtains ε̅ = ε·ϕ= 930 MPSI–1 cm–1 at 785 nm. With this value the absorption of the PS I sample at 785 nm can be calculated by A = ε̅·cPSI·d·ϕ–1, where cPSI is the concentration of monomeric PS I complexes from A. platensis.
Series of measurements that are similar to those shown in Figure 4 were carried out with monomeric and trimeric PS I complexes from T. elongatus and trimeric PS I complexes from A. platensis with excitation light at 754, 785, and 808 nm. Table 1 summarizes the ε(λ)·ϕ(λ) values.
Table 1. ε(λ)·ϕ(λ) Values for the Different PS I Complexes at the Indicated Excitation Wavelengths (T = 293 K)a.
| ε(λ)·ϕ(λ)/MPSI–1 cm–1 |
|||
|---|---|---|---|
| λ | 754 nm | 785 nm | 808 nm |
| PS I monomer T. elongatus | 3500 | 830 | 28 |
| PS I trimer T. elongatus | 7000 | 950 | 43 |
| PS I monomer A. platensis | 4000 | 930 | 28 |
| PS I trimer A. platensis | 19000 | 1500 | 33 |
A relative error of about ±30% has been estimated from the scattering of the measured data for multiple measurements.
The most remarkable difference of the ε(λ)·ϕ(λ) values between PS I trimers and monomers is observed at 754 nm. Most likely, the most far-red absorbing LWC, which are present only in PS I trimers (C719 of PS I trimers from T. elongatus and C740 of PS I trimers from A. platensis), contribute significantly to the absorption of the PS I complexes at this wavelength.
Absorption of PS I in the Far-Red Wavelength Region
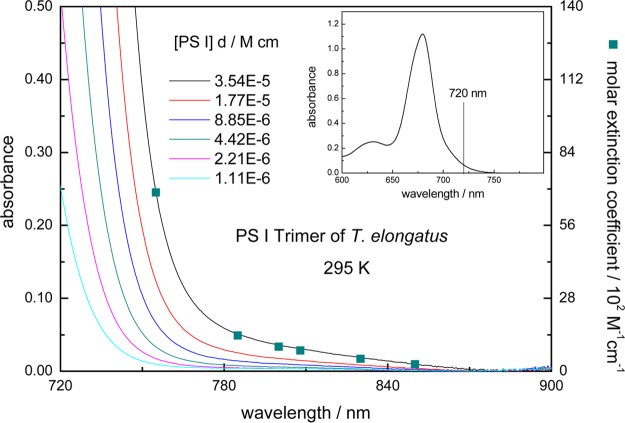
Reliable measurements of the absorption of PS I complexes between 750 and 850 nm are difficult due to the low extinction coefficients in this wavelength range. The absorption decreases virtually toward zero above 730 nm in PS I monomers and above 750 nm in PS I trimers in all previously reported absorption spectra.3,7,8,24 This is shown in Figure 5 (inset) which exhibits the absorbance spectrum of PS I trimers in the QY region (taken from ref (34)) at [PS I]·d = 2.0 × 10⁻⁷ M·cm. With a ratio of about 100 Chl a/PS I3,15,24 this corresponds to [Chl a]·d = 2.0 × 10⁻⁵ M·cm. To resolve the low absorption above 720 nm up to 850 nm, we used concentrated PS I samples ([Chla]·d = (0.1–4)·10–3 M·cm) and a cuvette with an optical path length d = 0.2 cm. Figure 5 shows the absorption of PS I trimers from T. elongatus between 720 and 900 nm. Above 720 nm, the absorption of the long-wavelength antenna chlorophylls drops rapidly. A weak and featureless absorption extends up to about 850 nm. At each wavelength, the absorbance versus concentration plots are linear, and the slope gives the molar extinction coefficients ε. The squares represent the ε-values (see right scale) for the different excitation wavelengths used in this work:
 |
Figure 5.
Room temperature absorbance spectra of highly concentrated PS I trimer samples from T. elongatus in the far-red wavelength range between 720 and 900 nm. The squares represent the ε-values (see right scale) for the different excitation wavelengths used in this work. The inset shows the absorbance spectrum in the QY region with [PS I]·d = 2.0 × 10⁻⁷ M cm.
It should be noted that the spectra of the highly concentrated PS I suspension could be slightly affected by light scattering. In this case, the recorded absorption would then be systematically too high.
It is interesting to compare the extinction coefficients with ε(λ)·ϕ(λ) values determined from measurements of the formation of P700+• as a function of the intensity I of the actinic far-red light for PS I trimers from T. elongatus at room temperature (see Table 1, row 2). It is noticeable that the calculated quantum yield ϕ(λ) is surprisingly high at 754 and 785 nm (about 100% and 70%, respectively), whereas the quantum yield at 808 nm is much lower with (9%). A quantum yield of about 80% is also estimated for PS I trimers from A. platensis at 754 nm based on an extinction coefficient of 25000 MPSI–1 cm–1 at 754 nm.24
Measurements of the absorption between 750 and 850 nm using concentrated PS I samples have also been performed at 77 K (not shown, see diploma work of J.M., TU Berlin). We obtained the following molar extinction coefficients:
 |
Errors due to light scattering or problems with the baseline correction may influence the accuracy of the data. Nevertheless, it is obvious that the values at 77 K are significantly smaller than those at room temperature due to the sharpening of absorption bands at low temperature.24,34
Photooxidation of P700 by Far-Red Light at Cryogenic Temperatures Studied by EPR
EPR spectroscopy was used to study P700 photooxidation upon long-wavelength excitation (700 < λexc < 830 nm) at cryogenic temperatures. The EPR signal attributed to P700+• has been measured in PS I monomers and trimers from A. platensis and T. elongatus. The efficiency of photooxidation upon long-wavelength excitation at various temperatures has been followed by measuring the time-course of P700+• formation in all investigated PS I complexes, which contain different LWC.
Figure 6a shows EPR spectra due to the oxidation of P700 by far-red excitation (λexc = 785 nm) of PS I trimers from T. elongatus at 30 K in dependence on the duration of excitation. The PS I sample was frozen in the dark in the presence of ascorbate, so that P700 is completely reduced. The curve, denoted “dark”, confirms that no EPR signal is initially detectable. Upon illumination with far-red light, an EPR spectrum appeared that is assigned to the cation radical P700+• on the basis of the g-value (g = 2.002) and the line width (0.74 mT).35,36 After 72 min illumination with the 785 nm laser diode, the yield of P700+• is equal to about 60% of the yield obtained by white light illumination.
Figure 6.
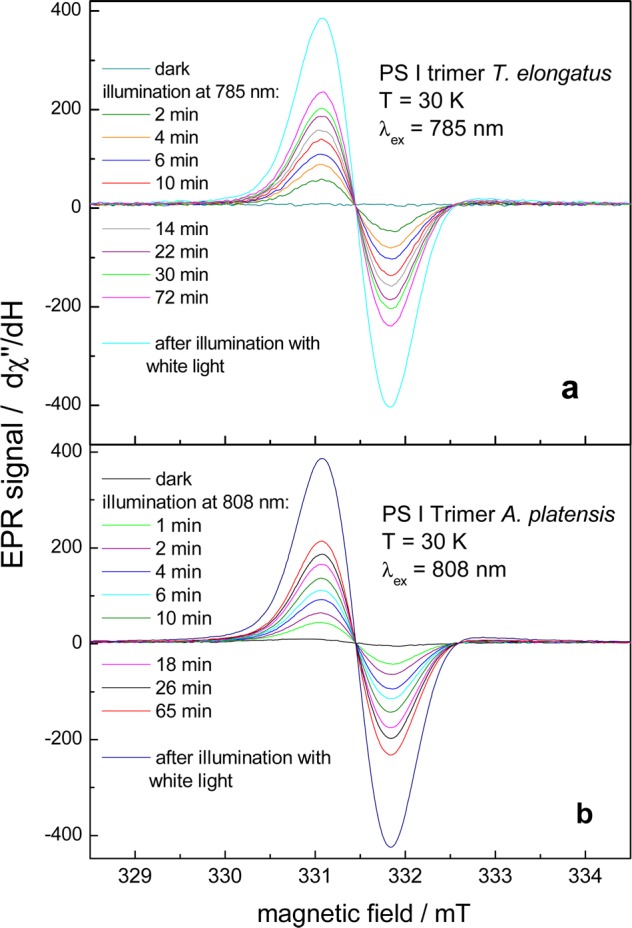
(a) EPR spectra of PS I trimers from T. elongatus at 30 K after different illumination periods with 785 nm laser light. (b) EPR spectra of PS I trimers from A. platensis at 30 K after different illumination periods with 808 nm laser light. Experimental parameters for all measurements are the following: microwave power 0.0016 mW, conversion time 0.031 s, modulation amplitude 0.2004 mT, scan time 30 s, number of scans: 4, receiver time constant of 0.082 s.
Most likely, the stable formation of P700+•FA/B–•, which takes place at low temperature in one fraction of the PS I complexes (see Introduction and ref (31)), gives rise to the EPR spectrum. In the other fraction, the charge separation is reversible at low temperature, because forward electron transfer to the terminal iron–sulfur clusters is completely blocked at cryogenic temperatures.31 The short-lived states P700+•A1 and P700+•Fx–• do not contribute to the EPR signal because their half-lives are too short.
The formation of FA/B–• could also be confirmed by the characteristic EPR signal of the reduced iron–sulfur cluster (not shown). The EPR spectrum induced by 808 nm illumination of PS I trimers from T. elongatus shows three turning points (gxx = 1.865, gyy = 1.946 and gzz = 2.051) in accordance with the principal values of the g-tensor of FA.37,38 The virtually exclusive reduction of FA has also been observed earlier upon white light illumination of PS I trimers from T. elongatus at cryogenic temperatures.37 The EPR spectrum of PS I trimers from A. platensis exhibits the photoreduction of FA as well as of FB (not shown). The results demonstrate that the formation of P700+•FA/B–• is induced by far-red light excitation in PS I from both organisms. This means that the photochemistry is identical to that observed upon white-light illumination.
Similar measurements as shown in Figure 6a have been performed using laser diodes with an emission wavelength of 754 and 808 nm for excitation (not shown). Figure 7a shows the yield of P700+• formation divided by the maximum yield obtained with white light illumination as a function of the duration of excitation. The blue triangles show the result of a control experiment, whereby a narrow band (fwhm =18 nm) laser cleanup filter (F34-786 from AHF Analysentechnik) with a central wavelength at 785 nm and a maximum transmission of about 90% was placed directly in front of the resonator. The result excludes the possibility that laser sidebands or UV–VIS stray light distorted the measurements and confirms that the formation of P700+•FA–• is solely induced by far-red 785 nm light. The slightly lower yield is the result of the somewhat lower photon flux reaching the sample. The rise kinetics can be fitted with two exponentials (see solid lines in Figure 7a). The extrapolated relative yields are 0.64 for 754 nm, 0.61 for 785 nm, and 0.4 for 808 nm. Half of the extrapolated yields are reached after 19 min (754 nm), 7 min (785 nm), and 9 min (808 nm).
Figure 7.
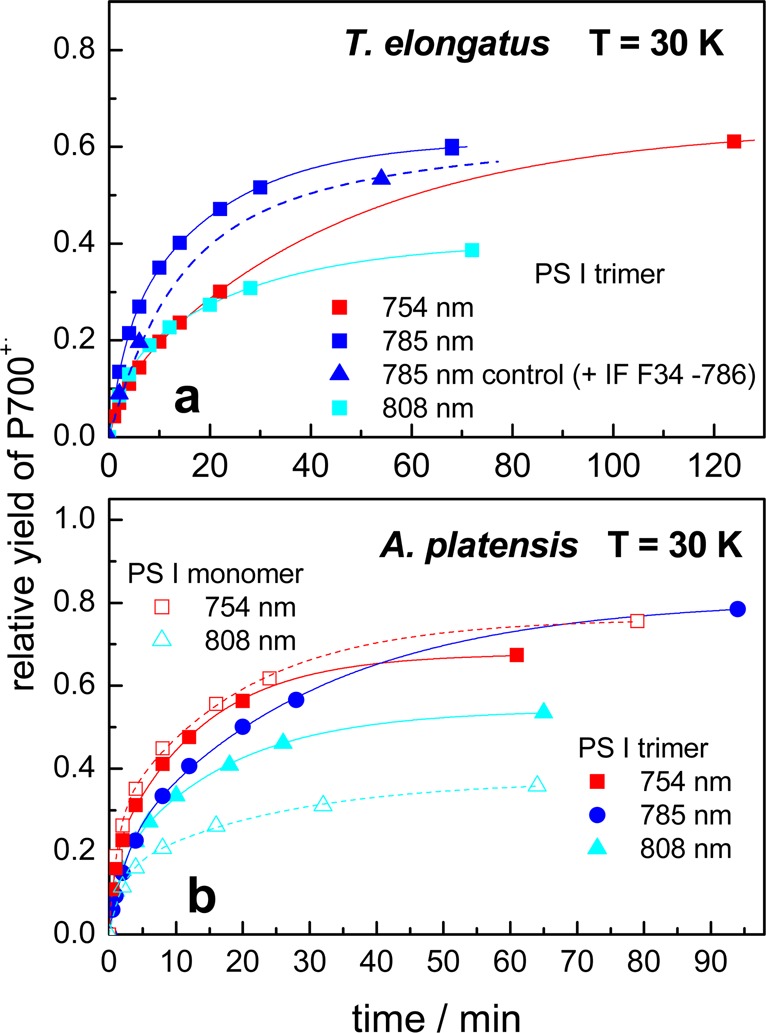
Yields of P700+• photoaccumulation upon selective far-red excitation in PS I trimers from T. elongatus (a) and PS I monomers and trimers from A. platensis (b) detected by EPR at 30 K divided by the maximum yield obtained with white light illumination as a function of the duration of excitation. The solid lines are the result of a biexponential fit. In a control experiment (785 nm control), an interference filter (F34-786 from AHF Analysentechnik) was placed directly in front of the resonator.
When comparing the kinetics for the different excitation wavelengths, it is necessary to take into account that the power of the laser diodes, and thus the incident photon flux per cm2, I, is very different (I754:I785:I808 = 1:5.8:17). In the EPR experiments, the illuminated area was about 1 cm2 for all laser diodes. Normalizing the kinetics for constant photon flux at all wavelengths, the rise at 785 nm would be 2 times slower, and that at 808 nm even 8 times slower than that at 754 nm. The half-lives corrected for constant photon flux are summarized further below in Table 4.
Table 4. (a) Half-lives [s] of P700+• Photoaccumulation Measured by EPR at 30 K Normalized to the Photon Flux per cm2 Used in the 754 nm Experiments; (b) Half-lives [s] of P700+• Photoaccumulation at Room Temperature Measured by the Absorbance Increase at 826 nm Normalized to the Photon Flux per cm2 Used in the EPR Experiments with 754 nm Excitation.
| (a) t1/2/s | 754 nm | 785 nm | 808 nm |
|---|---|---|---|
| T. elongatusPS I Trimer | 1140 | 2436 | 9180 |
| A. platensisPS I Trimer | 300 | 3480 | 6120 |
| A. platensisPS I Monomer | 300 | – | 6120 |
| (b) t1/2/s | 754 nm | 785 nm | 808 nm |
| T. elongatusPS I Trimer | 3 | 20 | 450 |
| A. platensisPS I Trimer | 1 | 12 | 550 |
| A. platensisPS I Monomer | 4 | 20 | 650 |
The results for PS I from A. platensis are depicted in Figures 6b and 7b. The increase of the EPR signal due to the formation of P700+• in PS I trimers upon illumination with 808 nm light at 30 K is depicted in Figure 6b. About 50% of the maximum yield obtained by white light (blue line) is obtained by far-red light at 808 nm after 60 min illumination (see red line).
The time course of the relative yield of P700+• formation in PS I monomers (open symbols) and trimers (closed symbols) is shown in Figure 7b for the different excitation wavelengths. Upon excitation at 754 nm, the kinetics are virtually identical for PS I monomers (open red squares) and trimers (closed red squares). The formation of P700+• induced by illumination at 808 nm (see cyan-colored triangles) occurs also with about the same half-life in PS I trimers and monomers. However, the yield is somewhat lower for monomers than for trimers. Monomeric PS I complexes from A. platensis and trimeric PS I complexes from both A. platensis and T. elongatus contain different long-wavelength chlorophylls (see Introduction). Differences with regard to the number and their spectral position have a direct influence on the absorption between 700 and 800 nm. Nevertheless, the kinetics of P700+• formation upon far-red excitation are very similar for all PS I samples taking into account a certain margin of error (see a and b of Figure 7). This gives clear evidence that the red antenna states do not play a role in far-red light-induced photooxidation of P700 observed at low temperatures. It is clear that a thermal activated uphill energy transfer between the red chlorophylls and the reaction center is impossible at low temperatures. It has, however, been proposed that excitons can tunnel directly from the low energy chlorophylls of the antenna to the charge-separated state of the reaction center via a superexchange mechanism.39,40 This mechanism can be ruled out for the studied PS I complexes on the basis of the fact that the most far-red-shifted LWC being present only in the PS I trimers have no significant impact on the observed kinetics.
The temperature dependence of P700 photooxidation upon excitation at 785 nm has been analyzed in the range from 8 K up to 160 K using PS I trimers from T. elongatus. The yield divided by the maximum yield obtained with white light illumination is depicted as a function of the duration of excitation for different temperatures in Figure 8. A minor increase of the rate of P700+• formation with increasing temperature is recognizable. The half-life decreases by about a factor of 3 when the temperature is raised from 8 to 160 K. The half-lives and relative yields for all experimental conditions are summarized in Table 2.
Figure 8.
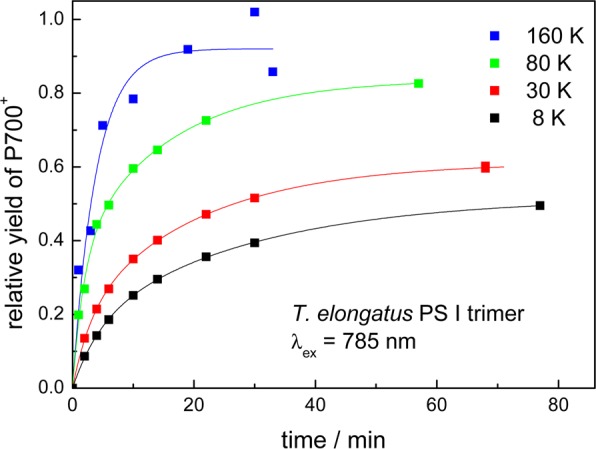
Yields of P700+• photoaccumulation upon selective 785 nm excitation in PS I trimers from T. elongatus detected by EPR at different temperatures as a function of the duration of excitation. The yields are divided by the maximum yield obtained with white light illumination. The solid lines are the result of a biexponential fit.
Table 2. Relative Yields and Half-Lives of P700+• Accumulation by Far-Red Excitation Determined by EPR Measurements.
| λex (nm) | T (K) | rel. yield | half-life/min |
|---|---|---|---|
| T. elongatus PS I Trimer | |||
| 754 | 30 | 0.64 | 19 |
| 785 | 160 | 0.92 | 3 |
| 80 | 0.84 | 4 | |
| 30 | 0.61 | 7 | |
| 8 | 0.52 | 10 | |
| 808 | 80 | 0.46 | 8 |
| 30 | 0.40 | 9 | |
| 8 | 0.29 | 11 | |
| A. platensis PS I Trimer | |||
| 754 | 30 | 0.68 | 5 |
| 785 | 30 | 0.81 | 10 |
| 808 | 30 | 0.54 | 6 |
| A. platensis PS I Monomer | |||
| 754 | 30 | 0.76 | 5 |
| 808 | 30 | 0.38 | 6 |
Photooxidation of P700 by Far-Red Light at Cryogenic Temperatures Studied by Absorption Difference Spectroscopy
Characteristic absorbance difference spectra have been assigned in the literature to the formation of the charge separated state P700+•FA/B–• at low temperature.3,29,41 To obtain the difference spectra, the absorbance spectrum before illumination (dark) is subtracted from that measured after illumination. Only the pigment that changed its electronic state and pigments, which are coupled to this pigment, contribute to the difference spectrum. The main contributions are (a) an absorption decrease by the depopulation of the ground state and (b) a very broad and featureless absorption increase in the red and near-infrared region due to the formation of a chlorophyll radical cation. In addition, there are contributions from electrochromic band shifts induced by the positive charge localized on oxidized P700 and the negative charge located on FA/B.
Figure 9 shows light-minus-dark absorbance difference spectra of trimeric PS I complexes from T. elongatus measured at 5 K induced by illumination of various periods of time with far-red light at 754 nm (top), 785 nm (middle) and 808 nm (bottom). The curves denoted “dark” show the difference between two absorbance spectra of the dark-adapted sample measured directly one after the other. These dark-minus-dark spectra are identical within the error limits to the zero line. This clearly demonstrates that photochemical reactions caused by the measuring light in the spectrophotometer are negligible. The light-minus-dark difference spectra were obtained by subtracting the absorbance spectrum of PS I in the dark-adapted state (with P700 reduced) from those after far-red illumination for the period indicated. Already after 10 min illumination, the characteristic features assigned to the formation of P700+•FA/B–• at 5 K are visible: a broad bleaching at 703 nm, a narrow positive band at 698.5 nm, a small negative band at 696 nm, and a strong absorbance increase at 690 nm.3,29
Figure 9.
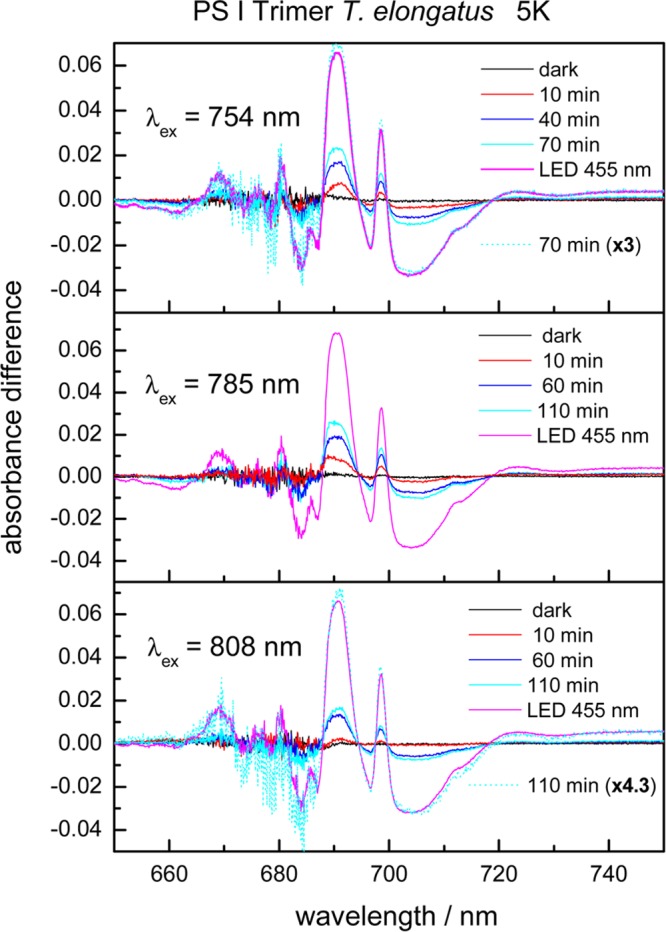
Light-minus-dark absorbance difference spectra of PS I trimers of T. elongatus at 5 K measured after selective excitation at 754 nm, 785 or 808 nm and different illumination periods. The difference spectra were obtained by subtracting the absorbance spectra in the dark-adapted state from those measured after selective excitation. The curves denoted “dark” show the difference between two absorbance spectra of the dark-adapted sample measured directly one after the other. The curve denoted “LED 455 nm” is the difference between the absorbance spectra in the dark-adapted state and those measured after illumination by 455 nm LED light.
Below 690 nm, the difference spectra are rather noisy due to the strong absorption of about 3 around the maximum in the QY absorption region. The chlorophyll concentration of the samples has been optimized for the wavelength region above 690 nm. Illumination by 455 nm LED light induces the maximal absorbance changes that can be induced by visible actinic light due to an irreversible charge separation in a fraction of the PS I complexes.30,31 Excitation with 50 flashes of a Xe-flash lamp or white light from a tungsten halogen lamp gives always the same maximum absorbance change as with 455 nm LED light. To determine the relative yield of P700+• formation in PS I of different organisms at different excitation wavelengths and temperatures, the absolute values of the amplitudes at 691 and 703 nm were added and divided by the maximum value after irradiation with visible actinic light calculated in the same way. A relative yield of about 35% was achieved by selective excitation at 754 and 785 nm, whereas by 808 nm actinic light a somewhat smaller value of 24% was reached (see Table 3).
Table 3. Relative Yields of P700+• Accumulation by Far-Red Excitation Determined by Absorbance Difference Spectroscopy.
| relative yield of PS I of T. elongatus |
|||
|---|---|---|---|
| λex (nm) | T (K) | trimers | monomers |
| 754 | 5 | 0.34 | 0.36 |
| 78 | 0.57 | 0.49 | |
| 785 | 5 | 0.35 | 0.28 |
| 78 | 0.64 | 0.38 | |
| 808 | 5 | 0.24 | – |
| 78 | 0.39 | 0.39 | |
| relative yield of PS I of A. platensis |
|||
|---|---|---|---|
| λex (nm) | T (K) | trimers | monomers |
| 754 | 5 | 0.44 | 0.51 |
| 78 | 0.87 | 0.51 | |
| 785 | 5 | 0.46 | 0.32 |
| 78 | 0.66 | 0.52 | |
| 808 | 5 | 0.29 | 0.16 |
| 78 | 0.53 | 0.36 | |
A remarkable feature of the spectra presented in Figure 9 is that the shape of the (P700+• – P700) difference spectrum is virtually identical for far-red actinic light and visible actinic light. To demonstrate this, we replotted in Figure 9 the difference spectrum obtained upon excitation at 754 nm (70 min) or 808 nm (110 min) multiplied by a factor of 3 or 4.3 (see cyan-colored dotted curves in Figure 9 top and bottom). Light-minus-dark absorbance difference spectra induced by far-red illumination have also been measured at 78 K (not shown).
Figure 10 shows light-minus-dark absorbance difference spectra induced by far-red illumination (λex = 808 nm) of PS I trimers (top) and monomers (bottom) from A. platensis. The spectra exhibit the characteristic features assigned to the formation of P700+•FA/B–• at 5 K (top) and 78 K (bottom).41 The sharp features are less resolved at 78 K due to broadening of the bands with increasing temperature. The following differences to the (P700+• – P700) difference spectrum of T. elongatus are noteworthy: (1) the maximum bleaching is located about 3 nm more to the red at 706 nm; (2) the zero crossing on the long-wavelength side of the bleaching is at 728 nm compared to 718 nm for T. elongatus; and (3) the amplitudes of the positive peaks are considerably smaller. It is important to mention that also in the case of A. platensis the shape of the (P700+• – P700) difference spectrum is virtually identical for far-red actinic light and visible actinic light.
Figure 10.
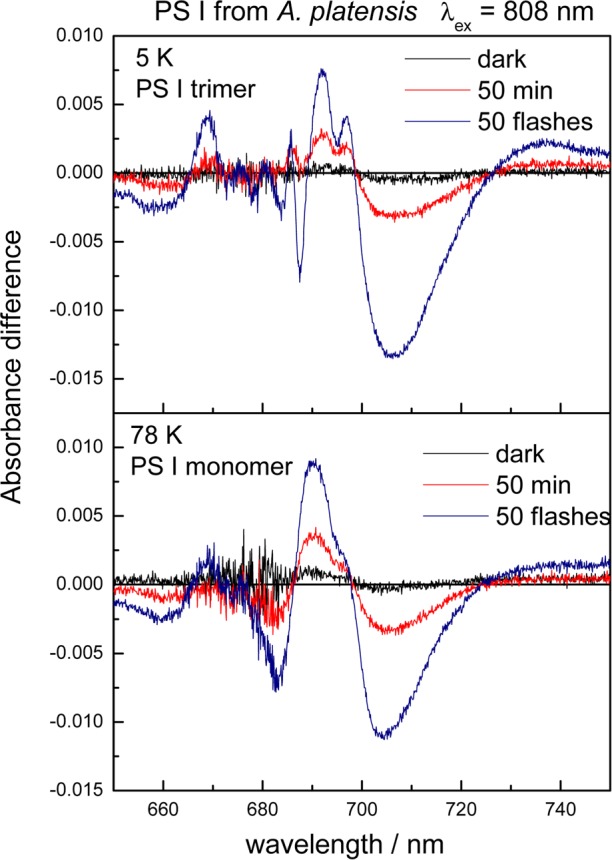
Light-minus-dark absorbance difference spectra induced by far-red illumination (λex = 808 nm) of PS I trimers at 5 K (top) and monomers at 78 K (bottom) from A. platensis. The difference spectra were obtained by subtracting the absorbance spectra in the dark-adapted state from those measured after 808 nm excitation. During illumination with 808 nm light, an interference filter (AL804 from Schott) was placed directly in front of the cuvette. The curves denoted “dark” show the difference between two absorbance spectra of the dark-adapted sample measured directly one after the other. The curves denoted “50 flashes” is the difference between the absorbance spectra in the dark-adapted state and those measured after illumination by 50 saturating flashes from a Xe-flash lamp.
The relative yields of P700+• formation in PS I from T. elongatus and A. platensis upon excitation at 754, 785, and 808 nm are summarized for 5 and 78 K in Table 3. The values in Table 3 represent the maximum yields and are, in general, the average of several measurements. The relative yields of P700+• formation at 78 K are always higher than those at 5 K (see Table 3). The temperature dependence is, however, very low. The yield decreases by less than a factor of 2, when the temperature is lowered from 78 to 5 K. The yields of P700+• formation upon far-red excitation are very similar for PS I monomers and trimers of A. platensis taking into account a certain margin of error.
In summary, the experiments obtained by absorbance difference spectroscopy clearly confirm the formation of P700+•FA/B–• at cryogenic temperatures and are in very good agreement with those obtained by EPR spectroscopy.
Discussion
In this work clear evidence has been presented that far-red light with a wavelength of up to 810 nm can induce the photochemical charge separation in PS I from T. elongatus and A. platensis for temperatures ranging from 295 to 5 K.
This result is quite remarkable because the energy of a photon in the far-red lies significantly below the transition energy between the ground state and the lowest excited singlet state of the reaction center chlorophylls (≅700 nm), from where the primary charge separation starts. The difference corresponds to 127 meV for a photon at 754 nm and even 237 meV for a photon at 808 nm. These figures should be compared with the thermal energy kT, that amounts to 25 meV at 295 K, 6.9 meV at 80 K, and only 0.43 meV at 5 K.
Due to the very low absorbance of PS I above 750 nm, it is quite difficult to provide evidence for far-red light-induced photochemistry. We used experimental conditions, where the photooxidized P700 is long-lived or stable, i.e. P700+• can be accumulated by continuous illumination. The photoaccumulated P700+• has been detected with very high sensitivity by absorbance difference spectroscopy and EPR.
Whereas absorption in the range between 700 and 750 nm has been assigned to the absorption of long-wavelength chlorophylls, e.g. C719 in PS I trimers from T. elongatus or C740 in PS I trimers from A. platensis, so far there are no indications in the literature for absorption of PS I above 750 nm up to 810 nm. It should be noted that the EPR signal due to the oxidation of P700 could be detected at 30 K even upon illumination with monochromatic laser light at 830 nm (HL 8318G from Hitachi) (see Figure S2 of the SI). This implies that PS I has some absorption at least up to 830 nm.
A weak and featureless absorption of PS I samples, which extends up to 850 nm, could be identified using highly concentrated PS I samples (see section 3.1). The absorption above 750 nm is less than 0.1% of the value of the maximum absorbance in the QY-region at 680 nm. It is not clear how the weak and broad absorption of PS I in the far-red region can be explained. On the basis of theoretical work on the role of charge-transfer transitions in the optical properties of bacterial reaction centers42−47 and photosystem II,48 we propose that the very broad and weak absorption in the far-red region of PS I can be assigned to the mixing of exciton and charge-transfer (CT) states in the reaction center of PS I. CT-coupling has to be taken into account, if the chromophores are located close together. According to the 2.5 Å structural model of PS I from T. elongatus, the edge-to-edge distance between neighboring chlorophylls, PA–PB, PA–Acc-B, PB–Acc-A, Acc-A–A0–B and Acc-B–A0–A is less than 3.5 Å, where electron exchange effects start to appear.19
Under white light excitation, electron transfer (ET) in PS I is highly efficient and occurs with a quantum efficiency near unity. From the weak temperature dependence of primary ET it can be assumed that electron transfer through PS I occurs in the activationless regime of ET. This is illustrated in Scheme 2 where the free energy surfaces are shown. The RC* surface represents the excited state of the reaction center chlorophylls, from where electron transfer starts. The RP1 and P700+•A0–• surfaces correspond to an intermediate radical pair state, RP1, and the secondary radical pair, P700+•A0–•. The assignment of the intermediate state to molecular entities depends on details of the primary reactions, in particular on the identity of the primary electron donor, that are still under discussion. If the special pair is the primary electron donor, RP1 corresponds to the state P700+•Acc–•; if the accessory chlorophyll is the primary electron donor, RP1 would correspond to Acc+•A0–•. Our results can best be explained by assuming that there is a charge transfer (CT) state, which is optically active (borrowing oscillator strength from excited states of the RC chlorophylls47) and is connected to RP1 or P+•A0–• (in Scheme 2 it is connected to P+•A0–•). After direct excitation of the CT state and fast vibrational relaxation, the transition from the CT state to P+A0– can occur in a thermally activated manner at the crossing point of the two free energy surfaces, requiring sufficiently high temperatures, or by nuclear tunneling in the normal region of ET (see solid red line in Scheme 2). This CT state might either be an internal CT state of the special pair or one of the states P+•Acc–•, Acc+•A0–•, which is not RP1.
Scheme 2. Free Energy Surfaces of the Electron Transfer Chain, the Electronic Ground State and the Additional CT State Postulated in the Present Work.
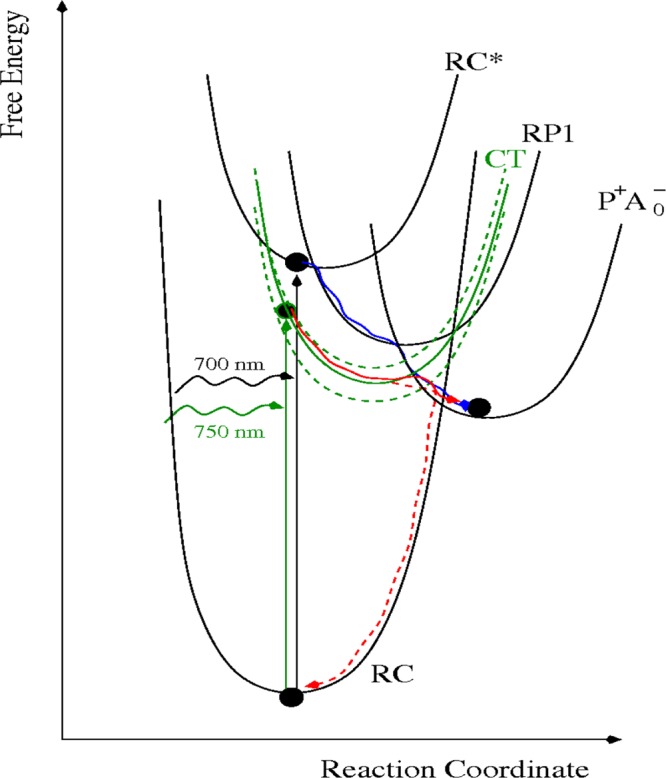
The green dashed lines indicate that there is a broad inhomogeneous distribution of the CT state. The blue solid line illustrates activation less forward ET, the red solid line, thermally activated ET, and the red dashed line, charge recombination by nuclear tunneling.
Due to its polar nature, the CT state couples strongly to the protein, and, therefore, experiences a large homogeneous47 and inhomogeneous broadening, which are illustrated in Scheme 2 by the large displacement of the CT free energy surface with respect to that of the ground state P, and by the additional free energy curves (shown as green dashed lines), respectively. Charge recombination from the CT state to the ground state P of the RC occurs in the inverted regime of ET, where nuclear tunneling is assumed to dominate the rate, as illustrated by the red dashed line in Scheme 2. The branching ratio between the ET reactions to P+•A0–• and recombination to P is expected to depend on temperature, since tunneling is temperature independent and forward ET is more easily accelerated than charge recombination. Please note that in Scheme 2 the free energy curves of the CT- and ground state (labeled RC) cross at higher free energies than those between CT and P+•A0–•.
Scheme 2 explains two important results of our study, namely (i) why the relative yield of P+ accumulation gets smaller with longer excitation wavelengths and (ii) why the half-lives of P+ photoaccumulation are longer at low T. Concerning (i) most likely the inhomogeneous distribution of CT free energies is responsible for a smaller number of PS I complexes in which resonant excitation of the CT state can occur at longer wavelengths, whereas the large homogeneous broadening is responsible for the fact that low energy CT states can still absorb high-energy photons. Please note that the minimum energy, a photon has to have in order to be absorbed, is given by the difference in minimum free energy values between the CT and the ground state free energy surfaces. Concerning (ii) most likely two effects are important. First, far-red excitation at room temperature can lead to absorbance by LWCs and subsequent uphill energy transfer and charge separation. Second, we have to consider direct excitation of the CT state in the RC and how the branching ratio of subsequent ET to P+•A0–• and recombination to P depends on temperature. At very low temperatures nuclear tunneling49 is the only possible mechanism for both reactions. At higher temperatures, thermally activated ET sets in, proceeding through the crossing region of the potential energy curves. The increase of the rate for the ET reaction CT → P+A0– (the red line in scheme 2) is, however, expected to be stronger than that of the recombination because of the smaller free energy of activation. Hence at higher temperatures the ET/recombination branching ratio for the CT state is higher and, therefore, P700+• can be accumulated in a shorter time than at low temperatures.
Finally, we note that thermal relaxation is assumed to be fast in standard theories of nonadiabatic ET, as was done also in Scheme 2. However, recent experiments on the reaction center of purple bacteria50 show that there are slow relaxation processes involved in primary ET, that in the past have often be considered phenomenologically by assuming time-dependent free energy curves. It might well be that these slow relaxation processes change the ET/recombination branching ratio for the CT state in Scheme 2, since, e.g., also at low T the transition states between CT and P+A0– and between CT and P may be reached before nuclei are thermally relaxed. We would, however, still expect an onset of thermal activation at higher temperatures and, therefore, our explanation will remain essentially valid. Our model, although so far rather qualitative, can explain the observed electron transfer upon far-red excitation as well as its temperature dependent rate and yield. A more elaborate theoretical study is under way.
One, at first glance, simpler suggestion would be that that there is some residual absorbance of the low energy exciton state of P700 in the far red that may lead to a direct excitation and electron transfer from P700* in the usual way. In our opinion, this proposal can be rejected, as will be discussed in the following.
Assuming that the QY absorbance band of P700 is inhomogeneously broadened and considering a Gaussian distribution function of 20 nm width (estimated from the optical difference spectra in Figures 9 and 10) leads to a negligible absorbance at 808 nm that is by far too low to explain our experimental results. Assuming, on the other hand, that the P700 band is homogeneously broadenend one has to consider two scenarios:
(i) The band at 700 nm corresponds to the 0–0 transition, which is broadened by primary electron transfer. Assuming a primary electron transfer time constant of 100 fs, which represents the lower limit of time constants discussed in the literature for this process, would result in a Lorentzian line shape with a lifetime broadening of about 2 nm (half-width) that is much too small to explain the far red absorbance detected in our experiments.
(ii) Assuming that the optical band assigned to P700 is a vibrational sideband of an optical transition with strong electron-vibrational coupling, as it may be the case for a mixed exciton/CT state,19,48 the corresponding 0–0 transition could lie in the far red, e.g., at 800 nm, in principle. However, the optical difference spectra do not show any band that reaches up to such long wavelengths. Therefore, the coupling weighted density of vibrational states of the protein, the spectral density, would have to exhibit a considerable gap at low and intermediate frequencies. Neither line-narrowing experiments51 nor microscopic simulations52 have revealed any support for such a spectral density of a pigment–protein complex. Finally, we note that the excitonic coupling between the special pair and the remaining RC pigments is below 100 cm–1 (see ref.53). Therefore, it can be excluded that excitonic mixing between RC* and other excited states of the RC can give rise to far red absorbing states.
Role of Long-Wavelength Chlorophylls
To clarify the role of long-wavelength chlorophylls, the studies on charge separation in PS I by selective far-red excitation were performed with monomeric and trimeric PS I complexes from T. elongatus and A. platensis, which have a different content of LWCs. Low temperature absorption spectra in the range between 700 and 750 nm indicate that both the spectral position and the number of long-wavelength chlorophylls are different (see Introduction and Figure S1 in SI). A thermal activated uphill energy transfer between the red chlorophylls and the reaction center is impossible at low temperatures. In principle, it seems possible that the charge separation may occur directly from the excited LWC mediated by P700* via a superexchange mechanism, as has been proposed for the LH1-RC system of purple bacteria.39,40 If so, we would expect a difference in P700+• accumulation at cryogenic temperatures between species with different content of LWC.
A comparison of the results obtained at cryogenic temperatures with the different PS I samples provides no evidence for significant differences (see Figures 7, 9, and 10 and Tables 2 and 3). The rise of the EPR signal at 30 K, i.e. the rate of P700 oxidation by selective excitation, is in all investigated PS I samples almost identical.
The time until half of the extrapolated maximum yield is reached, is the same (5 min at 754 nm and 6 min at 808 nm) for monomeric and trimeric PS I from A. platensis. Please keep in mind that the photon flux density at 808 nm is about 17 times greater than at 754 nm. With PS trimers from T. elongatus, the corresponding half-lives are 19 min at 754 nm and 9 min at 808 nm. The slightly slower kinetics can, however, not be attributed to differences in the content of long-wavelength Chls, which lies between that of PS I monomers and PS I trimers from A. platensis.
Furthermore, the relative yields of P700+• formation at cryogenic temperatures do not reveal significant differences between the monomeric and trimeric PS I complexes from A. platensis and T. elongatus. It is remarkable that the maximum yields of P700+• formation upon far-red excitation at cryogenic temperatures are only about 30 to 80% of the yields obtained by white light illumination. According to our model (Scheme 2), there is a distribution of CT states, where only those with a minimum free energy difference smaller than the photon energy can absorb a photon. Since at cryogenic temperatures there is not enough thermal energy for the protein to cycle through its conformational substates, the system behaves nonergodic, and the free energy surfaces of the ensemble of complexes do not change in the course of the experiment. Therefore, at low T the relative yield of photoaccumulation decreases with increasing wavelength, because fewer and fewer complexes are able to get their CT state excited.
The investigations by absorption difference spectroscopy show also no significant dependence of P700 oxidation by far-red excitation on the content of LWC. We therefore conclude that the photochemistry at cryogenic temperatures is not induced by the absorption of a photon by LWCs. As a consequence, a direct charge separation from an excited long-wavelength Chl, which is mediated by P700* assuming a superexchange mechanism, can be ruled out. For the same reason, energy transfer from excited LWC to the CT-state can be ruled out. Most likely, the latter process is not efficient because of the very low dipole strength of the CT-transition.
At room temperature, the rate of P700 oxidation by far-red light clearly depends on the content and the spectral characteristics of long-wavelength Chls. The fastest rise of the absorbance increase at 826 nm due to the oxidation of P700 is observed with PS I trimers from A. platensis containing the LWCs C708 and C740, followed by PS I trimers from T. elongatus containing the LWCs C708 and C719. In PS I monomers from A. platensis, containing only C708, the rate of P700 oxidation is slower by a factor of about 4.5 upon 754 nm excitation, by a factor of about 1.6 upon 785 nm excitation, and by a factor of about 1.1 upon 808 nm excitation.
This result is most easily explained by the assumption that (a) most of the 754 nm far-red light is absorbed by the long-wavelength chlorophylls C740 and that (b) the excitation of C740 leads to a charge separation at room temperature—in addition to the direct excitation of the charge transfer state. After excitation of the LWC, most probably a thermally activated energy transfer occurs from the LWC to the reaction center (uphill energy transfer). In this case, photochemistry starts from the lowest excited exciton state of the reaction center. In agreement with earlier reports 3, the estimated quantum yield for charge separation is surprisingly high at 754 nm (about 100%) at room temperature.
Temperature and Wavelength Dependence of the Rate of P700+• Photoaccumulation by Far-Red Excitation
At cryogenic temperatures, the time course of P700+• photoaccumulation by far-red excitation has been monitored by the increase of the EPR signal assigned to P700+• (see Figures 6–8). The results show that the rate is almost temperature independent between 80 and 8 K. The half-lives increase by a maximum factor of 2–3, when the temperature is reduced from 80 to 8 K (see Table 2).
At room temperature, the measured half-lives are significantly shorter than those at cryogenic temperatures. Table 4summarizes the half-lives of P700+• photoaccumulation by far-red excitation at room temperature and 30 K. All measured half-lives have been normalized to the photon flux per cm2, which was used in the EPR experiments with 754 nm excitation. At 30 K the formation of P700+• was monitored by EPR, whereas at room temperature the absorbance increase at 826 nm was detected.
There are two points worth mentioning: (a) The largest increase of the half-life by a factor of 300–400 is observed with PS I trimers upon 754 nm excitation. (b) The lowest increase by a factor of only 10–20 is observed upon excitation at 808 nm.
Upon excitation at 808 nm, clearly outside the LWC absorption bands, the charge separation starts most likely by direct excitation of a charge transfer state. According to our model (Scheme 2), the branching ratio of forward ET and recombination from the postulated CT state depends on temperature. At higher temperatures, thermal activation of ET (which occurs in the normal region of ET) is favored over charge recombination (which occurs as nuclear tunneling in the inverted region). Therefore, the state P700+• is accumulated in a shorter time at higher temperatures.
Upon excitation at 754 nm, there are probably two charge transfer pathways at room temperature: (a) excitation of LWCs and thermally activated uphill energy transfer to the reaction center, where the electron transfer starts and (b) charge separation induced by excitation of the inferred charge-transfer state. At cryogenic temperatures a thermal activated uphill energy transfer between the red chlorophylls and the reaction center is impossible and only reaction pathway (b) is possible. This would explain that the rate of P700+• photoaccumulation decreases stronger with decreasing temperature upon excitation at 754 nm compared to excitation at 808 nm.
One of the remarkable features of photosynthetic systems is the high quantum yield for photochemistry close to 100% for visible light (400–700 nm) at room temperature. Upon far-red excitation, we determined a quantum yield of nearly 100% for 754 nm excitation, about 80% for 785 nm excitation, and still 9% for 808 nm excitation for PS I trimers from T. elongatus at room temperature. According to our proposed model, the quantum yield is influenced by several parameters.
By illumination at 808 nm, clearly outside the P700 and the LWC absorption bands, only the proposed charge transfer state can be excited. The low quantum yield of about 9% for charge separation from the excited CT state is explained in our model by an unfavorable relation of forward electron transfer over a small barrier (thermally activated through the crossing region of the potential energy curves) and charge recombination to the ground state of P700.
With decreasing wavelength, energetically higher-lying CT states within the inhomogeneous distribution of CT states are excited (see Scheme 2). The energy barrier decreases for the energetically higher-lying states, and consequently, the branching ratio between forward electron transfer and recombination becomes larger, resulting in a higher quantum yield at shorter wavelength, e.g. 785 or 754 nm.
Illumination at 754 nm leads additionally to excitation of long-wavelength chlorophylls from which, at room temperature, uphill energy transfer to P700* occurs. Also for this process, the quantum yield for subsequent charge separation has been reported3 to be close to 100%.
Interestingly, also at low T the quantum yield of charge separation drops somewhat with increasing excitation wavelength, as can be estimated from the half-lives of P700+• photoaccumulation measured by EPR at 30 K (see part a of Table 4). At low temperatures, the rates of forward electron transfer and charge recombination are determined by nuclear tunneling. The branching ratio between both pathways becomes smaller for the energetically lower-lying CT states, within the inhomogenous distribution of CT states. In Scheme 2 this effect can be expected by noting that the overlap of vibrational wave functions between the CT state and the P700+•A0–• state becomes smaller for lower CT state energies (larger separation on the reaction coordinate), whereas the overlap with the vibrational wave functions of the ground state changes much less, since the latter is deeply in the inverted region of electron transfer.
Conclusion
In summary, this contribution reports the surprising finding that far-red excitation can induce charge separation in PS I even at low temperature. It is interesting to note that thereby the energy efficiency of this process increases by about 20%. However this benefit is lost by a dramatic drop in the quantum yield. The latter effect is explained by a model involving an energy barrier between an optically active CT state and charge separated states of the ordinary electron transfer pathway. Under suitable environmental conditions, i.e., when mostly far red light is available, evolution could increase the efficiency of charge separation from the proposed CT state by tuning the pigment–protein coupling in such a way that the above barrier is removed.
Such a mechanism may be present also in other photosystems and more general even in chemical systems capable of photoinduced electron transfer processes in general.
Acknowledgments
Financial support by Heisenberg-Program (BR 4102/1-1 and BR 4102/2-1 to M.B.), the Russian Academy of Sciences, program MCB and RFBR (Grant 14-04-00148a to N.V.K.) and the Austrian Science Fund (FWF) (Grant P 24774-N27 to T.R.) is gratefully acknowledged.
Supporting Information Available
Absorbance spectra at T = 5 K from the PS I samples used in this study, EPR spectra showing that excitation even at 830 nm induces the formation of P700+•. This material is available free of charge via the Internet at http://pubs.acs.org.
Author Present Address
¶ Zürich University of Applied Science (ZHAW), School of Engineering, Technikumstrasse 9, 8400 Winterthur, Switzerland.
The authors declare no competing financial interest.
Supplementary Material
References
- Kleinherenbrink F. A. M.; Deinum G.; Otte S. C. M.; Hoff A. J.; Amesz J. Biochim. Biophys. Acta 1992, 1099, 175. [PubMed] [Google Scholar]
- Shubin V. V.; Bezsmertnaya I. N.; Karapetyan N. V. J. Photochem. Photobiol., B. 1995, 30, 153. [Google Scholar]
- Pålsson L - O.; Flemming C.; Gobets B.; van Grondelle R.; Dekker J. P.; Schlodder E. Biophys. J. 1998, 74, 2611. [DOI] [PMC free article] [PubMed] [Google Scholar]
- Pettai H.; Oja V.; Freiberg A.; Laisk A. Biochim. Biophys. Acta 2005, 1708–311. [DOI] [PubMed] [Google Scholar]
- Hughes J. L.; Smith P.; Pace R.; Krausz E. Biochim. Biophys. Acta 2006, 1757–841. [DOI] [PubMed] [Google Scholar]
- Thapper A.; Mamedov F.; Mokvist F.; Hammarström L.; Styring S. Plant Cell 2009, 21, 2391. [DOI] [PMC free article] [PubMed] [Google Scholar]
- Abbreviations: A0, primary electron acceptor in PS I; A1, secondary electron acceptor in PS I (a phylloquinone); Chl a, chlorophyll a; Chl a', C-13 epimer of Chl a; Cxxx, Chl absorbing at xxx nm; CT, charge transfer, ET, electron transfer; FeS, iron-sulfur cluster; FX, FA and FB, three [4Fe-4S] clusters in PS I; Fxxx, fluorescence with an emission maximum at xxx nm; LWC, long-wavelength chlorophyll(s); P700 (P700+•), primary electron donor of PS I in the reduced (oxidized) state; PMS, phenazine methosulfate; PS I (PS II), photosystem I (photosystem II); tricine, N-[2-hydroxy-1,1- bis(hydroxymethyl)ethyl]glycine; RC, reaction center.
- Karapetyan N. V.; Schlodder E.; van Grondelle R.; Dekker J. P. In Photosystem I: The Light-Driven Plastocyanin:Ferredoxin Oxidoreductase; Golbeck J. H., Ed; Springer: Dordrecht, The Netherlands, 2006; p 177. [Google Scholar]
- Gobets B.; van Grondelle R. Biochim. Biophys. Acta 2001, 1507, 80. [DOI] [PubMed] [Google Scholar]
- Brettel K. Biochim. Biophys. Acta 1997, 1318, 322. [Google Scholar]
- Golbeck J. H., Ed. Photosystem I: The Light-Driven Plastocyanin:Ferredoxin Oxidoreductase; Springer: Dordrecht, The Netherlands, 2006. [Google Scholar]
- Boekema E. J.; Dekker J. P.; van Heel M. G.; Roegner M.; Saenger W.; Witt I.; Witt H. T. FEBS Lett. 1987, 217, 283. [Google Scholar]
- Shubin V. V.; Tsuprun V. L.; Bezsmertnaya I. N.; Karapetyan N. V. FEBS Lett. 1993, 334, 79. [DOI] [PubMed] [Google Scholar]
- Kruip J.; Bald D.; Boekema E. J.; Rögner M. Photosynth. Res. 1994, 40, 279. [DOI] [PubMed] [Google Scholar]
- Boekema E. J.; Jensen P. E.; Schlodder E.; van Breemen J. F. L.; van Roon H.; Scheller H. V.; Dekker J. P. Biochemistry 2001, 40, 1029. [DOI] [PubMed] [Google Scholar]
- Jordan P.; Fromme P.; Witt H. T.; Klukas O.; Saenger W.; Krauss N. Nature 2001, 411, 909. [DOI] [PubMed] [Google Scholar]
- Amunts A.; Toporik H.; Borovikova A.; Nelson N. J. Biol. Chem. 2010, 285, 3478. [DOI] [PMC free article] [PubMed] [Google Scholar]
- Rappaport F.; Diner B. A.; Redding K. In Photosystem I: The Light-Driven Plastocyanin:Ferredoxin Oxidoreductase; Golbeck J. H., Ed; Springer: Dordrecht, The Netherlands, 2006; p 233. [Google Scholar]
- Witt H.; Schlodder E.; Teutloff C.; Niklas J.; Bordignon E.; Carbonera D.; Kohler S.; Labahn A.; Lubitz W. Biochemistry 2002, 41, 8557. [DOI] [PubMed] [Google Scholar]
- Madjet M. E.; Müh F.; Renger T. J. Phys. Chem. B 2009, 113, 12603. [DOI] [PubMed] [Google Scholar]
- Holzwarth A. R.; Müller M. G.; Niklas J.; Lubitz W. Biophys. J. 2006, 90, 552. [DOI] [PMC free article] [PubMed] [Google Scholar]
- Müller M. G.; Slavov C.; Luthra R.; Redding K. E.; Holzwarth A. R. Proc. Natl. Acad. Sci. U.S.A 2010, 107, 4123. [DOI] [PMC free article] [PubMed] [Google Scholar]
- Fromme P.; Schlodder E.; Jansson S. In Light Harvesting Antennas in Photosynthesis; Green B. R., Parson W. W., Eds.; Kluwer Academic Press: Dordrecht, The Netherlands, 2003; p 253. [Google Scholar]
- Wientjes E.; Croce R. Biochem. J. 2010, 433, 447. [DOI] [PubMed] [Google Scholar]
- Schlodder E.; Cetin M.; Byrdin M.; Terekhova I. N.; Karapetyan N. V. Biochim. Biophys. Acta 2005, 53, 1706. [DOI] [PubMed] [Google Scholar]
- Shubin V. V.; Murthy S. D. S.; Karapetyan N. V.; Mohanty P. Biochim. Biophys. Acta 1991, 28, 1060. [Google Scholar]
- Trissl H.-W. Photosynth. Res. 1993, 35, 247. [DOI] [PubMed] [Google Scholar]
- Karapetyan N. V. Photosynth. Res. 2008, 97, 195. [DOI] [PubMed] [Google Scholar]
- Fromme P.; Witt H. T. Biochim. Biophys. Acta 1998, 1365, 175. [DOI] [PubMed] [Google Scholar]
- El-Mohsnawy E.; Kopczak M. J.; Schlodder E.; Nowaczyk M.; Meyer H. E.; Warscheid B.; Karapetyan N. V.; Rögner M. Biochemistry 2010, 49, 4740. [DOI] [PubMed] [Google Scholar]
- Setif P.; Mathis P.; Vänngard T. Biochim. Biophys. Acta 1984, 767, 404. [Google Scholar]
- Schlodder E.; Falkenberg K.; Gergeleit M.; Brettel K. Biochemistry 1998, 37, 9466. [DOI] [PubMed] [Google Scholar]
- Mathis P.; Sétif P. Isr. J. Chem. 1981, 21, 316. [Google Scholar]
- Jordan R.; Nessau U.; Schlodder E. In Photosynthesis: Mechanisms and Effects; Garab G., Ed.; Kluwer Academic Publishers, Dordrecht, 1998; p 663. [Google Scholar]
- Byrdin M.; Jordan P.; Krauss N.; Fromme P.; Stehlik D.; Schlodder E. Biophys. J. 2002, 83, 433. [DOI] [PMC free article] [PubMed] [Google Scholar]
- Lubitz W. In Chlorophylls; Scheer H., Ed., CRC Press: Boca Raton, FL; 1991, p 903. [Google Scholar]
- Käß H.; Fromme P.; Witt H. T.; Lubitz W. J. Phys. Chem. B 2001, 105, 1225. [Google Scholar]
- Brettel K.; Siekmann I.; Fromme P.; van der Est A.; Stehlik D. Biochim. Biophys. Acta 1992, 1098, 266. [Google Scholar]
- Kamlowski A.; van der Est A.; Fromme P.; Stehlik D. Biochim. Biophys. Acta 1997, 1319, 185. [DOI] [PubMed] [Google Scholar]
- Sumi H. J. Phys. Chem. B 2002, 106, 13370. [Google Scholar]
- Sumi H. J. Phys. Chem. B 2004, 108, 11792. [DOI] [PubMed] [Google Scholar]
- Witt H.; Bordignon E.; Carbonera D.; Dekker J. P.; Karapetyan N. V.; Teutloff C.; Webber A.; Lubitz W.; Schlodder E. J. Biol. Chem. 2003, 278, 46760. [DOI] [PubMed] [Google Scholar]
- Warshel A.; Parson W. W. J. Am. Chem. Soc. 1987, 109, 6143. [Google Scholar]
- Warshel A.; Parson W. W. J. Am. Chem. Soc. 1987, 109, 6152. [Google Scholar]
- McDowell L. M.; Kirmaier C.; Holton D. Biochim. Biophys. Acta 1990, 1020, 230. [Google Scholar]
- Lathrop E. J. P.; Friesner R. A. J. Phys. Chem. 1994, 98, 3050. [Google Scholar]
- Zhou H.; Boxer S. G. J. Phys. Chem. B 1997, 101, 5759. [Google Scholar]
- Renger T. Phys. Rev. Lett. 2004, 93, 188101. [DOI] [PubMed] [Google Scholar]
- Novoderezhkin V. I.; Dekker J. P.; van Grondelle R. Biophys. J. 2007, 93, 1293. [DOI] [PMC free article] [PubMed] [Google Scholar]
- Jortner J. J. Chem. Phys. 1976, 64, 4860. [Google Scholar]
- Wang H.; Lin S.; Allen J. P.; Williams J. C.; Blankert S.; Laser C.; Woodbury N. W. Science 2007, 316, 747. [DOI] [PubMed] [Google Scholar]
- Kell A.; Feng X. M.; Reppert M.; Jankowiak R. J. Phys. Chem. B 2013, 117, 7317. [DOI] [PubMed] [Google Scholar]
- Renger T.; Klinger A.; Steinecker F.; Schmidt am Busch M.; Numata J.; Müh F. J. Phys. Chem. B 2012, 116, 14565. [DOI] [PMC free article] [PubMed] [Google Scholar]
- Adolphs J.; Mueh F.; Madjet M. E.-A.; Schmidt am Busch M.; Renger T. J. Am. Chem. Soc. 2010, 132, 3331. [DOI] [PubMed] [Google Scholar]
Associated Data
This section collects any data citations, data availability statements, or supplementary materials included in this article.


