

Abstract
MicroRNAs (miRNAs) are short non-coding RNAs that post-transcriptionally regulate gene expression. Hsa-miR-9 has been shown to have opposite functions in different tumour types; however, the underlying mechanism is unclear. Here we show that hsa-miR-9 is down-regulated in metastatic melanomas compared to primary melanomas. Overexpression of miR-9 in melanoma cells resulted in significantly decreased cell proliferation and migratory capacity with decreased F-actin polymerization and down-regulation of multiple GTPases involved in cytoskeleton remodelling. miR-9 overexpression induced significant down-regulation of Snail1 with a concomitant increase in E-cadherin expression. In contrast, knockdown of miR-9 increased Snail1 expression as well as melanoma cell proliferation and migration capacity. Mechanistically, miR-9 expression down-regulated NF-κB1 in melanoma and the effect was abolished by mutations in the putative miR-9 binding sites within the 3′-untranslated region (UTR) of NF-κB1. Anti-miR-9 miRNA inhibitor also increased the expression of NF-κB1. The effects of miR-9 on Snail1 expression and melanoma cell proliferation and migration were rescued by overexpression of NF-κB1 in these cells. Furthermore, miR-9 overexpression resulted in significantly decreased melanoma growth and metastasis in vivo. In summary, miR-9 inhibits melanoma proliferation and metastasis through down-regulation of the NF-κB1-Snail1 pathway. This study finds a new mechanism that miR-9 utilizes to decrease E-cadherin expression and inhibit melanoma progression. The results suggest that function of microRNAs is context and tumour type-specific.
Keywords: miR-9, NF-κB1, E-cadherin, Snail1, melanoma
Introduction
The incidence of cutaneous melanoma is increasing globally. Although early-stage melanoma is curable, patients with metastatic melanoma have a dismal prognosis [1,2]. Hence we need to understand the mechanism underlying melanoma metastasis and to develop new treatments for metastatic melanoma. MicroRNAs (miRNAs) represent a new class of small non-coding RNAs that can regulate gene expression by targeting the mRNAs that encode proteins. Several different miRNAs have been implicated in the pathogenesis of diverse cancer types [3–8]. During tumourigenesis and tumour progression, overexpressed miRNAs could potentially target and down-regulate tumour suppressor genes, whereas down-regulated miRNAs could potentially increase the expression of oncogenes.
In humans, the mature hsa-miR-9 transcript (miR-9) is produced by three independent genes: miR-9-1, miR-9-2, and miR-9-3, located on chromosomes 1, 5 and 15, respectively [9]. miR-9 is highly expressed in neural tissues and miR-9 expression is higher in brain tumours than in tumours of other histological types [10,11]. miR-9 has opposite functions in different types of cancers. For example, in breast tumours, miR-9 directly targets CDH1, the E-cadherin-encoding mRNA, to promote epithelial–mesenchymal transition (EMT) and stimulate the development of metastasis [12]. However, in human ovarian cancer, gastric adenocarcinoma, and medulloblastoma, miR-9 has been shown to inhibit tumour growth and metastasis [13–15], and miR-9 affects the metastatic potential of cervical cancer cells by coordinating the suppression of multiple genes controlling cell motility [16]. The different mechanisms underlying the opposing effects of miR-9 in different cancer types have not yet been elucidated.
Cancer cell motility and invasion involve a complex and integrated series of events that are primarily controlled by regulation of the actin cytoskeleton [17,18]. Regulation of actin polymerization controls the formation of protrusive structures that are essential for tumour cell movement and invasion, including filopodia, lamellipodia, and invadopodia. NF-κB1 is a robust marker of highly aggressive tumour cells and has been shown to be involved in cytoskeleton remodelling [19]. Snail1 is transcriptionally regulated by NF-κB1 and Snail1 is a potent inducer of EMT and tumour metastasis [20]. Snail1 protein plays a critical role in tumour progression and is a major transcription factor responsible for down-regulating E-cadherin expression [21]. The loss of E-cadherin expression converts cells from a non-motile phenotype to a motile phenotype that is more prone to invade other tissues [22].
Here we show that miR-9 is down-regulated in metastatic melanomas compared with primary melanomas. In addition, we show that miR-9 inhibits melanoma proliferation, migration, and metastasis. The tumour suppressor effect of miR-9 during melanoma progression is mediated through its direct binding to sites within the NF-κB1 3′-UTR, resulting in suppression of Snail1 and up-regulation of E-cadherin.
Materials and methods
Reagents and cell culture
Human melanoma cell lines (WM35, WM793, WM115A, and 1205Lu) were kind gifts from Meenhard Herlyn (The Wistar Institute). Human melanoma cell lines were maintained in 2% MCDB medium [23]. The human 293T cell line was kindly provided by Frank Lee at the University of Pennsylvania and was maintained in high glucose DMEM with 10% fetal bovine serum, penicillin/streptomycin (100 units/ml and 100 mg/ml). Nude mice were purchased from the Jackson Laboratory (Bar Harbor, ME, USA) and the animal protocol was approved by IACUC at the University of Pennsylvania. pSuper-miR-9 was kindly provided by Romano Regazzi (University of Lausanne) and the NF-κB1 constitutively active plasmid was kindly provided by Harikrishna Nakshatri (Indiana University).
Isolation RNA and quantitative PCR
Total RNA was isolated using the RNeasy Kit (Qiagen, Valencia, CA, USA) followed by cDNA synthesis using the SuperScript First-Strand Syntheis Sytem (Invitrogen, Carlsbad, CA, USA). Quantitative PCR was performed using the iQ™ SYBR green supermix (Bio-Rad Laboratories, Hercules, CA, USA) with specific primers (listed below). cDNA corresponding to 1 μg of RNA was added to the iQSYBER green supermix and analysed with iCYCLER (Bio-Rad Laboratories) according to the manufacturer’s instructions. The cycling conditions were 40 cycles of 95 °C for 30 s and 56 °C for 30 s. Melting curve analysis was carried out for each PCR reaction to confirm the specificity of amplification. At the end of each phase, fluorescence was used to qualify PCR product. Hsa-miR-9 and RNU6B Taqman® assays were purchased from Applied Biosystems (Foster City, CA, USA). The following primers were used: real-time PCR primer: E-cadherin forward primer TTC CCT GCG TAT ACC CTG GT; E-cadherin reverse primer GCC ATC TCT TGC TCG AAG TCC; β-actin forward primer TGA CTG ACT ACC TCA TGA AGA TCC; and β-actin reverse primer GCG AAG ATA CCG GGG GAC ACT CAT GAG.
Melanoma tissue and immunohistochemistry
Ten primary and ten metastatic melanomas were used for miRNA preserving total RNA extraction as previously described [24]. The tissue samples were obtained from archives in the Department of Pathology and Laboratory Medicine, Hospital of the University of Pennsylvania. The protocol was approved by the University of Pennsylvania Institutional Review Board. Five-micrometre sections were used to visualize melanoma and 20-μm-thick sections were used for macro-dissection using a surgical blade. NFκB p50 antibody was purchased from Santa Cruz Biotechnology (Santa Cruz, CA, USA). Immunohistochemistry was performed and the staining was quantified as previously described [25,26].
Infection of pEZX-miR-9
PEZX-MR03 vector (HIV-based) containing has-miR-9–1 was purchased from GeneCopoeia (Rockville, MD, USA). The plasmid was co-transfected into 293T cells with packing vector (pCMV-dR8.2-dupr and pCMV-VSV), and viral supernatants were collected 72 h post-transfection and used to infect human melanoma cells (WM115A, WM35, WM793, and 1205Lu). After 48 h, cells were incubated in selection medium containing puromycin (1 μg/ml).
Transfection of anti-miR-9 miRNA inhibitor
Anti-miR-9 miRNA inhibitor and the irrelevant anti-miR miRNA inhibitor (negative control) were both purchased from Applied Biosystems/Ambion (Austin, TX, USA) and used as instructed by the manufacturer. Briefly, on the day of transfection, 5 × 10⁴ WM115A cells were plated per well in 2 ml of 2% FBS MCDB tumour media. Cells were then incubated with siPORT™ NeoFX™ Transfection Agent (10 μl in 200 μl of OPTI-MEM® I medium without serum) for 5 min. Then 10 μM anti-miR-9 or miR control was added and the cells were incubated for 10 min at room temperature to allow the formation of transfection complexes. The next day, the medium was replaced with 2% MCDB tumour medium and after 48 h, cells were harvested and analysed.
Transfection of pSuper-miR-9 and NF-κB1 plasmids
The day before transfection, 1 × 10⁶ WM115A cells were infected with pEZX-miR-9 in a 100 mm dish containing 10 ml of culture medium with serum and antibiotics. On the day of transfection, the growth medium was replaced with 6 ml of MCDB tumour medium and cells were incubated in FuGENE® 6 Transfection Reagent (30 μl of transfection reagent in 400 μl of OPTI-MEM® I medium without serum) for 5 min. Then 10 μg of pSuperp-miR-9 and NF-κB1 plasmids were added, and cells were incubated for another 25 min at room temperature to allow the formation of transfection complexes. The transfection complexes were added to the cells and after 1 day, the medium was replaced with fresh 2% MCDB tumour medium, incubated for 48 h, harvested, and analysed.
Cell proliferation assay
Cells were seeded in 24-well plates at a density of 5 × 10⁴ cells per well, grown for 1 day, and then transfected with NF-κB1, anti-miR-9 miRNA inhibitor or control vectors, as detailed above. The WST-1 assay was used to detect viable proliferative cells. The absorbance at 450 nm was measured using an lQuant Universal Microplate Spectrophotometer (Biotek Instruments, Winooski, VT, USA).
Wound healing and Boyden chamber migration assays
Anti-miR-9 miRNA inhibitor or anti-miR control inhibitors were transfected into WM115A or miR-9-WM115A and cells were grown to confluency. Cell monolayers were wounded by dragging a 1 ml pipette tip across the cells and then cells were washed to remove cell debris and allowed to migrate for 16–24 h. Images were taken at 0, 16, 20, and 24 h after wounding using a DMI6000 inverted microscope. Three replicates each of two independent experiments were performed. The Boyden chamber assay was performed as previously described [27,28].
Actin polymerization assay
Control and pSuper miR-9-transfected WM115A cells were seeded on fibronectin-pretreated chamber slides. Cells were fixed with glutaraldehyde for 20 min at room temperature and then washed three times with 1% BSA for 5 min. Cells were then treated with 0.3% Triton X-100,1% BSA, and 10% normal donkey serum in PBS at room temperature for 45 min. Rhodamine phalloidin was purchased from R&D Systems (Minneapolis, MN, USA). Tumour cells were incubated with rhodamine phalloidin overnight at 4 °C. Cells were then washed three times with PBS containing 1% BSA. Nuclei were counterstained with DAPI (Vector Laboratories, Dana Point, CA, USA). Cells were imaged with a Leica inverted fluorescence microscope with a Leica camera.
Western blot analysis
NF-κB1 antibody for western blot was purchased from Thermo Scientific (cat No 89017 313, Thermo Fisher Scientific, Barrington, IL, USA) and used at 1:500 dilution. The following antibodies were also used in these studies: mouse anti-Rab8 monoclonal antibody (BD Biosciences, San Jose, CA, USA); rabbit anti-human polyclonal Cdc42 (LifeSpan Biosciences, Seattle, WA, USA); rabbit polyclonal anti-Rab11a and rabbit monoclonal anti-TC10 (Abcam, Cambridge, MA, USA); mouse monoclonal anti-RelA (LifeSpan BioSciences); rabbit polyclonal anti-human cleaved caspase-3 (Cell Signaling, Danvers, MA, USA); and rabbit polyclonal anti-Snail1 (Santa Cruz Biotechnology). Western blots were performed as previously described [23].
Cell cycle analysis
1 × 10⁶ miR-9-WM115A or control cells were harvested, rinsed twice with Ca2+, Mg2+-free cold PBS, and fixed with 70% ethanol overnight at 4°C. Fixed cells were then washed twice with Ca2+, Mg2+-free cold PBS and stained with 20 μg/ml propidium iodide (PI). Analysis was performed using a FACS analyzer (Calibur) and CellQuest Pro software. Cell cycle analysis was performed using ModFit software (Verity Software House, Topsham, ME, USA).
Soft agar colony formation assay
1 × 10⁴ control or miR-9-WM115A cells were suspended in 3 ml of 1.8% (w/v) Bacto™Agar solution containing MCDB with 20% FBS. The mixtures were overlaid onto a 3.3% (w/v) Bacto™Agar solution in six-well dishes. The next day, 2 ml of MCDB supplemented with 2.0% FBS was added. Colonies were counted under a microscope after 15 days. Colony-forming efficiency was calculated by the number of colonies × 100, divided by the number of cells plated.
EGFP fluorescence reporter assay
pcDNA3/EGFP-NF-κB1 3′-UTR and pCDNA3/EGFP-NF-κB1 3′-UTR mutant (mutation in the miR-9 seeding region) were both kindly provided by Dr Hua Tang at the University of Tianjin, China. Fluorescent gene reporter assays were performed as previously described [13]. 293T cells were co-transfected with pcDNA3/pri-miR-9 or control vectors-9 or control oligonucleotides in 24-well plates. The next day, cells were transfected with the reporter vectors pcDNA3/EGFP-NF-κB1 3′-UTR or pcDNA3/EGFP-NF-κB1 3′-UTR mutant. We analysed the results as previously described [13]. Similar results were observed in WM115A cells (data not shown).
Xenograft tumour model
Control or pEZX-miR-9-infected-WM115A cells (2 × 10⁶ cells per animal) were injected subcutaneously into 4- to 5-week-old male athymic nu/nu mice (eight mice per group). After 35 days, mice were sacrificed and necropsies performed. Tissues were procured for analysis.
Statistical analysis
Student’s t-test or one-way ANOVA was used to analyse gene expression and cell viability using GraphPad Prism software. Statistical significance was determined if two-sided p < 0.05.
Results
miR-9 expression in melanoma tissues and cell lines
We have previously shown that the miRNA expression profiles are similar between matched fresh and formalin-fixed, paraffin-embedded (FFPE) tissue [24]. Because of the reliability of FFPE tissue for miRNA analysis, we examined miR-9 expression in ten primary and ten metastatic melanomas using FFPE tissues by quantitative RT-PCR. Melanoma was first confirmed using 5 μm sections (Figure 1A). The area with tumour was macro-dissected out to avoid normal tissue contamination (Figure 1B). Expression of miR-9 was down-regulated in metastatic melanomas, compared with primary melanomas (Figure 1C). We then examined miR-9 expression in four melanoma cell lines isolated from different stages of melanoma progression. Cells derived from metastatic melanomas (1205Lu and WM115A) expressed lower levels of miR-9, compared with cells from radial growth phase melanomas (WM35 cells) and cells from vertical growth phase melanomas (WM793; Figure 1D). The analysis of miR-9 expression in melanoma cell lines from different stages is consistent with the results observed in melanoma tissues. These data support the view that miR-9 expression is reduced in metastatic melanoma compared with primary melanoma.
Figure 1.

miR-9 mRNA expression is decreased in metastatic melanoma tissues and cell lines. (A) Histology of a 5 μm section before macro-dissection (H&E staining). D = dermis; T = tumour; bar = 1 mm. (B) Residual tissue after macro-dissection. Twenty-micrometre sections were used for macro-dissection. The image shows residual tumour after macro-dissection (bright field). D = dermis; T = tumour; bar = 1 mm. (C) Quantitative RT-PCR analysis of miR-9 expression in ten primary and metastatic melanomas (n = 3 replicate experiments; *p < 0.05 compared with control). (D) Quantitative RT-PCR analysis of miR-9 expression in WM35, WM793, WM115A, and 1205Lu cells (n = 3 replicate experiments; *p < 0.05 compared with control).
miR-9 inhibits melanoma cell proliferation
To study the function of miR-9 in melanoma, we examined the phenotypes of melanoma cells over-expressing miR-9. For these experiments, WM115A, 1205Lu, WM793, and WM35 cells were infected with lentivirus carrying bicistronic vectors (pEZX) containing both the miR-9 precursor and a green fluorescent protein (GFP) reporter. Control cells were infected with lentivirus carrying empty vectors. After 48 h of infection, cells were selected with 1 μg/ml puromycin for 5 days and the expression of miR-9 was confirmed by quantitative RT-PCR (Figure 2A). Cell proliferation was examined using the WST-1 proliferation assay. We found that cells infected with miR-9 virus grew significantly slower than control cells (Figure 2B). Next, we used FACS analysis to examine the cell cycle progression of WM115A cells infected with miR-9 (miR-9-WM115A). In the metastatic melanoma cells overexpressing miR-9, we found fewer cells in the S and G2-M phases (62.34% ± 8.97% versus 41.41% ± 3.51%; control versus miR-9; Figure 2C). To examine the effect of miR-9 expression on colony-formation potential, miR-9-WM115A and controls were tested for the ability to grow on soft agar. We found that miR-9-overexpressing cells formed 60% fewer colonies in soft agar (Figure 2D), compared with controls, indicating that miR-9 overexpression suppressed the growth of metastatic melanoma cells on soft agar.
Figure 2.
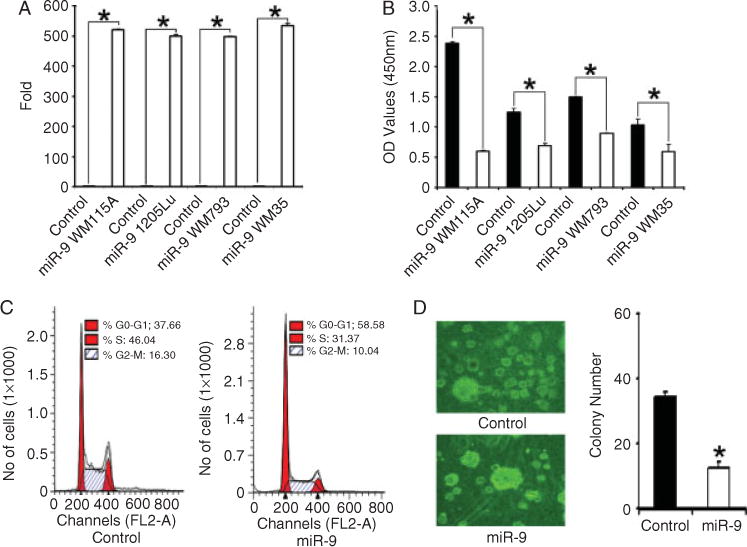
miR-9 overexpression decreases melanoma cell growth. (A) Quantitative RT-PCR analysis of miR-9 expression in WM35, WM793, WM115A, and 1205Lu cells infected with control vector and pEZX-miR-9 (n = 3 replicate experiments; *p < 0.05 compared with control). (B) WST-1 cell proliferation assay. WM35, WM793, WM115A, and 1205Lu cells infected with control vector and pEZX-miR-9 were detected at 450 nm (A450) of absorbance (n = 3 replicate experiments; *p < 0.05 compared with control). (C) Cell cycle analysis. Control and miR-9-WM115A cells in G2-M and S phases were analysed by FACS analysis (left panel: control; right panel: miR-9-WM115A). (D) Soft agar assay. Control and mir-9-WM115A cells were incubated in soft agar. The clones were counted using a microscope at 100× power. The values (colony number) are expressed as mean ± standard deviation (SD) from three separate measurements (*p < 0.05 compared with control cells).
miR-9 inhibits cell motility and cytoskeleton protein expression
Using a well-established wound-healing assay [29,30], we examined cell motility in melanoma cells overexpressing miR-9 and found that these cells displayed reduced cell motility (Figure 3A). To reinforce these findings, we performed a transwell chamber migration assay [27] and found a similar significant decrease in cell migration in miR-9-WM115A cells (Figure 3B).
Figure 3.

miR-9 overexpression decreases cell motility. (A) Wound-healing cell motility assay. Wound healing was examined in control and miR-9-WM115A cells at 0 and 24 h after wound formation. Representative images from three experiments are shown. (B) Boyden chamber migration assay. Migrated cells were counted using a microscope at 100× power. The values (migrated cell number) are expressed as mean ± standard deviation (SD) from three separate measurements (*p < 0.05 compared with control cells). (C) F-actin assay. An increase in the organization of microfilaments was apparent in control cells, compared with miR-9-WM115A (left panel: control; right panel: miR-9-WM115A cells). (D) Expression levels of Rab8, Rablla, RelA, andTC10 were examined by western blotting. The expression of α-tubulin was used as a loading control (n = 3 replicate experiments). (E) Quantitative RT-PCR was performed to assay E-cadherin expression in control and miR-9-WM115A cells (n = 3 replicate experiments; *p < 0.05 compared with control). (F) Expression of E-cadherin and Snail1 protein was determined by western blot analysis. α-tubulin was used as a loading control (n = 3 replicate experiments).
To visualize the actin polymerization in melanoma cells, we labelled miR-9-WM115A cells with rhodamine phalloidin [27]. Upon examination by fluorescence microscopy, significantly fewer filopodia and protrusions (Figure 3C) were detected in cells expressing miR-9, compared with controls. We then used western blot analysis to examine the expression of several proteins that regulate actin dynamics, including Cdc42, Rab8, Rab11a, RelA, and TC10. We found that expression levels of these proteins were markedly decreased after miR-9 overexpression (Figure 3D), compared with controls.
E-cadherin is involved in EMT and the E-cadherin transcript has recently been shown to be a direct target for miR-9 binding [12]. To explore the relationship between E-cadherin and miR-9, we used RT-PCR to examine E-cadherin expression in melanoma cells with miR-9 overexpression. Overexpression of miR-9 resulted in significant up-regulation of E-cadherin expression in melanoma cells at both gene and protein levels (Figures 3E and 3F). Because E-cadherin expression is known to be regulated by the Snail1 protein [31], we next measured Snail1 protein expression in the presence and absence of miR-9 overexpression and found that Snail1 protein expression was significantly reduced in miR-9-overexpressing cells (Figure 3F).
To further study the effect of miR-9 in melanoma cells, we knocked down the expression of endogenous miR-9 using an anti-miR™ miRNA inhibitor (Applied Biosystems). For these experiments, WM115A cells were treated with the miR-9 miRNA inhibitor, after which miR-9 expression was examined by quantitative RT-PCR. We found a 90% decrease in miR-9 expression in miR-9-knockdown cells (cells treated with the miR-9 miRNA inhibitor), compared with cells treated with a negative control miRNA inhibitor (Figure 4A). Next, we performed cell proliferation assays and found that miR-9 knockdown cells grew significantly faster (Figure 4B) and formed more colonies in soft agar compared with control cells (Figure 4C). Using the wound healing assay, we also demonstrated that the miR-9 knockdown cells displayed increased cell motility compared with control cells (Figure 4D). In addition, miR-9 knockdown cells had increased expression of the Snail1 protein by western blot (Figure 4E) and decreased expression of CDH1 (E-cadherin) by quantitative PCR and western blot (Figures 4E and 4F). To determine the effect of miR-9 knockdown in less aggressive radial growth phase melanoma cell lines, we knocked down the expression of miR-9 in WM35 cells. miR-9 knockdown also increased cell proliferation (Figure 4G) and migration in both wound healing and Boyden chamber migration assays (Figures 4H and 4I).
Figure 4.

miR-9 knockdown increases WM115A cell growth and motility. (A) Quantitative RT-PCR was used to analyse miR-9 expression in anti-miR-9 miRNA inhibitor-transfected WM115A and control cells (n = 3 replicate experiments; *p < 0.05 compared with control). (B) WST-1 cell proliferation assay. Anti-miR-9 miRNA inhibitor-transfected WM115A and control cells were analysed for cell proliferation and detected at 450 nm of absorbance (n = 3 replicate experiments; *p < 0.05 compared with control). (C) Soft agar assay. Control and miR-9 knockdown WM115A cells were diluted and plated in soft agar. Viable colonies were counted using a microscope at 100× power. The values (colony number) are expressed as mean ± standard deviation (SD) from three separate measurements (*p < 0.05 compared with control). (D) Wound-healing cell motility assay. Wound healing of control and miR-9 knockdown WM115A cells was assayed at 0 and 16 h after scratch formation. Representative images from three experiments are shown. (E) E-cadherin and Snail1 protein expression by western blot analysis. Cell lysates from control and miR-9 knockdown WM115A were used for western blot analyses. α-Tubulin was used as a loading control (n = 3 replicate experiments). (F) Quantitative RT-PCR analysis of E-cadherin expression in control and miR-9 knockdown WM115A cells (n = 3 replicate experiments; *p < 0.05 compared with control). (G) WST-1 cell proliferation assay. Anti-miR-9 miRNA inhibitor-transfected WM35 and control cells were analysed for cell proliferation and detected at 450 nm of absorbance (n = 3 replicate experiments; *p < 0.05 compared with control). (H) Wound-healing cell motility assay. Wound healing of control and miR-9 knockdown WM35 cells was assayed at 0 and 20 h after scratch formation. Representative images from three experiments are shown. (I) Boyden chamber migration assay. Migrated control and miR-9 knockdown WM35 cells were counted. The percentage of migrated cells is shown from three separate measurements (*p < 0.05 compared with control cells).
miR-9 binds directly to the NF-κB1 3′-UTR
To study the underlying mechanism of miR-9 on melanoma cells, we explored the effect of miR-9 expression on the NF-κB1 pathway. We explored the NF-κB1 pathway because activation of this pathway is known to induce cytoskeletal reorganization [32,33] and NF-κB1 is a target for miR-9 in ovarian cancer [13]. miR-9 overexpression resulted in significant down-regulation of NF-κB1 protein expression in WM35, WM793, 1205Lu, and WM115A cells (Figure 5A). Cleaved caspase-3 is a direct target of NF-κB1 and it accumulates in cells when NF-κB1 levels are reduced. Western blot confirmed increases of the cleaved caspase-3 levels after miR-9 overexpression (Figure 5A). Consistent with these findings, the treatment of melanoma cells with anti-miR-9 miRNA inhibitor resulted in the up-regulation of NF-κB1 expression by western blot (Figure 5B).
Figure 5.

miR-9 inhibits NF-κB1 expression. (A) Expression of NF-κB1 and cleaved caspase-3 by western blot. Cell lysates from control and miR-9 infected WM35, WM793,1205Lu, and WM115A cells were used for western blot analyses with NF-κB1 antibody and α-tubulin was used as a loading control (n = 3 replicate experiments). (B) Cell lysates from anti-miR-9 miRNA inhibitor-transfected WM115A cells and control cells were subjected to western blot analysis using anti-NF-κB1 antibodies. α-Tubulin was used to verify equal loading (n = 3). (C) 293T cells were co-transfected with EGFP-NF-κB1 3′-UTR or mutant EGFP-NF-κB1 3′-UTR reporter vectors and miR-9 or control vectors. (D) Immunohistochemistry of NF-κB1 in melanoma tissues. Primary and metastatic melanoma tissues were stained with anti-NF-κB1 antibodies (1:50). Representative images are shown (bar = 25 μm). The staining was quantified and is shown in the right panel.
The 3′-UTR of NF-κB1 contains a putative binding site for miR-9 [14]. To study the direct binding of miR-9 to this site, the 3′-UTR of NF-κB1 was ligated to an EGFP reporter gene and used in transcription activation assays as previously described [34]. The specificity of the miR-9 binding site was examined using constructs containing a mutated miR-9 binding site within the NF-κB1-3′-UTR. For these experiments, 293T cells were co-transfected with NF-κB1-3′-UTR-EGFP along with pSuper-miR-9 vectors or empty pSuper vectors as controls. We found that the EGFP fluorescence intensity in pSuper-miR-9-transfected cells was significantly lower than in cells transfected with empty vectors (Figure 5C), indicating that miR-9 can bind directly to sites within the NF-κB1-3′-UTR. This binding appears specific because the overexpression of miR-9 did not affect the EGFP fluorescence intensity of the cells transfected with mutated putative mir-9 binding sites (Figure 5C).
NF-κB1 expression in primary and metastatic melanomas
To determine the expression of NF-κB1 in melanoma tissue, we used the melanoma tissues that we had used to examine miR-9 expression by quantitative RT-PCR. In contrast to miR-9 expression in these tissues, NF-κB1 expression was significantly increased in metastatic melanomas compared with primary melanomas (Figure 5D).
NF-κB1 rescues the function of miR-9 in melanoma cells
To further confirm the effect of miR-9 on NF-κB1, we performed rescuing experiments by introducing a constitutively active form of NF-κB1 into miR-9-WM115A cells. These cells were then analysed for NF-κB1 expression by western blotting (Figure 6A). In addition to NF-κB1 expression, we also analysed cell growth and motility in the cells with constitutively active NF-κB1 and found that overexpression of NF-κB1 reversed the inhibitory effect of miR-9 on cell growth and motility (Figures 6B and 6C). We also found that overexpression of NF-κB1 reversed the miR-9-induced down-regulation of Snail1 protein expression (Figure 6D) and the concomitant up-regulation of CDH1 (E-cadherin; Figure 6E).
Figure 6.

NF-κB1 rescues the function of miR-9. (A) Cell lysates from control, miR-9-WM115A, NF-κB1-transfected WM115A, and NF-κB1-transfected miR-9-WM115A cells were subjected to western blot analysis using anti-NF-κB1 antibody. α-Tubulin was used as a loading control (n = 3 replicate experiments). (B) WST-1 cell proliferation assay. Control, miR-9-WM115A, and NF-κB1-transfected miR-9-WM115A cells were used in cell proliferation assays (n = 3 replicate experiments; *p < 0.05 compared with control). (C) Wound-healing cell motility assay. Wound healing of control, miR-9-WM115A, and NF-κB1-transfected miR-9-WM115A cells was monitored at 0 and 24 h after scratch formation. Representative images from three experiments are shown. (D) Expression of Snail1 by western blot. Cell lysates from control, miR-9-WM115A, and NF-κB1-transfected miR-9-WM115A cells were used for western blot analyses with anti-Snail1 antibody, with α-tubulin used as a loading control (n = 3 replicate experiments). (E) Quantitative RT-PCR analysis of E-cadherin expression in control, miR-9-WM115A, and NF-κB1-transfected miR-9-WM115A cells (n = 3 replicate experiments; *p < 0.05 compared with control).
miR-9 inhibits melanoma growth and metastasis in vivo
To assess the effect of miR-9 on tumour growth and metastasis in vivo, we injected two million control or miR-9-WM115A cells into the flanks of nude mice and then monitored these mice for 5 weeks. Overexpression of miR-9 in the xenografts was confirmed by quantitative PCR (Figure 7B). The xenografts formed by miR-9-WM115A cells were significantly smaller in size (Figure 7A) and weight (Figure 7C), compared with controls. Upon necropsy, it was found that the metastasis rate in WM115A versus miR-9-WM115A was 25% (2/8) versus 0% (0/8). To investigate whether miR-9 affected NF-κB1 and Snail1 expression in vivo, we used western blotting to examine NF-κB1 and Snail1 expression in the xenografts formed by miR-9-WM115A or control cells. There was a significant decrease in NF-κB1 expression in tumours formed by miR-9-WM115A cells and this decrease corresponded to an increase in cleaved caspase-3 levels. In addition, Snail1 expression was reduced in the xenografts formed by miR-9-WM115A cells (Figure 7D), with a corresponding increase in E-cadherin expression (Figure 7E).
Figure 7.
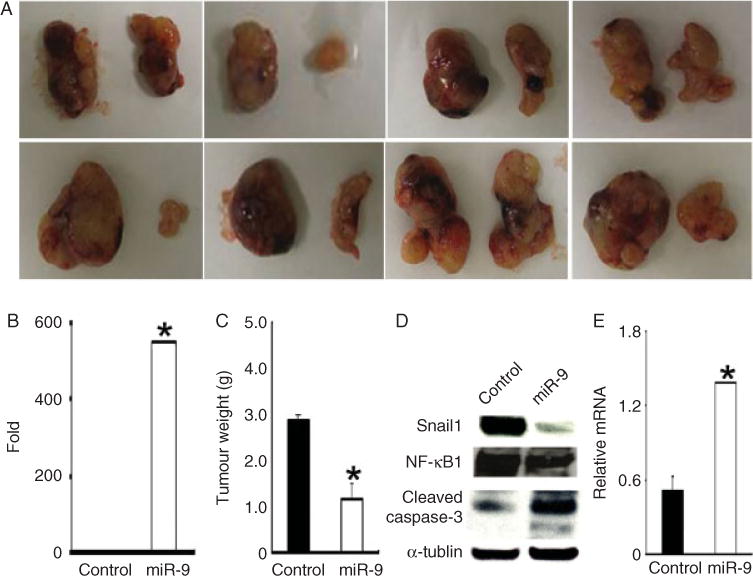
miR-9 inhibits melanoma growth and metastasis in vivo. 2 × 10⁶ WM115A control or miR-9-WM115A cells were injected subcutaneously into the flanks of nude mice (n = 8) and mice were followed for 5 weeks. (A) All the primary xenografts are shown (leftside: control; right side: miR-9-WM115A). (B) Quantitative RT-PCR analysis of miR-9 expression in xenografts from control and miR-9-WM115A cells (*p < 0.05 compared with control). (C) Average tumour weights (*p < 0.05 compared with control). (D) Expression of Snail1, NF-κB1, and cleaved caspase-3 was assayed by western blot. Cell lysates from tumours generated by control and miR-9-WM115A were used for western blot analyses with anti-Snail1, NF-κB1 or cleaved caspase-3 antibody. α-Tubulin was used as a loading control (n = 3 replicate experiments). (E) Quantitative RT-PCR analysis of E-cadherin expression in tumours generated by control and miR-9-WM115A cells (*p < 0.05 compared with control).
Discussion
miRNAs add a new layer of complexity to tumour initiation and progression. We found that miR-9 is down-regulated in metastatic melanoma tissues and cell lines derived from metastatic melanoma. The expression levels of miR-9 were linked to melanoma proliferation and migratory capacity in vitro and in vivo. In contrast to its pro-metastasis effect in breast cancer, miR-9 inhibited metastasis through down-regulation of Snail1 and up-regulation of E-cadherin expression in melanoma cells. miR-9 directly bound to the 3′-UTR of NF-κB1 and decreased Snail1 expression. Our findings suggest that the function of miR-9 is cancer type-specific and miR-9 acts as a tumour suppressor in melanoma.
Genes of the miR-9 family (miR-9-1, miR-9-2, and miR-9-3) have been reported to be aberrantly hypermethylated in primary tumours with lymph node metastasis compared with primary tumours without lymph node metastasis in colon, lung, breast cancers and melanoma [35,36]. These studies also showed that the expression of miR-9 transcripts was not detectable in tumours displaying miR-9 promoter methylation [35]. These findings suggest that miR-9 is a potential tumour suppressor for cancer metastasis. Our results echo these findings and showed that miR-9 expression is indeed down-regulated in metastatic melanomas compared with primary melanomas, in both clinical samples and cell lines. Furthermore, we showed that overexpression of miR-9 suppresses melanoma growth, migratory capacity, and metastasis in vitro and in vivo.
Several studies suggest that the function of miR-9 is tumour-type specific. For example, it has been shown that miR-9 directly targets CDH1 (E-cadherin) and leads to increased breast cancer cell motility and invasiveness [12,35]. Decreases in E-cadherin protein levels in cancer tissues are well known to be associated with tumour metastasis and recurrence [37]. However, in ovarian and gastric cancer, several groups have shown that miR-9 acts as a putative tumour suppressor [13–15,34,38]. RAB34, GRB2, and NF-κB1 have all been identified as potential targets for miR-9, and each of these targets could potentially mediate the tumour suppressor effects of miR-9 [39,40]. Loss of miR-9 has been shown to promote the mobility of neuronal cells through the regulation of cytoskeleton proteins [41]. The results from our study indicate that decreased expression of miR-9 can facilitate cell motility by the formation of more filopodia and protrusions, as well as increase the expression of cytoskeleton proteins that are involved in cell movement.
The effect of miR-9 is mediated through the NF-κB1-Snail1 pathway in melanoma cells. Using an EGFP-NF-κB1-3′-UTR reporter assay, we found decreased EGFP intensity following overexpression of miR-9, while mutation of the miR-9 ‘seed region’ binding site resulted in cells that were unaffected by miR-9 overexpression. These results suggest that miR-9 can bind directly to the NF-κB1 3′-UTR and inhibit its expression in melanoma cells. In melanoma tissues, we found that miR-9 expression was decreased in metastatic melanoma compared with primary melanoma, and the change was accompanied by increased expression of NF-κB1 in metastatic melanoma. NF-κB1 was previously shown to be significantly increased in metastatic melanomas compared with primary melanomas [25]. Snail1, a potent repressor of CDH1 (E-cadherin) expression, is a downstream target of NF-κB1. Down-regulation of miR-9 decreases the repression of NF-κB1 expression and results in up-regulation of Snail1 and down-regulation of CDH1 in melanoma. The effect of miR-9 can be reversed by expression of the constitutively active form of NF-κB1. These data indicate that the effect of miR-9 on Snail1 and CDH1 depends on NF-κB1 activation [12,21,42]. This hypothesis was further supported by the xenograft experiment. Xenografts formed by melanoma cells with overexpression of miR-9 showed decreased expression of NF-κB1 and Snail1, with up-regulation of E-cadherin.
The effect of miR-9 on E-cadherin is context-dependent. It has been shown that miR-9 induces EMT in breast cancer cells and promotes tumour progression in a cell type- and context-dependent manner [12]. The opposite effect of miR-9 on E-cadherin expression in breast cancer and melanoma may be explained by the direct suppressive effects of miR-9 on both E-cadherin and NF-κB1. The resultant phenotype would be dependent on the expression levels of these genes and/or the activation status of these pathways. For example, one pathway might be more dominantly suppressed in a particular tumour type, resulting in an increase or decrease of E-cadherin expression in this tumour type.
In conclusion, there is a decrease of miR-9 expression during melanoma progression, which may contribute to maintaining malignant phenotypes by sustaining high levels of NF-κB1 and Snail1 and low levels of E-cadherin in metastatic melanoma cells. Our results identify a novel mechanism of miR-9-mediated inhibition of E-cadherin expression and suggest that the function of miR-9 is cell type- and context-dependent.
Acknowledgments
This work was supported by grants CA-116103, CA-093372, and AR-054593 from the National Institute of Health to XX and 5-R01-GM-085146 to WG. We thank Dr Meenhard Herlyn, Wistar Institute, for the melanoma cell lines; Dr Frank Lee, University of Pennsylvania, for 293T cells; Dr Romano Regazzi, University of Lausanne, for pSuper-miR-9 plasmids; Dr Harikrishna Nakshatri, Indiana University, for NF-κB1 constitutively active plasmids; Dr Hua Tang, Tianjin University, Tianjin, China, for pcDNA3/EGFP-NF-κB1 3′-UTR and pcDNA3/EGFP-NF-κB1 3′-UTR mutant plasmids; Dr James Martin for helping with FACS work; and Drs Frank Lee, Hongbing Zhang, Qihong Huang, Hongtao Zhang, James S Martin, Shanshan Feng, Jinqi Ren, Kirstein Huang, and Mr Eric Lee for preparation of this manuscript.
Footnotes
No conflicts of interest were declared.
Author Contributions
SL and XX designed all the experiments. SL performed miR-9 functional assays. AL, AP, HL, SK, RY and WG performed some of the experiments. SL and XX wrote the manuscript and all the authors approved the manuscript.
References
- 1.Greenlee RT, Murray T, Bolden S, et al. Cancer statistics, 2000. CA Cancer J Clin. 2000;50:7–33. doi: 10.3322/canjclin.50.1.7. [DOI] [PubMed] [Google Scholar]
- 2.Rigel DS, Carucci JA. Malignant melanoma: prevention, early detection, and treatment in the 21st century. CA Cancer J Clin. 2000;50:215–236. doi: 10.3322/canjclin.50.4.215. quiz 237–240. [DOI] [PubMed] [Google Scholar]
- 3.Iorio MV, Ferracin M, Liu CG, et al. MicroRNA gene expression deregulation in human breast cancer. Cancer Res. 2005;65:7065–7070. doi: 10.1158/0008-5472.CAN-05-1783. [DOI] [PubMed] [Google Scholar]
- 4.Yanaihara N, Caplen N, Bowman E, et al. Unique microRNA molecular profiles in lung cancer diagnosis and prognosis. Cancer Cell. 2006;9:189–198. doi: 10.1016/j.ccr.2006.01.025. [DOI] [PubMed] [Google Scholar]
- 5.Calin GA, Liu CG, Ferracin M, et al. Ultraconserved regions encoding ncRNAs are altered in human leukemias and carcinomas. Cancer Cell. 2007;12:215–229. doi: 10.1016/j.ccr.2007.07.027. [DOI] [PubMed] [Google Scholar]
- 6.Akao Y, Nakagawa Y, Naoe T. MicroRNA-143 and -145 in colon cancer. DNA Cell Biol. 2007;26:311–320. doi: 10.1089/dna.2006.0550. [DOI] [PubMed] [Google Scholar]
- 7.Visone R, Pallante P, Vecchione A, et al. Specific microRNAs are downregulated in human thyroid anaplastic carcinomas. Oncogene. 2007;26:7590–7595. doi: 10.1038/sj.onc.1210564. [DOI] [PubMed] [Google Scholar]
- 8.Bloomston M, Frankel WL, Petrocca F, et al. MicroRNA expression patterns to differentiate pancreatic adenocarcinoma from normal pancreas and chronic pancreatitis. J Am Med Assoc. 2007;297:1901–1908. doi: 10.1001/jama.297.17.1901. [DOI] [PubMed] [Google Scholar]
- 9.Hildebrandt MA, Gu J, Lin J, et al. Hsa-miR-9 methylation status is associated with cancer development and metastatic recurrence in patients with clear cell renal cell carcinoma. Oncogene. 2010;29:5724–5728. doi: 10.1038/onc.2010.305. [DOI] [PubMed] [Google Scholar]
- 10.Smirnova L, Grafe A, Seiler A, et al. Regulation of miRNA expression during neural cell specification. Eur J Neurosci. 2005;21:1469–1477. doi: 10.1111/j.1460-9568.2005.03978.x. [DOI] [PubMed] [Google Scholar]
- 11.Nass D, Rosenwald S, Meiri E, et al. MiR-92b and miR-9/9* are specifically expressed in brain primary tumors and can be used to differentiate primary from metastatic brain tumors. Brain Pathol. 2009;19:375–383. doi: 10.1111/j.1750-3639.2008.00184.x. [DOI] [PMC free article] [PubMed] [Google Scholar]
- 12.Ma L, Young J, Prabhala H, et al. miR-9, a MYC/MYCN-activated microRNA, regulates E-cadherin and cancer metastasis. Nature Cell Biol. 2010;12:247–256. doi: 10.1038/ncb2024. [DOI] [PMC free article] [PubMed] [Google Scholar]
- 13.Guo LM, Pu Y, Han Z, et al. MicroRNA-9 inhibits ovarian cancer cell growth through regulation of NF-kappaB1. FEBS J. 2009;276:5537–5546. doi: 10.1111/j.1742-4658.2009.07237.x. [DOI] [PubMed] [Google Scholar]
- 14.Wan HY, Guo LM, Liu T, et al. Regulation of the transcription factor NF-kappaB1 by microRNA-9 in human gastric adenocarci-noma. Mol Cancer. 2010;9:16. doi: 10.1186/1476-4598-9-16. [DOI] [PMC free article] [PubMed] [Google Scholar]
- 15.Ferretti E, De Smaele E, Po A, et al. MicroRNA profiling in human medulloblastoma. Int J Cancer. 2009;124:568–577. doi: 10.1002/ijc.23948. [DOI] [PubMed] [Google Scholar]
- 16.Hu X, Schwarz JK, Lewis JS, Jr, et al. A microRNA expression signature for cervical cancer prognosis. Cancer Res. 2010;70:1441–1448. doi: 10.1158/0008-5472.CAN-09-3289. [DOI] [PMC free article] [PubMed] [Google Scholar]
- 17.Yamazaki D, Kurisu S, Takenawa T. Regulation of cancer cell motility through actin reorganization. Cancer Sci. 2005;96:379–386. doi: 10.1111/j.1349-7006.2005.00062.x. [DOI] [PMC free article] [PubMed] [Google Scholar]
- 18.Yamaguchi H, Condeelis J. Regulation of the actin cytoskeleton in cancer cell migration and invasion. Biochim Biophys Acta. 2007;1773:642–652. doi: 10.1016/j.bbamcr.2006.07.001. [DOI] [PMC free article] [PubMed] [Google Scholar]
- 19.Karst AM, Gao K, Nelson CC, et al. Nuclear factor kappa B subunit p50 promotes melanoma angiogenesis by upregulating interleukin-6 expression. Int J Cancer. 2009;124:494–501. doi: 10.1002/ijc.23973. [DOI] [PubMed] [Google Scholar]
- 20.Wu Y, Yang L, Zhong L. Decreased serum levels of thioredoxin in patients with coronary artery disease plus hyperhomocysteinemia is strongly associated with the disease severity. Atherosclerosis. 2010;212:351–355. doi: 10.1016/j.atherosclerosis.2010.06.002. [DOI] [PubMed] [Google Scholar]
- 21.Christofori G. Snail1 links transcriptional control with epigenetic regulation. EMBO J. 2010;29:1787–1789. doi: 10.1038/emboj.2010.92. [DOI] [PMC free article] [PubMed] [Google Scholar]
- 22.Kawanishi K, Doki Y, Shiozaki H, et al. Correlation between loss of E-cadherin expression and overexpression of autocrine motility factor receptor in association with progression of human gastric cancers. Am J Clin Pathol. 2000;113:266–274. doi: 10.1309/JH4Q-25Q5-0TRV-W99U. [DOI] [PubMed] [Google Scholar]
- 23.Kumar SM, Yu H, Edwards R, et al. Mutant V600E BRAF increases hypoxia inducible factor-1alpha expression in melanoma. Cancer Res. 2007;67:3177–3184. doi: 10.1158/0008-5472.CAN-06-3312. [DOI] [PubMed] [Google Scholar]
- 24.Tetzlaff MT, Liu A, Xu X, et al. Differential expression of miR-NAs in papillary thyroid carcinoma compared to multinodular goiter using formalin fixed paraffin embedded tissues. Endocr Pathol. 2007;18:163–173. doi: 10.1007/s12022-007-0023-7. [DOI] [PubMed] [Google Scholar]
- 25.Gao K, Dai DL, Martinka M, et al. Prognostic significance of nuclear factor-kappaB p105/p50 in human melanoma and its role in cell migration. Cancer Res. 2006;66:8382–8388. doi: 10.1158/0008-5472.CAN-05-4402. [DOI] [PubMed] [Google Scholar]
- 26.Kumar SM, Acs G, Fang D, et al. Functional erythropoietin autocrine loop in melanoma. Am J Pathol. 2005;166:823–830. doi: 10.1016/S0002-9440(10)62303-6. [DOI] [PMC free article] [PubMed] [Google Scholar]
- 27.Liu S, Yu M, He Y, et al. Melittin prevents liver cancer cell metastasis through inhibition of the Rac1-dependent pathway. Hepatology. 2008;47:1964–1973. doi: 10.1002/hep.22240. [DOI] [PubMed] [Google Scholar]
- 28.Xu Z, Maroney AC, Dobrzanski P, et al. The MLK family mediates c-Jun N-terminal kinase activation in neuronal apoptosis. Mol Cell Biol. 2001;21:4713–4724. doi: 10.1128/MCB.21.14.4713-4724.2001. [DOI] [PMC free article] [PubMed] [Google Scholar]
- 29.Liu SJ, Tian DF, He YC, et al. [Correlation of Ca2+ current features of nasopharyngeal carcinoma cells with different metastatic potentiality to their moving abilities] Ai Zheng. 2007;26:473–479. [PubMed] [Google Scholar]
- 30.Yarrow JC, Perlman ZE, Westwood NJ, et al. A high-throughput cell migration assay using scratch wound healing, a comparison of image-based readout methods. BMC Biotechnol. 2004;4:21. doi: 10.1186/1472-6750-4-21. [DOI] [PMC free article] [PubMed] [Google Scholar]
- 31.Herranz N, Pasini D, Diaz VM, et al. Polycomb complex 2 is required for E-cadherin repression by the Snail1 transcription factor. Mol Cell Biol. 2008;28:4772–4781. doi: 10.1128/MCB.00323-08. [DOI] [PMC free article] [PubMed] [Google Scholar]
- 32.Hodgson L, Henderson AJ, Dong C. Melanoma cell migration to type IV collagen requires activation of NF-kappaB. Oncogene. 2003;22:98–108. doi: 10.1038/sj.onc.1206059. [DOI] [PMC free article] [PubMed] [Google Scholar]
- 33.Torabian SZ, de Semir D, Nosrati M, et al. Ribozyme-mediated targeting of IkappaBgamma inhibits melanoma invasion and metastasis. Am J Pathol. 2009;174:1009–1016. doi: 10.2353/ajpath.2009.080207. [DOI] [PMC free article] [PubMed] [Google Scholar]
- 34.Huang L, Li Q, Li H, et al. Inhibition of intracellular Ca2+ release by a Rho-kinase inhibitor for the treatment of ischemic damage in primary cultured rat hippocampal neurons. Eur J Pharmacol. 2009;602:238–244. doi: 10.1016/j.ejphar.2008.11.053. [DOI] [PubMed] [Google Scholar]
- 35.Lehmann U, Hasemeier B, Christgen M, et al. Epigenetic inactivation of microRNA gene hsa-mir-9-1 in human breast cancer. J Pathol. 2008;214:17–24. doi: 10.1002/path.2251. [DOI] [PubMed] [Google Scholar]
- 36.Lujambio A, Calin GA, Villanueva A, et al. A microRNA DNA methylation signature for human cancer metastasis. Proc Natl Acad Sci U S A. 2008;105:13556–13561. doi: 10.1073/pnas.0803055105. [DOI] [PMC free article] [PubMed] [Google Scholar]
- 37.Vleminckx K, Vakaet L, Jr, Mareel M, et al. Genetic manipulation of E-cadherin expression by epithelial tumor cells reveals an invasion suppressor role. Cell. 1991;66:107–119. doi: 10.1016/0092-8674(91)90143-m. [DOI] [PubMed] [Google Scholar]
- 38.Laios A, O’Toole S, Flavin R, et al. Potential role of miR-9 and miR-223 in recurrent ovarian cancer. Mol Cancer. 2008;7:35. doi: 10.1186/1476-4598-7-35. [DOI] [PMC free article] [PubMed] [Google Scholar]
- 39.Song B, Ju J. Impact of miRNAs in gastrointestinal cancer diagnosis and prognosis. Expert Rev Mol Med. 2010;12:e33. doi: 10.1017/S1462399410001663. [DOI] [PubMed] [Google Scholar]
- 40.Luo H, Zhang H, Zhang Z, et al. Down-regulated miR-9 and miR-433 in human gastric carcinoma. J Exp Clin Cancer Res. 2009;28:82. doi: 10.1186/1756-9966-28-82. [DOI] [PMC free article] [PubMed] [Google Scholar]
- 41.Delaloy C, Liu L, Lee JA, et al. MicroRNA-9 coordinates proliferation and migration of human embryonic stem cell-derived neural progenitors. Cell Stem Cell. 2010;6:323–335. doi: 10.1016/j.stem.2010.02.015. [DOI] [PMC free article] [PubMed] [Google Scholar]
- 42.Wu Y, Zhou BP. TNF-alpha/NF-kappaB/Snail pathway in cancer cell migration and invasion. Br J Cancer. 2010;102:639–644. doi: 10.1038/sj.bjc.6605530. [DOI] [PMC free article] [PubMed] [Google Scholar]