

Abstract
Precise localization of cortical activation in the early development of the infant brain remains unclear. It is challenging to co-register haemodynamic responses during functional activation in infants with the underlying anatomy of the brain. We used a multispectral imaging algorithm to reconstruct 3D optical topographic images of haemodynamic responses in an infant during voice processing. In this paper we present a method for co-registering 3D optical topography images reconstructed from functional activation data in infants onto anatomical brain images obtained from MRI structurals of the individual infants.
1 Introduction
Optical topography (OT) is a non-invasive technique which uses near infrared light to study functional brain imaging in infants. Over the last 10 years progress and development of this technique has led to an increase in interest in the application for investigating cortical activity in the developing brain [1]. Even though in the early years OT was used to detect the response to basic stimuli activating the primary cortical areas (auditory and visual cortex), recent advances in technology shifted the focus to study awake infants and address topics such as biological motion processing, face processing and voice processing [2–4]. In these studies, OT was used to map haemodynamic responses during activation with specific regions of the cortex. However, co-registration between the haemodynamic response measured at the surface of the head and the underlying cortical anatomy remains a challenge. This is primarily due to the lack in capacity for measuring brain structure for anatomical reference and the lack of common control points between the optical array, the head and the anatomical image.
Furthermore, OT studies treat the data as single source-detector (channel) haemodynamic responses even if the data are measured from multiple channels at different separations. Numerous research groups have produced optical images of brain activity. The first method, pioneered by researchers at Hitachi Medical Co., assumes that a change in intensity measured by a given source-detector pair has its origin midway between the source and detector, and there is no attempt to resolve in the depth direction [5]. Conventional image reconstruction involves finding the optical properties of the medium from a set of measurements, which are then combined to calculate the chromophore concentrations. We use a multispectral imaging algorithm to reconstruct haemodynamic responses and obtain 3D optical topography images. In order to make a precise statement about cerebral specialisation during cortical activation it is necessary to co-register functional activation onto an anatomical atlas. In this paper we describe a method for co-registering 3D optical topography images on 3D brain volumes rendered from MRI scans.
2 Methods
2.1 Protocol
Data from one healthy, 6-month-old infant were taken from the previously published data where the experimental paradigm and psychological rationale for the work are explained in detail [4]. The infant sat on the parent’s lap while the stimuli were displayed on a screen. The session began with a rest period (30 s) to get familiar with the experimental setup. Following this, the trials alternated one after the other, beginning with a 10-s baseline trial followed by a 10-s experimental trial. Three types of auditory experimental trials (voice, non-voice, and silence) were presented pseudo-randomly to prevent anticipatory effects, and to ensure the infant was presented with an equal number of trials per condition after every 12 trials. The voice condition included non-speech adult vocalizations (coughing, yawning, throat clearing, laughing, and crying). The non-voice trials included naturalistic environmental sounds (water running, and toys such as rattles, squeaky toy, spinning balls). Each stimulus sequence lasted 8 s and consisted of four different sounds (of voice or non-voice stimuli) presented for 0.37–2.92 s each, interleaved by short silence periods (of 0.16–0.24 s).
2.2 Registering the optode positions onto a brain volume
The UCL OT system which emits at wavelengths of 770 and 850 nm, was used for the data acquisition [6]. The sources are frequency modulated and illuminated simultaneously. The infant wore a custom-built OT headgear consisting of two optical imaging arrays placed on each temporal lobe. Each array consists of 5 sources and 5 detectors, providing a total of 19 source–detector pairs per array. Each array had 13 source–detector separations at 2 cm and 6 at 4.5 cm (Figure 1).
Fig. 1.
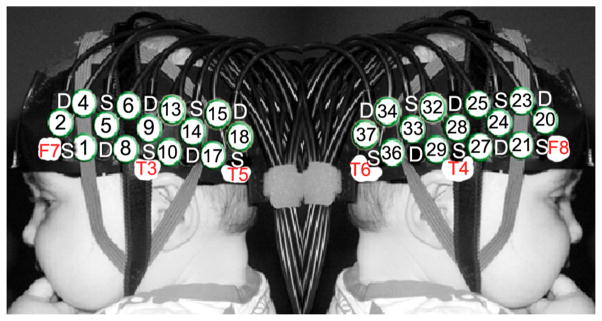
The custom-made headgear consisting of two arrays. Each array has 5 detectors (D) and 5 sources (S). This configuration allows a total of 19 channels for each array, 13 at S–D separation of 2cm (numbered in circles) and 6 at S–D separation of 4.5cm.
Before the infants began the study, measurements of their head circumference, the distance between glabella and ears, and glabella and inion were taken, and the location of the channels and arrays relative to these anatomical landmarks were recorded. The distance from the midpoint of the headband over the forehead (the glabella) to the midpoint of the temporal arrays (channel 9, left hemisphere; 28, right hemisphere) is fixed at 11 cm and is aligned approximately with T3 and T4 of the 10–20 system on an average 5-month-old infant head. A fiducial was placed over the glabella and photographs of the infant facing sideways and towards the camera were taken while wearing the headgear.
T2 weighted MRI structural of the head was obtained with a fiducial placed over the grabella. A 3D reconstruction of the head was obtained from the T2 weighted MRI structural scan. The coordinates of the fiducials and anatomical marks according to the 10/20 coordinate system were obtained in relation to anterior commissure (AC) and were marked on the 3D head images. These marks along with the photographs where used to reconstruct the placement of the headgear on the 3D head and subsequently mark the optode and channel positions (Figure 2a). The brain was then extracted from the individual MRI scans and channels and optode positions were also projected on the 3D brain reconstruction (Figure 2b).
Fig. 2.
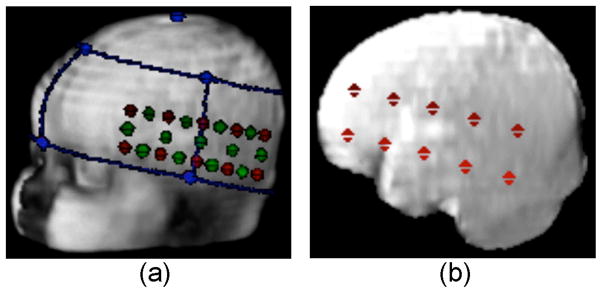
(a) Head volume co-registered with the optical headgear. The main anatomical landmarks (left pre-auricular, nasion, vertex- blue dots), optodes (red dots) and channels (green dots). (b) Brain volume extracted from the head volume co-registered with the optode positions (red dots).
2.3 Optical Image reconstruction
Data were acquired and low-pass filtered (cut-off frequency of 1.8 Hz) for all the trials. Then each trial was separated into blocks consisting of 4 s baseline, followed by a 10 s stimulus and a 10 s post-stimulus baseline period. Each block was detrended using a linear fit between the last 4 s of the pre-stimulus baseline and the last 4 s of the post-stimulus baseline period to remove any effects of baseline drift throughout the experiment [3]. Trials for each experimental condition were averaged for each subject. This resulted in a time course for each of the three stimuli per infant.
A multispectral method involving reconstructing chromophore concentrations using all measurements at both wavelengths simultaneously was used to obtain 3D OT images during activation. We assumed that the true chromophore concentrations were close to an initial estimate and any changes were small, and used a linear approximation to reconstruct the difference in chromophore concentrations[7]. For two measurement wavelengths (λ1, λ2) and two chromophores (c1, c2) the linear multispectral method solves the matrix equation , where ΔAλ = [ΔAλ1 ΔAλ2 ]T represents the changes in the logarithm of the measured data and Δc = [Δc1 Δc2]T the chromophore concentration changes in μMolar (μM). The matrix J = [Jλ1ε1,λ1 Jλ1ε2,λ1; Jλ2ε1,λ2 Jλ2ε2,λ2] is the Jacobian or sensitivity matrix (in units of mm) and ε is the extinction coefficient of the corresponding chromophore (in mm−1 μM−1). It has dimensions 2M × 2N, where M represents the number of measurements and N is the number of image pixels. The Jacobian was calculated for each wavelength using the software package TOAST (Temporal Optical Absorption and Scattering Tomography) [8]. It uses the finite element method (FEM) to model the propagation of light through highly scattering tissue using the diffusion equation, given an estimate of the medium optical properties and optode positions. The medium is considered to be a homogeneous slab with refractive index n = 1.4, absorption coefficient μa = 0.038 mm−1 and reduced scattering coefficient μ= 0.75 mm−1 at wavelength 770 nm and μa = 0.042 mm−1 and μs = 0.71 mm−1 at wavelength 850 nm. A FEM mesh with 32 615 nodes, 21 845 elements and dimensions 120 mm × 60 mm × 40 mm was generated with the meshing software NETGEN [9].
3 Results
Figure 3 shows the 3D optical topography image reconstructions obtained during one of the experimental conditions (Voice). Images show 3D reconstructions of HbO2 changes as a function of time obtained at a depth of approximately 1.5cm. Changes in HbO2 are obtained for both the right and left hemispheres. In the right hemisphere the images show an evident increase in HbO2 upon the onset of the stimulus gradually decreasing when the stimulus ceases. In this case the images are in good agreement with the 2D time course activation data. The time course data for the left hemisphere appear to be noisy and this is reflected in the 3D images showing an increase in HbO2 before and after the onset of the stimulus.
Fig. 3.
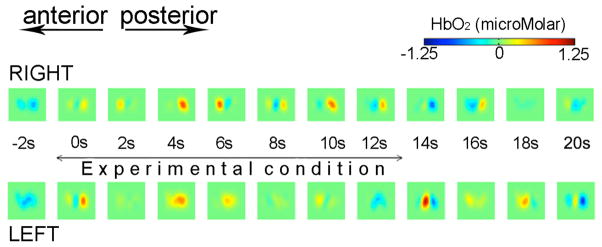
Optical topography image reconstructions showing changes in HbO2 as a function of time during one of the experimental conditions (Voice) for the left hemisphere and right hemisphere.
Figure 4 shows one of the 3D optical topography reconstruction images co-registered onto the brain of the individual infant. The 3D brain extracted from the MRI structural was converted into a 2D image. The optical topography reconstruction was scaled, translated and rotated accordingly and was co-registered on the brain image.
Fig. 4.

Optical topography image reconstruction co-registered onto the infant’s own brain.
4 Conclusions
We have used optical topography and reconstructed changes in HbO2 as a function of time during functional activation in a 4 month old infant. We have developed a method for co-registering optical topography reconstruction images onto anatomical brain extracted from the individuals MRI structural. Co-registration of functional activation could lead to better and more accurate interpretation of the information provided by brain imaging techniques. This could be used to delineate cognitive development of the infant brain.
References
- 1.Lloyd-Fox S, Blasi A, Elwell CE. Illuminating the developing brain: The past, present and future of functional near infrared spectroscopy. Neuroscience and Behavioural Reviews. 2010;34:269–284. doi: 10.1016/j.neubiorev.2009.07.008. [DOI] [PubMed] [Google Scholar]
- 2.Lloyd-Fox S, Blasi A, Volein A, Everdell N, Elwell CE, Johnson MH. Social perception in infancy: a near infrared spectroscopy study. Child Dev. 2009;80:986–999. doi: 10.1111/j.1467-8624.2009.01312.x. [DOI] [PubMed] [Google Scholar]
- 3.Blasi A, Lloyd-Fox S, Everdell N, Volein A, Tucker L, Csibra G, Gibson A, Hebden JC, Johnson MH, Elwell CE. Investigation of depth dependent changes in cerebral haemodynamics during face perception in infants. Phys Med Biol. 2007;52:6849–6864. doi: 10.1088/0031-9155/52/23/005. [DOI] [PubMed] [Google Scholar]
- 4.Lloyd-Fox S, Blasi A, Mercure E, Elwell CE, Johnson MH. The emergence of cerebral specialisation for the human voice over the first months of life. Social Neuroscience. 2012;7:317–330. doi: 10.1080/17470919.2011.614696. [DOI] [PubMed] [Google Scholar]
- 5.Taga G, Asakawa K, Maki A, Konishi Y, Koizumi H. Brain imaging in the awake infants by near infra-red optical topography. Proc Natl Acad Sci USA. 2003;100:10722–10727. doi: 10.1073/pnas.1932552100. [DOI] [PMC free article] [PubMed] [Google Scholar]
- 6.Everdell NL, Gibson AP, Tullis IDC, Vaithianathan T, Hebden JC, Delpy DT. A frequency multiplex near infrared optical topography system for imaging functional activation in the brain. Rev Scient Instr. 2005;76:093705. [Google Scholar]
- 7.Correia T, Lloyd-Fox S, Everdell N, Blasi A, Elwell CE, Hebden JC, Gibson A. Three dimensional optical topography of brain activity in infants watching videos of human movement. Phys Med Biol. 2012;57:1135–1146. doi: 10.1088/0031-9155/57/5/1135. [DOI] [PubMed] [Google Scholar]
- 8.Arridge SR, Hebden JC, Schweiger M, Schmidt FEW, Fry WME, Hillman EMC, Dehghani H, Delpy DT. A method for three dimensional time-resolved optical tomography. Int J Imaging Syst Technol. 2000;11:2–11. [Google Scholar]
- 9.Schoberl J. NETGEN-an advancing front 2D/3D-mesh generator based on abstract rules. Comput Vis Sci. 1997;1:41–52. [Google Scholar]