Abstract
The abundance of Canadian lynx follows 10-year density fluctuations across the Canadian subcontinent. These cyclic fluctuations have earlier been shown to be geographically structured into three climatic regions: the Atlantic, Continental, and Pacific zones. Recent genetic evidence revealed an essentially similar spatial structuring. Introducing a new population model, the “climate forcing of ecological and evolutionary patterns” model, we link the observed ecological and evolutionary patterns. Specifically, we demonstrate that there is greater phase synchrony within climatic zones than between them and show that external climatic forcing may act as a synchronizer. We simulated genetic drift by using data on population dynamics generated by the climate forcing of ecological and evolutionary patterns model, and we demonstrate that the observed genetic structuring can be seen as an emerging property of the spatiotemporal ecological dynamics.
Keywords: spatial phase synchrony, climatic forcing, phase-dependent demography, genetic diversification
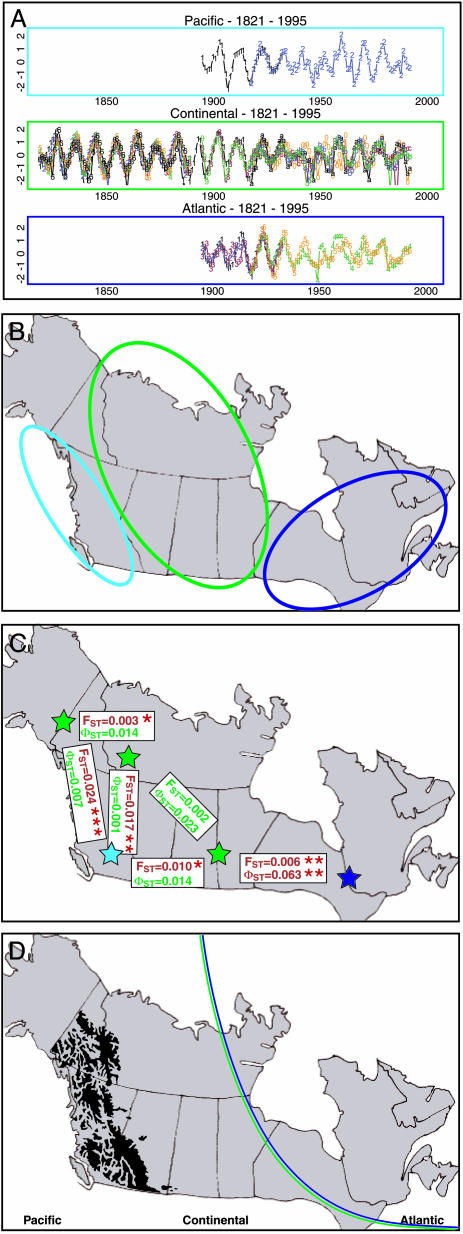
The Canadian lynx (Lynx canadensis), distributed throughout the boreal forest of North America (1), is closely linked to its main prey, the snowshoe hare (Lepus americanus). Both species undergo rather violent population fluctuations (Fig. 1A), a phenomenon that has influenced the field of ecology since Charles S. Elton's pioneering paper of 1924 (2–7). Here we link ecological and genetic spatial patterns.
Fig. 1.
Canadian lynx population cycles, climatic zones, and genetic differentiation throughout the boreal forest of North America. (A) The Hudson Bay Company (5) and the Statistics Canada (15) time-series data used by Stenseth et al. (12) to identify the three climatically determined geographic zones. The abundance of lynx is given as log numbers. (B) The three climatically determined geographic zones identified by Stenseth et al. (12): the Pacific (light blue), Continental (green), and Atlantic (dark blue). (C) Rueness et al. (14) recently reported on the large-scale genetic structuring of the Canadian lynx. The geographic center of each of five sampling regions is denoted by a star (following the same color-code as in B): the Atlantic zone (East, n = 46), three regions within the Continental zone (Prairie, n = 48; North, n = 25; and Northwest, n = 40), and the Pacific zone (British Columbia, n = 24). The level of genetic differentiation observed between regions in microsatellites and mitochondrial DNA are given as FST and ΦST values, respectively. ΦST was calculated from haplotype frequencies. Significant differentiation, as shown by the FST/ΦST values, is shown in red, and nonsignificant values are given in green; significance levels are indicated by asterisks: *, 0.05; **, 0.01; and ***, 0.001. (D) The Rocky Mountains, a classic ecological barrier that also corresponds to climatically based differences, characterizes the Canadian subcontinent in the West. In the East, some climatically based, geographically invisible boundary is distinguished. The correlation between the NAO index and local winter and spring temperatures has opposite signs on either side of the double-colored curved line (10).
From a climatic perspective, the Canadian subcontinent may be divided into three geographical regions, referred to as the Pacific, Continental, and Atlantic zones (Fig. 1B), each of which is differently affected by the North Atlantic oscillation (NAO) (8–10). The Pacific zone is in addition influenced by the Pacific North American pattern (11). Based on time-series modeling, Stenseth et al. (12) concluded that the underlying population models for lynx differed among zones, and the structures of the deduced models suggested that the interaction between lynx and hare might be influenced by the climatic conditions specific for each region. Interestingly, a comparable geographic structuring has been observed for mink and muskrat (13). Stenseth et al. (12) did not, however, address the question of within-zone synchrony; similarity with respect to the underlying population model certainly need not imply synchrony. However, to study the impact of ecological processes on genetic differentiation, a detailed understanding of synchrony within and between zones is crucial. A recent large-scale genetic study revealed that the spatial genetic structuring of the Canadian lynx is similar, with higher levels of differentiation between the three climatic regions rather than within them (Fig. 1C). In western Canada, the Rocky Mountains likely hinder lynx dispersal (and hence gene flow) between the Pacific and Continental zones. In eastern Canada, on the other hand, no such physical barrier exists (Fig. 1D); however, the impact of the NAO differs between the Continental and Atlantic zones, leading to differences in the local climates (8). Because no traces of historical isolation of lynx populations were found in the genetic data, Rueness et al. (14) proposed that the observed genetic divergence between the Continental and Atlantic regions might be linked to the observed spatial patterns of the population dynamics and the influence of the differential climatic regimes.
The scope of this article is two-fold. First, we investigate synchrony within and between the three climatic zones by using empirical time-series data and synthetic data generated by a new population model, the climate forcing of ecological and evolutionary patterns (CEEP) model. The CEEP model was used to test the impact of climatic forcing as a synchronizer of the regional density fluctuations. The model is based on the parameters found by Stenseth et al. (12) and supplemented by new estimates of the effect of climatic forcing in the three geographic regions (see supporting information, which is published on the PNAS web site). Second, we use the CEEP model to simulate genetic drift to determine to what extent synchrony/asynchrony between pairs of populations influences the process of genetic diversification. In these simulations, assumptions about lynx demography incorporated into the model are based on patterns from empirical studies. Altogether, our study provides an approach to integrate genetic and ecological processes. As such, this approach makes it possible to directly assess the effect of spatial differences in population dynamics and dispersal behavior on genetic geographic structuring within a species.
Materials and Methods
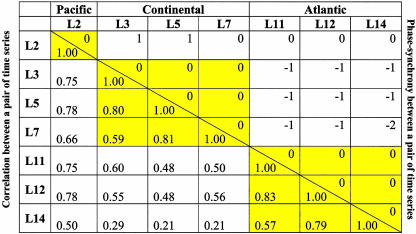
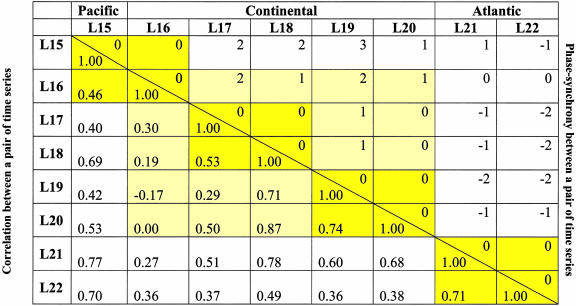
Assessing Synchrony. We analyzed data on lynx from the old Hudson Bay Company records, 1897–1934 (3), and from the modern Statistics Canada records, 1920–1994 (15), with respect to correlation and phase synchrony (see below and supporting information). Although the older time series within the Continental and Atlantic regions are rather restricted in spatial coverage, the modern time series cover a wider geographical range, including areas in central Canada missing in the older time series (Tables 1 and 2). Before 1897, there are too few time series to address the issue of between-region synchrony (see supporting information).
Table 1. Synchrony between pairs of lynx time series defined in the period 1897–1934.
The names of the series are those defined in Stenseth et al. (4): L2, West; L3, MacKenzie River; L5, Athabasca Basin (northern Alberta); L7, West Central (northern Saskatchewan); L11, James Bay; L12, Lakes; and L14, Gulf. L2 belongs to the Pacific Zone; L3, L5, and L7 belong to the Continental Zone; and L11, L12, and L14 belong to the Atlantic Zone. For each pair of time series, the optimal shift (above the diagonal line), and the correlation (below the diagonal line) are given. Yellow-shaded blocks indicate the geographical zone structure.
Table 2. Synchrony among pairs of lynx time series defined in the period 1929–1994.
The names of the series are those defined in Stenseth et al. (4): L15, British Columbia; L16, Yukon Territory; L17, Northwest Territory; L18, Alberta; L19, Saskatchewan; L20, Manitoba; L21, Ontario; and L22, Quebec. L15 and L16 belong to the Pacific Zone; L17, L18, L19, and L20 belong to the Continental Zone; and L21 and L22 belong to the Atlantic Zone. For each pair of time series, the optimal time shift (above the diagonal line), and the correlation (below the diagonal line) are given. Yellow-shaded blocks indicate the geographical zone structure; the lighter shading indicates that the entire Continental region is substructured.
Simply calculating correlations between pairs of log-transformed time series does not reveal a clear-cut spatial pattern with respect to synchrony; correlations between two time series depend, to a large extent, on the detailed year-to-year fluctuations of the populations. Because we primarily are concerned with the degree to which populations tend to increase (and decrease) simultaneously, we chose to evaluate the phase synchrony (16–18) between populations. The degree of phase synchrony between each pair of time series x1(t) and x2(t), was quantified by calculating the time shift, k, that leads to the optimal alignment of the troughs of the series x1(t) and x2(t-k) (see supporting information for further details).
Generating Synthetic Data. The following piecewise linear autoregressive model (19, 20) (based on the models of Stenseth et al., ref. 12) with an external forcing, ft, resembling the NAO (21) and the CEEP model was used to generate synthetic data:
 |
[1] |
where yr,t is the log-transformed abundance of lynx (i.e., the log of the number of individuals within a population) at a site in region r and for year t, ft is the external forcing, εr,t is the local environmental stochasticity (modeled as normally distributed noise, with zero mean and unit deviation, that is time- and site-independent), each β is a parameter describing the degree of density dependence (estimated on the basis of the time-series data), and ϕ and the Ψ are the coefficients for the climatic forcing and local environmental stochasticity, respectively. The effect of the external climatic forcing (Ψ) is different for either side of the hypothesized invisible barrier in eastern Canada shown in Fig. 1D (see supporting information). Oscillators driven by identical threshold models, but with different initial conditions, may easily be phase-synchronized by even a very slight common external forcing, provided that the period of the external forcing is fairly close to the natural period of the underlying nonlinear model (N.C.S., and H.V., unpublished work). The external forcing term was assumed to be ft = sin(2π t/7.5), where the period 7.5 was chosen to correspond to the dominant period in the North Atlantic oscillations (for an example, see ref. 10).
Synthetic ecological time-series data were generated with the CEEP model. For each time series being generated, initial states (y1 and y2) were drawn independently from a uniform distribution over the interval [4,8] corresponding to the observed higher range of log-transformed abundances. After a “burn-in period” of 100 time steps, the next 100 time steps were used in the further analysis of the phase synchrony. To produce the data required for the analysis summarized in Table 3, the above procedure was repeated 1,000 times for each pair of models. See supporting information for details on how the simulations were performed; the source code (in s-plus) may be obtained on request.
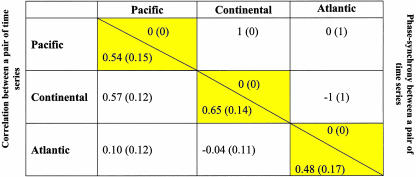
Table 3. Synchony between pairs of synthetic time series generated by the CEEP model.
For the Pacific zone we have used the L2 (West) model, for the Continental zone we have used the L3 (Mackenzie River) model, and for the Atlantic zone we have used the L14 (Gulf) model from Stenseth et al. (12). Yellow-shaded blocks indicate the geographical zone structure. For each pair of models, 1,000 independent pairs of time series were generated, each pair consisting of one time series from each of the two models. The optimal time shift and the correlation between the time series in each pair were found. Here is shown the median optimal time shift (above the diagonal) and the average correlation (below the diagonal) across all pairs. Numbers in parentheses are the interquartile range of the optimal time shifts (above ethe diagonal) and the SD of the correlations (below the diagnonal) across all pairs. Interquartile range is a measure of spread given by the difference between the third and first quartiles of a sample; i.e., interquartile range = Q3 - Q1, where 25% of the data lie below the point Q1 and 25% of the data lie above the point Q3. The measure is to be favored when normality cannot be assumed (see ref. 32). Source code (in s-plus) can be provided on request.
The synthetic time-series data, generated with parameters as estimated for each of the three regions, were analyzed with respect to phase synchrony in the same manner as the empirical time-series data on the Canadian lynx (see above and supporting information).
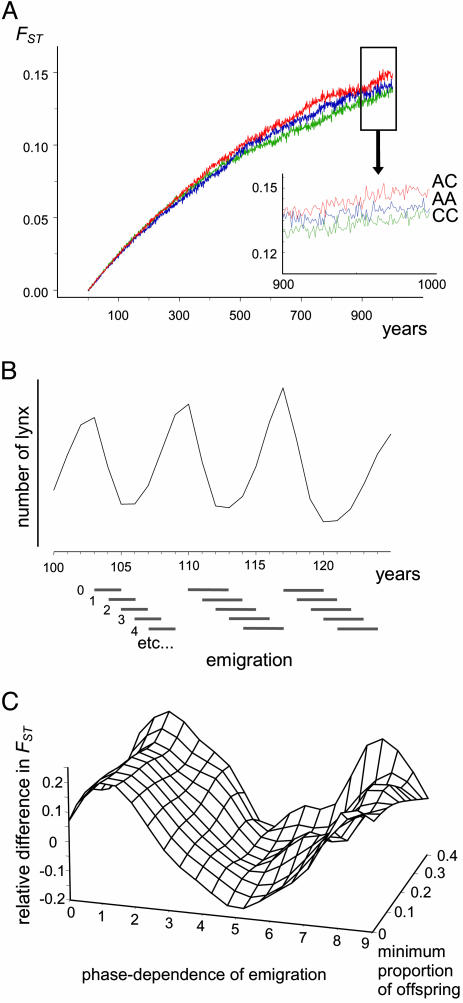
Modeling the Evolution of the Genetic Structuring. By using time-series data generated by the CEEP model, genetic drift at one haploid locus (representing mitochondrial DNA) was simulated for pairs of populations characterized by continental dynamics (CC) and Atlantic dynamics (AA), as well as for pairs of populations in which one exhibited Continental dynamics and the other exhibited Atlantic dynamics (AC). Population sizes for each simulated year were given by the CEEP model. The number of individuals per year fluctuated by an order of magnitude from 500 to 5,000, with considerable variation from cycle to cycle (because of the inherent stochasticity). The time series were standardized for equal mean and variance. Whenever a population was growing, offspring were added by randomly drawing with replacements among the haplotypes of all adults. Whenever a population was decreasing, a minimum number of offspring was added and the population was reduced to the new size by randomly removing excess haplotypes among the adults. We used observed demographic rates from field studies of the lynx cycle in this model. Three rates are clearly phase-dependent in lynx: During the crash years, the rate of dispersal is particularly high (23, 24) and rates of reproduction as well as survival are low (24–27). Empirical studies have shown that emigration rates are up to 5-fold higher during the cyclical decline than at other phases (24, 28, 29). Although the degree to which emigration translates into higher rates of effective dispersal (i.e., with emigrants settling and successfully breeding in new populations) has not been measured, we assume that increased dispersal implies increased gene flow.
The following assumptions were made for the simulations: Initially, populations were identical with 50 haplotypes at equal frequencies. Immigration was always possible, whereas emigration was deterministic and phase-dependent. In years where phase dependence allowed emigration, one migrant (i.e., a randomly chosen haplotype) was transferred from one population to the other. Reciprocal exchange of migrants occurred if emigration took place in both populations simultaneously. The phase dependency of emigration was simplified to one migrant in some years and none in others, because this is a sufficiently low number to allow simulation of a certain amount of differentiation, which is necessary to compare levels of differentiation under different conditions. Simulations were also performed for five migrants versus one migrant, and the simulations yielded qualitatively similar results (see supporting information). The assumed numbers may seem low in relation to lynx populations, but considering that (i) we simulate long-distance effective dispersal among regions, (ii) we simulate only the female part of the population (modeling mitochondrial DNA), and (iii) more than a few migrants per generation would make differentiation among populations impossible (the observed differentiation among regions is significant; cf. Fig. 1), this assumption seems justified. The effect of phase dependence of emigration was assessed by changing the initial condition of emigration in years of decreasing densities (i.e., emigration if Nt < Nt-1) by 1 year at a time (Nt-1 < Nt-2, Nt-2 < Nt-3, etc; see Fig. 2B). Thus, emigration in all phases was considered, and the total number of migrants remained the same for all simulations. Phase dependence of reproduction was simulated by varying the minimal proportion of new offspring added to the population each year from almost no reproduction (assumed to be 10 individuals within a population of ≈500 individuals in the low phase) to a minimum of 40% of newborn offspring each year. There was no age structure, and maximal adult survival was assumed to be 0.9 per year (implying that some individual's lives may be very long). Simulations were also performed with four adult age classes and a maximal age of 4 years, and the results with respect to genetic differentiation were essentially identical to those reported here. A mutation rate of 5 × 10⁻⁵ was assumed (“infinite allele” model; see ref. 30).
Fig. 2.
Linking ecology and genetics in Canadian lynx. (A) Mean increase in differentiation (FST, average of 200 runs) with time between AC populations (red line), CC populations (green line), and AA populations (blue line). Over the simulated 1,000 years, AC populations, which were not in phase synchrony (Table 3), diverged on average more than the two other types of population pairs. The AA populations diverged more than the CC populations, although both types were in phase synchrony. However, the average correlation between simulated AA series was lower than between CC series (Table 3), which explains the slightly faster differentiation for AA. Inset shows the genetic divergence during the last 100 years. (B) Quantification of the phase dependency of emigration: 0 corresponds to emigration only in years of decreasing densities (Nt < Nt-1); 1 represents emigration 1 year later, etc. (C) Sensitivity analysis: importance of assumptions about the phase dependence of emigration and the minimal proportion of new offspring each year for the relative difference in differentiation between synchronous (CC) and asynchronous (AC) pairs of populations. The relative difference in FST corresponds to FST between AC populations minus FST between CC populations relative to FST between CC populations after 1,000 years of drift. Thus, a positive value indicates faster differentiation in asynchronous populations. The specific assumptions regarding the phase dependence of dispersal (emigration in the model) influence the spatial pattern of genetic differentiation between populations. The genotypes of migrants entering a low-density population are more likely to spread in the new population than those of migrants entering at other phases of the cycle. They are thus more efficient in limiting genetic differentiation. Under our first set of assumptions (emigration in years of decreasing densities), the last migrants at the end of the crash were found to be critical for limiting differentiation between synchronous populations. In the case of emigration at increasing or high densities, on the other hand, migrants entering a low-density population (which must have asynchronous dynamics relative to the population the dispersing individual comes from) have a stronger effect in reducing differentiation than those exchanged between synchronous populations, which enter a high-density population.
Genetic differentiation, FST, between pairs of populations was estimated for each year from a random sample of 50 individuals. Two hundred pairs of populations were simulated over 1,000 years for each combination of conditions (the length of the simulations was chosen to see an effect for the population sizes used). The difference in genetic differentiation under ecological synchrony versus asynchrony was measured as the relative difference in FST between AC populations (average of 200 iterations) and FST between CC populations (average of 200 iterations) after 1,000 years of drift. To minimize the effect of random fluctuations from year to year, the average differentiation over 10 years (i.e., years 991–1,000 in the simulations) was used. The source code (in s-plus) may be obtained on request.
Results
Within-Zone and Between-Zone Synchrony. The analyses of phase synchrony of the time-series data for lynx from the old Hudson Bay Company records 1897–1934 (3) and from the modern Statistics Canada records 1920–1994 (15) revealed a very clear regional pattern for both sets of data (Tables 1 and 2). The older series all show clearer phase synchrony within regions than between regions; the Continental region is, by and large, 1 year ahead of the Pacific and the Atlantic regions. Accordingly, the Pacific region and the Atlantic region are more or less in synchrony. A similar pattern is seen in the modern series: the Continental region is 1–3 years ahead of the Pacific region and 1–2 years ahead of the Atlantic region. The Continental region is more strongly synchronized within even smaller subregions for the modern time series (Table 2 and supporting information). The absence of such substructuring within the Continental region for the older period might be due to a shortage of data for that period. The synthetic time-series data generated from the CEEP model produced patterns of synchrony similar to those from the historical lynx time-series data. The Continental region is ahead of the Pacific and Atlantic regions (by a median lag of 1 year), whereas the Pacific and Atlantic regions are more or less in synchrony (Table 3). This finding is consistent with the hypothesis that the spatial structuring of the phase synchronization is caused by differences in the climatic forcing.
Within-Zone and Between-Zone Genetic Differentiation. Simulations of genetic drift at one haploid locus, based on the assumptions about phase-specific demographic rates of lynx described above, showed that asynchronous populations (AC) diverged, on average, faster than synchronous populations (CC or AA; Fig. 2 A). Although the outcome of individual simulation runs varied greatly (mainly due to the stochasticity inherent to genetic drift at one locus), levels of differentiation were significantly higher between pairs of AC than between pairs of CC populations after 1,000 years (see supporting information). Phase dependence of emigration, as modeled in Fig. 2B, is clearly the crucial assumption affecting this outcome. The strongest reduction in genetic differentiation between synchronous populations was observed when emigration primarily occurred during the later years of the decrease and during the low phase (1 and 2 in Fig. 2C). Emigration during years of increasing densities or during the peak phase led to the opposite effect (i.e., more rapid differentiation between synchronous populations). This pattern may be explained by the fact that, in cyclic populations, genetic drift occurs primarily in the crash and during the low phase. Migration during this phase is thus most effective in limiting differentiation. The assumptions related to the phase dependency of reproduction did not have any major effect on the difference in genetic divergence (Fig. 2C).
Discussion
The structuring of the lynx time-series data into three climatic zones (Tables 1 and 2) is consistent with the hypothesis, proposed by Stenseth et al. (12), that the spatial pattern in the population dynamics of lynx is synchronized by external factors typical for the Pacific, Continental, and Atlantic zones. The patterns of synchrony observed in the time series generated by the CEEP model (Table 3) show that climatic forcing might indeed cause synchrony within regions and asynchrony between regions. By using the same model in simulations of population genetic processes, we demonstrate that the patterns of phase synchrony may also directly affect the process of genetic diversification. We therefore suggest that the reciprocal relationship between genetic and ecological spatial structuring may be shaped by the same external factors, in this case, climatic forcing.
Rueness et al. (14) proposed a link between population dynamics and genetic geographical structuring. Given that migration of lynx is phase-dependent (more lynx migrate in the crash phase), our results do provide a possible explanation to the genetic differentiation observed (Fig. 1C). Our study contributes a specific and natural-history-based example of what is expected from the more general analysis recently reported by Doebeli and Dieckmann (31), which showed how environmental gradients may lead to diversification in the absence of physical barriers. Although we do not yet have a full understanding of how the ecology of lynx (in particular, the lynx–hare interaction) is affected by the spatial structuring described here, we may suggest some ecological mechanisms contributing to the differentiation observed, in addition to the direct effect of asynchronous population dynamics. Assuming that the environmental conditions for lynx differ among the climatic zones, it is likely that individual lynx familiar with the snow and prey conditions of a certain area would stay within this area when dispersing, because there is a cost to learning how to use a new habitat (29). The differential impact of the NAO on local snow and weather conditions may therefore discourage migration between the zones.
In our effort to shed new light on the spatial structuring of the Canadian lynx, we have introduced a general model (CEEP) integrating climatic, ecological, and genetic processes. Building on the same theoretical framework but including other parameter values, the CEEP model may be used to test whether climatic regimes have an impact on the spatial synchronization and genetic structuring of other cyclic species. By including species-specific information on demography, we can test whether diversification increases faster between asynchronous populations in other species or whether the observed patterns depend on the peculiar ecology of the Canadian lynx.
Supplementary Material
Acknowledgments
We thank Michael Doebeli, Øystein Flagstad, Jim Hurrell, Veijo Kaitala, Atle Mysterud, Jon Olav Vik, Nigel G. Yoccoz, and three anonymous reviewers for helpful comments. This work was supported by grants from the Norwegian Research Council and the University of Oslo.
This paper was submitted directly (Track II) to the PNAS office.
Abbreviations: CEEP, climate forcing of ecological and evolutionary patterns; NAO, North Atlantic oscillation; CC, continental dynamics; AA, Atlantic dynamics; AC, pairs of populations in which one exhibits CC and the other exhibits AA.
References
- 1.Quinn, N. W. S. & Parker, G. (1987) in Wild Furbearer Management and Conservation in North America, eds. Novak, M., Baker, J. A., Obbard, M. E. & Malloch, B. (Ontario Trappers Assoc., North Bay, ON), pp. 683-694.
- 2.Elton, C. S. (1924) Br. J. Exp. Biol. 2, 119. [Google Scholar]
- 3.Elton, C. S. & Nicholson, M. (1942) J. Anim. Ecol. 11, 215-244. [Google Scholar]
- 4.Stenseth, N. C. (1995) Science 269, 1061-1062. [DOI] [PubMed] [Google Scholar]
- 5.Ranta, E., Lindström, J. & Lindén, H. (1995) J. Anim. Ecol. 64, 767. [Google Scholar]
- 6.Ranta, E., Kaitala, V. & Lindström, J. (1997) Ecography 20, 454-460. [Google Scholar]
- 7.Ranta, E., Kaitala, V. & Lundberg, P. (1998) Oikos 83, 376. [Google Scholar]
- 8.Hurrel, J. W. (1996) Geophys. Res. Lett. 23, 665-668. [Google Scholar]
- 9.Stenseth, N. C., Mysterud, A., Ottersen, G., Hurrell, J. W., Chan, K.-S. & Lima, M. (2002) Science 297, 1292-1296. [DOI] [PubMed] [Google Scholar]
- 10.Stenseth, N. C., Ottersen, G., Hurrell, J. W., Mysterud, A., Lima, M., Chan, K.-S., Yoccoz, N. G. & Ådlandsvik, B. (2003) Proc. R. Soc. London Ser. B 270, 2087-2096. [DOI] [PMC free article] [PubMed] [Google Scholar]
- 11.Trenberth, K. E. & Hurrell, J. W. (1994) Clim. Dyn. 9, p 303-319. [Google Scholar]
- 12.Stenseth, N. C., Chan, K. S., Tong, H., Boonstra, R., Boutin, S., Krebs, C. J., Post, E., O'Donoghue, M., Yoccoz, N. G., Forchhammer, M. C. & Hurrell, J. W. (1999) Science 285, 1071-1073. [DOI] [PubMed] [Google Scholar]
- 13.Yao, Q., Tong, H., Finkenstadt, B. & Stenseth, N. C. (2000) Proc. R. Soc. London Ser. B 276, 2459-2467. [DOI] [PMC free article] [PubMed] [Google Scholar]
- 14.Rueness, E. K., Stenseth, N. C., O'Donoghue, M., Boutin, S., Ellegren, H. & Jakobsen, K. S. (2003) Nature 425, 69-72. [DOI] [PubMed] [Google Scholar]
- 15.Dominion Bureau of Statistics. (1965) Statistics Canada 1983–1995 (Dominion Bureau of Statistics, Ottawa).
- 16.Haydon, D. T., Stenseth, N. C., Boyce, M. S. & Greenwood, P. E. (2001) Proc. Natl. Acad. Sci. USA 98, 13149-13154. [DOI] [PMC free article] [PubMed] [Google Scholar]
- 17.Haydon, D. T., Greenwood, P. E., Stenseth, N. C. & Saitoh, T. (2003) Proc. R. Soc. London Ser. B 270, 435-445. [DOI] [PMC free article] [PubMed] [Google Scholar]
- 18.Cazelles, B. & Stone, L. (2003) J. Anim. Ecol. 72, 953-968. [Google Scholar]
- 19.Tong, H. (1990) Non-Linear Time Series: A Dynamical System Approach (Clarendon, Oxford).
- 20.Chan, K.-S. & Tong, H. (2001) Chaos: A Statistical Perspective (Springer, New York).
- 21.Nayfeh, A. H. & Mook, D. T. (1979) Nonlinear Oscillations (Wiley, New York).
- 22.Hurrel, J. W. & Van Loon, H. (1997) Clim. Change. 36, 301-326. [Google Scholar]
- 23.Poole, K. G. (1994) J. Wildlife Manage. 58, 608-618. [Google Scholar]
- 24.Slough, B. G. & Mowat, G. (1996) J. Wildlife Manage. 60, 946-961. [Google Scholar]
- 25.Mowat, G., Slough, B. G. & Boutin, S. (1996) J. Wildlife Manage. 60, 441-452. [Google Scholar]
- 26.O'Donoghue, M., Boutin, S., Krebs, C. J. & Hofer, E. J. (1997) Oikos 80, 150-162. [Google Scholar]
- 27.Mowat, G. & Slough, B. G. (1998) Can. Field-Naturalist 112, 32-36. [Google Scholar]
- 28.Poole, K. G. (1997) J. Wildlife Manage. 61, 497-505. [Google Scholar]
- 29.O'Donoghue, M. (2001) in Ecosystem Dynamics of the Boreal Forest, eds. Krebs., C. J., Boutin, S. & Boonstra, R. (Oxford Univ. Press, Oxford). pp. 275-323.
- 30.Kimura, M. & Crow, J. F. (1964) Genetics 49, 725-738. [DOI] [PMC free article] [PubMed] [Google Scholar]
- 31.Doebeli, M. & Dieckmann, U. (2003) Nature 421, 259-264. [DOI] [PubMed] [Google Scholar]
- 32.Keeping, E. S. (1995). Introduction to Statistical Inference (Dover, New York).
Associated Data
This section collects any data citations, data availability statements, or supplementary materials included in this article.


